R E S E A R C H A R T I C L E
Open Access
Validation of the Spanish version of the
Multidimensional State Boredom Scale
(MSBS)
Marta Alda
1, Joaquin Minguez
2, Jesús Montero-Marin
3, Margalida Gili
5, Marta Puebla-Guedea
4,
Paola Herrera-Mercadal
4, Mayte Navarro-Gil
4*and Javier Garcia-Campayo
1Abstract
Background:Boredom, which is a common problem in the general population, has been associated with several psychiatric disorders. The Multidimensional State Boredom Scale (MSBS) was developed, based on a theoretically and empirically grounded definition of boredom, to assess this construct. The aim of the present study was to assess the psychometric properties of the Spanish validated version of the MSBS in a multi-age sample recruited from the general population.
Methods:The patients (N = 303) were recruited from primary care settings. In addition to the sociodemographic variables and the MSBS, the General Health Questionnaire 28 items (GHQ-28), Positive and Negative Affect Scale (PANAS), Negative subscale and the Mindful Attention Awareness Scale (MAAS) were administered. We used confirmatory factor analysis (CFA) to analyse the dimensionality of the MSBS. Cronbach’sαcoefficient was used to analyse the internal consistency of the scale. The consistency of the MSBS over time (test-retest reliability) was assessed using the intra-class correlation coefficient. The construct validity was examined by calculating Pearson’sr correlations between the MSBS with theoretically related and unrelated constructs. Cronbach’sαfor MSBS was 0.89 (95 % CI, 0.87–0.92), ranging from 0.75 to 0.83 for the 5 subscales.
Results:The characteristics of the final sample (N = 303) were that the participants were primarily female (66.77 %) with a mean age of 49.32 years (SD, 11.46) and primarily European (94.71 %). The CFA of the MSBS confirmed that the original five-factor model showed good fit indices: CFI = .96; GFI = .94; SRMR = .05; and RMSEA = .06 [.05–.08]. Cronbach’sαfor MSBS was 0.89 (95 % CI, 0.87–0.92), ranging from 0.75 to 0.83 for the 5 subscales. The MSBS showed a test-retest coefficient measured with an ICC of 0.90 (95 % CI, 0.88–0.92). The ICC for the 5 subscales ranged from 0.81 to 0.89. The MSBS showed a significant negative correlation with MAAS and a significant positive correlation with the GHQ (total score and subscales) and PANAS-Negative Affect.
Conclusions:The Spanish version of the MSBS has been validated as a reliable instrument for measuring boredom in the general population. This study will facilitate the assessment of boredom for clinical and research purposes in Spanish-speaking populations.
Keywords:Boredom, Questionnaire, Validation, Multidimensional State Boredom Scale
* Correspondence:[email protected]
4
Primary Care Prevention and Health Promotion Research Network (RedIAPP), Zaragoza, Spain
Full list of author information is available at the end of the article
Background
Boredom can be defined as “the experience of being disengaged from the world and stuck in a dissatisfying present” [1]. It is a common problem: in a survey of North American youth, 91 % of the respondents reported that they experience boredom [2]. It has been associated with several psychiatric disorders, such as depression and anxiety [3], somatisation [4], overeating and binge eating [5], pathological gambling [6], alcohol abuse [7] and marijuana use [8]. Additionally, boredom has been associ-ated with a decrease in psychological well-being, such as lowered levels of life meaning [9], life satisfaction [3] and job satisfaction [10]. Finally, boredom is even associated with mortality, giving support to the popular phrase
“bored to death”[11].
There are several explanatory theories on boredom [1, 12]. They support a multidimensional concept of bore-dom that includes (a) lack of engagement, (b) low arousal negative affect, (c) high arousal negative affect, (d) the experience of a slow passage of time, and (e) dif-ficulty focusing attention [1].
Several scales can be used to assess boredom; however, they are either subfactors of scales measuring other con-structs or are very narrow in scope (i.e., they evaluate boredom in only one particular context, such as leisure time or sexual relationships) [1]. The only scale that is more widely used to measure this construct, i.e., the Boredom Proneness Scale [3], assesses one’s tendency to become bored (trait boredom) and does not assess the actual experience of boredom in a given moment (state boredom) [1].
A new scale, the Multidimensional State Boredom Scale (MSBS), was developed based on a theoretically and empirically grounded definition of boredom and was validated [1]. This scale shows a five-factor struc-ture, with adequate psychometric measures that posi-tively correlate with depression, anxiety, impulsivity and neuroticism and negatively correlate with life satisfaction and purpose in life [1]. The aim of the present study was to assess the psychometric properties of the Spanish vali-dated version of the MSBS in a multi-age sample re-cruited from a primary care setting.
Methods
Design
Validation study.
Participants
The participants were recruited from a primary care setting within a large study on the efficacy of computer-assisted psychotherapy [13]. The following inclusion cri-teria were used: individuals ranging in age from 18 to 65 years and who agreed to participate in this study. The exclusion criteria were any medical or psychiatric disorders
that would impede the individual from answering the ques-tionnaire correctly and poor knowledge of the Spanish language. The sample size was calculated according to the recommended 10:1 ratio for the number of subjects to the number of test items [14]. The questionnaires and protocols used in this study were approved by the Ethical Committee of the regional health authority, and the patients signed a consent form attesting to their willingness to participate in this study. The study was conducted between September 2013 and June 2014.
Measures
Sociodemographic variables
Background information from the participants included age, gender and level of education (primary school, sec-ondary school, and university).
Multidimensional State Boredom Scale (MSBS)
This is a self-reported 29-item scale with a five-factor structure: disengagement, high arousal, low arousal, in-attention and time perception. This is the only full scale measure of state boredom. It presents adequate psycho-metric properties [11], and it is the questionnaire to be validated.
The General Health Questionnaire (GHQ)
It is a screening device for identifying minor psychiatric disorders in the general population and within the com-munity or non-psychiatric clinical settings, such as pri-mary care or general medical out-patient settings. It has several versions (60, 30, 28 and 12 items) [15]. The 28-item version includes 4 subscales: somatic symptoms, anxiety and insomnia, social dysfunction and depression. The GHQ-28 has been validated in Spanish [16].
Positive and Negative Affect Schedule
The PANAS [17] is a brief measure of positive and nega-tive affect. The PANAS consists of a list of 20 adjecnega-tives (10 per subscale) rated on a 5-point scale using the time instructions desired by the researcher. Present moment instructions were used in the present study. This ques-tionnaire has been validated in Spanish [18].
The Mindful Attention Awareness Scale (MAAS)
been recently validated in Spanish showing appropriate psychometric parameters [20].
MAAS and GHQ were included because boredom proneness has been demonstrated to negatively correlate with mindfulness and positively with anxiety and depres-sion [21]. PANAS was included in the original validation [1] because it positively correlates with Negative Affect and negatively correlates with Positive Affect.
Validation process
Permission to translate and validate the MSBS was ob-tained from the original authors [1]. Two researchers, who were aware of the questionnaire’s objectives, performed the initial translation into Spanish. Each researcher trans-lated the questionnaire separately. Subsequently, two bi-lingual linguistic experts, who had no specific knowledge regarding the instrument, carried out back-translations. Finally, the two English versions were determined to be equivalent by a native English-speaking English teacher. Any differences between the translations were resolved by mutual agreement. The usual guidelines have been followed for cross-cultural adaptations [22]. The final Spanish ver-sion is shown in Annex 1. Assessments took place at two different points over a 1- to 2-week interval. The subsample for the second assessment was randomly selected.
Statistical analysis
The demographic data were analysed using the descriptive statistics of mean, standard deviation (SD) and range. Be-fore conducting the statistical analyses, we examined the data for univariate and multivariate outliers. To detect the presence of univariate outliers, the frequency distributions of each item were examined (values≥3 standard devia-tions from the mean indicate univariate outliers). The multivariate outliers were screened using the Mahalanobis distance scores for all cases (D2). A D2 probability≤0.01 indicates the existence of multivariate outliers [23]. We eliminated 3 participants who were considered to be out-liers according to a given scale.
We used the confirmatory factor analysis (CFA) to analyse the dimensionality of the MSBS. We proposed the previously described five-factor model [1]. EQS soft-ware for Windows version 6.1 [24] was used to conduct the CFA. The maximum likelihood with a robust correc-tion method was used to adjust for distribucorrec-tional problems in the data set. Although a model with a non-significant chi-square estimate is generally considered to be a model with good fit, Hu and Bentler [24] recommended com-binational rules to evaluate the model fit. Therefore, we analysed the following indices (values in parentheses de-note goodness-of-fit standards): Comparative Fit Index and Goodness of Fit Index (CFI and GFI > .90) and Root Mean Square Error of Approximation (RMSEA) and Standardised Root Mean-Square Residual (SRMR < .08)
[24]. We selected these statistics to measure the fit because previous studies have validated the performance and stability of these tests [25].
We examined the internal consistency, test-retest and construct validity of the MSBS. Cronbach’s α coefficient [26] was used to analyse the internal consistency of the scale. Corrected item-total correlations, in which an item is correlated with the total scale score, excluding itself, were tested for each item. The consistency of the MSBS total score over time (test-retest reliability) was assessed using the intra-class correlation coefficient (ICC). The construct validity was examined by correlating the MSBS with the-oretically related and unrelated constructs. Pearson’s r correlations were performed to evaluate the univariate relationships between the MSBS and the following vari-ables: psychological distress, negative affect and mind-fulness. All of the statistical analyses, except CFA, were performed using SPSS software, Release 19 (SPSS Inc., Chicago, IL, USA).
Results
Characteristics of the sample
A total of 311 patients from primary care settings in the city of Zaragoza were recruited. Of these 311 patients, 4 (1.27 %) patients refused to participate, 1 patient (0.31 %) was ruled out because of a severe medical condition that made it difficult to answer the questionnaires (dementia) and 3 (0.96 %) were not fluent in Spanish. The characteris-tics of the final sample (N = 303) were that the partici-pants were primarily female (66.77 %) with a mean age of 49.32 years (SD, 11.46; range, 19–67 years) and primarily European (94.71 %). There was no association between age and MSBS (Pearson:−0.183; p = 0.32).
Confirmatory factor analysis
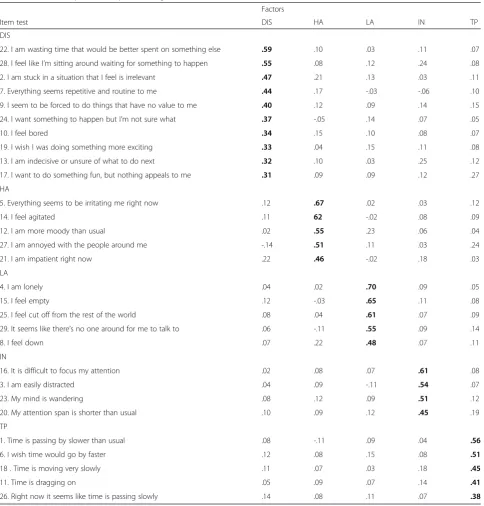
All of the items were examined in terms of mean, stand-ard deviation, skewness and kurtosis. On the basis of these values, all of the data showed normality. The CFA of the MSBS confirmed that the original five-factor model [1] showed good fit indices: CFI = .96; GFI = .94; SRMR = .05; RMSEA = .06 [.05–.08]. The factor loadings of the 29 items of the questionnaire are summarised in Table 1.
To replicate the findings of the original authors, a second-order model was assessed and showed good fit indices: CFI = .95; GFI: 0.93; SRMR = 0.5; RMSEA = 0.7 [0.6–0.8]. The loadings of the first-order factors on the second-order factors were as follows: .91 for DIS, .83 for HA, .85 for LA, .80 for IN and .64 for TP. It confirms that the MSBS measures five specific factors that com-bine to form a single general construct of boredom.
Internal consistency and test-retest reliability
item-totalrcorrelation coefficients were above 0.30: the scoring ranged between 0.39 and 0.69. These data indi-cate a high degree of internal consistency for MSBS (Table 2). With regard to temporal stability, a subsample of 123 (40.59 %) individuals was randomly selected and a new interview was arranged for 1–2 weeks later. In this subsample, 62.60 % were female, the mean age was
46.87 years (SD, 9.65), and 97.56 % were European. There were no significant differences in the sociodemo-graphic variables between this subsample and the entire sample. In this subsample, the MSBS showed a test-retest coefficient measured with an ICC of 0.90 (95 % CI, 0.88–0.92). The ICC for the five subscales ranged from 0.81 to 0.89 (Table 2).
Table 1Confirmatory factor analysis. Loading of ítems of the MSBS (N = 303)
Factors
Item test DIS HA LA IN TP
DIS
22. I am wasting time that would be better spent on something else .59 .10 .03 .11 .07
28. I feel like I’m sitting around waiting for something to happen .55 .08 .12 .24 .08
2. I am stuck in a situation that I feel is irrelevant .47 .21 .13 .03 .11
7. Everything seems repetitive and routine to me .44 .17 -.03 -.06 .10
9. I seem to be forced to do things that have no value to me .40 .12 .09 .14 .15
24. I want something to happen but I’m not sure what .37 -.05 .14 .07 .05
10. I feel bored .34 .15 .10 .08 .07
19. I wish I was doing something more exciting .33 .04 .15 .11 .08
13. I am indecisive or unsure of what to do next .32 .10 .03 .25 .12
17. I want to do something fun, but nothing appeals to me .31 .09 .09 .12 .27
HA
5. Everything seems to be irritating me right now .12 .67 .02 .03 .12
14. I feel agitated .11 62 -.02 .08 .09
12. I am more moody than usual .02 .55 .23 .06 .04
27. I am annoyed with the people around me -.14 .51 .11 .03 .24
21. I am impatient right now .22 .46 -.02 .18 .03
LA
4. I am lonely .04 .02 .70 .09 .05
15. I feel empty .12 -.03 .65 .11 .08
25. I feel cut off from the rest of the world .08 .04 .61 .07 .09
29. It seems like there’s no one around for me to talk to .06 -.11 .55 .09 .14
8. I feel down .07 .22 .48 .07 .11
IN
16. It is difficult to focus my attention .02 .08 .07 .61 .08
3. I am easily distracted .04 .09 -.11 .54 .07
23. My mind is wandering .08 .12 .09 .51 .12
20. My attention span is shorter than usual .10 .09 .12 .45 .19
TP
1. Time is passing by slower than usual .08 -.11 .09 .04 .56
6. I wish time would go by faster .12 .08 .15 .08 .51
18 . Time is moving very slowly .11 .07 .03 .18 .45
11. Time is dragging on .05 .09 .07 .14 .41
26. Right now it seems like time is passing slowly .14 .08 .11 .07 .38
Construct validity
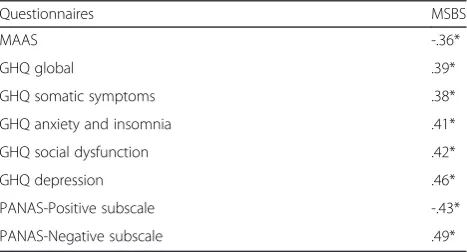
To test the construct validity, Pearson’s correlation coeffi-cients were calculated between the MSBS and other ques-tionnaires measuring related constructs. The studied constructs follow a normal distribution. As expected, the MSBS showed a significant negative correlation with MAAS and PANAS-Positive Affect and a significant posi-tive correlation with the GHQ (total score and subscales) and PANAS-Negative Affect (Table 3).
Discussion
The primary purpose of the present study was to valid-ate the Spanish version of the MSBS. To the best of our knowledge, despite the importance of the boredom con-struct, there is no available validation of any question-naire for assessing MSBS in Spanish.
In our study, the MSBS factorial structure observed using CFA was largely consistent with that reported by the original authors [1]: the five-factor model showed adequate fit and all of the items loaded strongly onto the expected latent factor. The maintenance of the factor structure cross-culturally could be expected because the process of development of the scale was exhaustive from a methodological viewpoint. Additionally, MSBS showed high internal consistency and high test-retest reliability. The high test-retest reliability found in this study may be surprising for a state measure. However, the developers of
the scale [1], acknowledged that MSBS to be a potentially foundational tool for the study of both state boredom and boredom proneness. Test-retest reliability was assessed at 1–2 weeks interval without any kind of psychological intervention in this period. It is likely that boredom-prone individuals need more time than 1–2 weeks for assessing changes in boredom levels in their outer world. Future studies should include retest at different intervals to an-swer this question.
Despite clinical experience and popular thought sug-gesting that state boredom is more frequent in the elderly, no association was found between state boredom and age. More specific research to assess this question could be necessary, by means of invariance factor analysis, using structural equation modelling, and comparing the struc-ture of the questionnaire and factor loadings between dif-ferent age ranges.
Finally, expected and significant correlations with other related psychological variables were observed: MSBS in-versely correlates with mindfulness (measured by MAAS) and positive affectivity (measured by PANAS) and posi-tively correlates with negative affectivity (PANAS-Negative affect) and psychological disturbance (GHQ-28-global and its four subscales: somatic symptoms, anxiety and insom-nia, social dysfunction and depression).
Recent studies have demonstrated [27] that there are dif-ferences between cultures, specifically between European Canadians and Chinese, in state boredom levels, with these being higher in European Canadians. This is coherent with previous studies that affirm that when compared to Asians, Europeans tend to value more high-arousal posi-tive affects (eg: excitement) and less low-arousal posiposi-tive affects [28].
The primary limitations of the study are the same as described by the authors who developed the original scale [1]. First, the scale is long (N = 29 items) and un-comfortable for research or clinical purposes; however, the multidimensionality of the construct boredom quires this complexity. A shorter scale should be a re-search target in the future. Second, all of the items in the scale are positively keyed to avoid creating a factor structure based on direction or wording [29]; this fact fa-cilitates social desirability answers. Third, as in any study using self-report measures, the results may have been influenced by the participants’ acquiescence and the need for social desirability.
However, compared with the original validation study, one of the strengths of the study is that the present study has been conducted in primary care settings in a multi-age sample. This sample is representative of the patients who consult healthcare services in a universal free public health system, such as in the Spanish one, and it is also representative of the general population. The conceptualisation of boredom and the development Table 2Internal consistency and test-retest reliability of the
subscales and total MSBS score
MSBS Internal consistency Test-retest reliability
(Cronbach’s alpha) (ICC)
Disengagement .83 .89
High arousal .80 .83
Low arousal .81 .87
Inattention .75 .81
Time perception .78 .85
Total MSBS score .89 .90
Table 3Correlation between MSBS and other psychological variables
Questionnaires MSBS
MAAS -.36*
GHQ global .39*
GHQ somatic symptoms .38*
GHQ anxiety and insomnia .41*
GHQ social dysfunction .42*
GHQ depression .46*
PANAS-Positive subscale -.43*
PANAS-Negative subscale .49*
of the MSBS were conducted with a young, fairly edu-cated adult sample (1). However, this Spanish validation has been studied in a multi-age sample; so, the MSBS seems to work in populations of any age.
Conclusions
The Spanish version of the MSBS has been validated to be a reliable instrument for measuring boredom in the general population. Although this psychological con-struct is considered to be relevant for its relationship with many psychiatric disorders, there have not been many studies that enhance our knowledge of this con-struct and its relationship with mental health. This study will facilitate the assessment of boredom for clinical and research purposes in Spanish-speaking populations.
Annex 1. Spanish validated version of the MSBS Instrucciones: Responda a cada pregunta indicando cómo se siente ahora sobre sí mismo y su vida, incluso si es diferente a como se siente normalmente.
Use las siguientes opciones: 1 Muy en desacuerdo; 2 En desacuerdo; 3 Algo en desacuerdo; 4 Ni de acuerdo ni en desacuerdo; 5 Algo de acuerdo; 6 De acuerdo; y 7 Muy de acuerdo.
1. El tiempo pasa más lento de lo habitual.
2. Estoy atascado en una situación que siento que es irrelevante.
3. Me distraigo con facilidad.
4. Me siento solo.
5. Todo parece estar irritándome ahora mismo.
6. Desearía que el tiempo pasara más deprisa.
7. Todo me parece repetitivo y rutinario.
8. Me siento bajo de ánimo.
9. Parece que esté forzado a hacer cosas que no tienen valor para mí.
10.Me aburro.
11.El tiempo se me hace eterno.
12.Tengo más cambios de humor de lo habitual.
13.Estoy indeciso o inseguro sobre qué hacer después.
14.Me siento agitado.
15.Me siento vacío.
16.Me resulta dif ícil focalizar la atención.
17.Quiero hacer algo divertido, pero nada me atrae.
18.El tiempo transcurre muy lentamente.
19.Desearía estar haciendo algo más emocionante.
20.Mi periodo de atención es más corto de lo habitual.
21.Estoy impaciente ahora mismo.
22.Estoy desperdiciando tiempo que estaría mejor aprovechado en otra cosa.
23.Mi mente está dispersa.
24.Quiero que ocurra algo, pero no estoy seguro de qué.
25.Me siento apartado del resto del mundo.
26.Ahora mismo, parece que el tiempo está pasando lentamente.
27.Estoy enfadado con la gente de mí alrededor.
28.28 Me siento como si estuviera de brazos cruzados esperando a que ocurra algo.
29.Parece como si no hubiera nadie alrededor con quién poder hablar.
Abbreviations
MSBS:Multidimensional State Boredom Scale; MAAS: Mindful attention awareness scale; GHQ: General Health Questionnaire; PANAS: Positive and Negative Affect Schedule; SD: Standard deviation; CFA: Confirmatory factor analysis; ICC: Intraclass correlation coefficient; CFI: Comparative fit index; GFI: Goodness of fit index; SRMR: Root mean square error of approximation; RMSEA: Standardised root mean-square residual.
Competing interests
The authors declare that they have no competing interests.
Authors’contributions
MA, JGC, JM and JMM. designed the project. MG, MPG, PHM and MNG collected the data. JMM performed the statistical analysis, and all of the authors interpreted the results, drafted the manuscript and read and approved the final manuscript.
Acknowledgements
The authors thank Aloha Aragon for its support in the development of this study. The project has been funded by the Instituto de Salud Carlos III (Institute of Health Carlos 288 III, ISCiii) of the Ministry of Economy and Competitiveness (Spain) through the Network for 289 Prevention and Health Promotion in Primary Care (redIAPP, RD12/0005), and co-financed 290 with European Union ERDF funds.
Author details 1
Instituto Aragonés de Ciencias de la Salud, Miguel Servet Hospital and University of Zaragoza, Primary Care Prevention and Health Promotion Research Network (RedIAPP), Zaragoza, Spain.2University of Zaragoza, Zaragoza, Spain.3Faculty of Health and Sport Sciences, Huesca, Spain. 4
Primary Care Prevention and Health Promotion Research Network (RedIAPP), Zaragoza, Spain.5Institut Universitari d’Investigació en Ciències de la Salut (IUNICS), University of Balearic Islands, Mallorca, Spain.
Received: 19 January 2015 Accepted: 30 April 2015
References
1. Fallman SA, Mercer-Lynn KB, Flora DB, Eastwood JD. Development and validation of the Multidimensional State Boredom Scale. Assessment. 2013;20:68–85. 2. The National Center on Addiction and Substance Abuse at Columbia University.
National survey of American attitudes on substance abuse VIII: Teens and parents. New York, NY: Columbia University; 2003.
3. Farmer R, Sundberg ND. Boredom proneness: the development and correlates of a new scale. J Personal Assess. 1986;50:4–17.
4. Sommers J, Vodanovich SJ. Boredom proneness: its relationship to psychological- and physical-health symptoms. J Clin Psychol. 2000;56:149–55. 5. Stickney MI, Miltenberger RG. Evaluating direct and indirect measures for
the functional assessment of binge eating. Int J Eat Dis. 1999;26:195–204. 6. Mercer KB, Eastwood JD. Is boredom associated with problema gambling
behaviour? It depends on what you mean by“boredom.”. Intern Gambling Studies. 2010;10:91–104.
7. Wiesbeck GA, Wodarz N, Mauerer C, Thome J, Jakob F, Boening J. Sensation seeking, alcoholism and dopamine activity. Eur Psychiatry. 1996;11:87–92. 8. Lee CM, Neighbors C, Woods BA. Marijuana motives: Young adults’reasons
for using marijuana. Addict Behav. 2007;32:1384–94.
10. Kass SJ, Vodanovich SJ, Callender A. State-trait boredom: relationship to absenteeism, tenure, and job satisfaction. J Business Psychol. 2001;16:317–27. 11. Britton A, Shipley MJ. Bored to death? Int J Epidemiol. 2010;39:370–1. 12. Eastwood JD, Frischen A, Fenske MJ, Smilek D. The ungaged mind: defining
boredom in terms of attention. Persp Psychol Sci. 2012;7:482–95. 13. López-del-Hoyo Y, Olivan B, Luciano JV, Mayoral F, Roca M, Gili M, et al. Low
intensity vs. self-guided internet-delivered psychotherapy for major depression: a multicenter, controlled, randomized study. BMC Psychiatry. 2013;13:21. 14. Kline RB. Methodology in the social sciences. In: Kenny DA, editor. Principles
and practices of structural equation modelling. New York: The Guilford Press; 1998.
15. Goldberg DP, Hillier VF. A scaled version of the General Health Questionnaire. Psychol Med. 1979;9:139–45.
16. Lobo A, Pérez-Echeverría MJ, Artal J. Validity of the scaled version of the General Health Questionnaire (GHQ-28) in a Spanish population. Psychol Med. 1986;16:135–40.
17. Watson D, Clark LA, Tellegen A. Development and validation of brief measures of positive and negative affect: The PANAS scales. J Pers Soc Psychol Rev. 1988;54:1063–70.
18. Sandín B, Chorot P, Lostao L, Joiner TE, Santed MA, Valiente RM. Escala PANAS de afecto positivo y negativo: validación factorial y convergencia transcultural. Psicothema. 1999;11: 37–51.
19. Brown K, Ryan RM. The benefits of being present: mindfulness and its role in psychological well-being. J Perso Soc Psychol. 2003;84:822–48. 20. Soler J, Tejedor R, Feliu A, Pascual J, Cebolla A, Soriano J, et al. Psychometric
proprieties of Spanish version of Mindful Attention Awareness Scale (MAAS). Actas Esp Psiquiatr. 2012;40:19–26.
21. LaPera N. Relationships between boredom proneness, mindfulness, anxiety, deoression and substance use. NSchool Psychol Bull. 2011;8:15–25. 22. Guillemin F, Bombardier C, Beaton D. Cross-cultural adaptation of health related
quality of life measures: literature review and proposed guidelines. J Clin Epidemiol. 1993;46:1417–32.
23. Curran PJ, West SG, Finch JF. The robustness of test statistics to nonnormality and specification error in confirmatory factor analysis. Psychol Methods. 1996;1:16–29.
24. Bentler PM. Theory and Implementation of EQS: a Structural Equations Program. Los Angeles: BMDP Statistical Software; 1985.
25. Hu L, Bentler PM. Cut-off criteria for fit indexes in covariance structure analysis: conventional criteria versus new alternatives. Struct Equation Model. 1999;6:1–55. 26. Cronbach LJ. Coefficient alpha and the internal structure of tests. Psychometrika.
1951;16:297–334.
27. Ng AH, Liu Y, Chen J, Eastwood JD. Cultural differences in state boredom: a comparison between European Canadians and Chinese. Personal Individ Diff. 2015;75:13–8.
28. Tsai JL, Knutson B, Fung HH. Cultural variation in affect valuation. J Personal Soc Psychol. 2006;90:288–307.
29. DeVellis RF. Scale development: Theory and applica- tions. London, England: Sage; 2003.
Submit your next manuscript to BioMed Central and take full advantage of:
• Convenient online submission • Thorough peer review
• No space constraints or color figure charges • Immediate publication on acceptance
• Inclusion in PubMed, CAS, Scopus and Google Scholar
• Research which is freely available for redistribution