Lincoln
University
Digital
Thesis
Copyright
Statement
The
digital
copy
of
this
thesis
is
protected
by
the
Copyright
Act
1994
(New
Zealand).
This
thesis
may
be
consulted
by
you,
provided
you
comply
with
the
provisions
of
the
Act
and
the
following
conditions
of
use:
you
will
use
the
copy
only
for
the
purposes
of
research
or
private
study
you
will
recognise
the
author's
right
to
be
identified
as
the
author
of
the
thesis
and
due
acknowledgement
will
be
made
to
the
author
where
appropriate
you
will
obtain
the
author's
permission
before
publishing
any
material
from
the
thesis.
Exploring a Desktop Virtual Reality Application for Education:
the Perspectives of Spatial Knowledge Acquisition and
Information Integration
A thesis
submitted in partial fulfilment
of the requirements for the Degree of
Doctor of Philosophy
at
Lincoln University
by
Elin Eliana Abdul Rahim
Department of Applied Computing
Faculty of Environment, Society and Design
Abstract of a thesis submitted in partial fulfilment of the
requirements for the Degree of Doctor of Philosophy.
Abstract
Exploring a Desktop Virtual Reality Application for Education:
the Perspectives of Spatial Knowledge Acquisition and Information
Integration
by
Elin Eliana Abdul Rahim
Current practice in education encourages students to gain exposure in the real world through
student visits (i.e., field trips) to sites such as process facilities (for engineering students), forests
(for forestry students) and islands (for landscape architecture students), in addition to traditional
textbooks and lectures. This exposure helps students to experience real world situations and
integrate this experience into knowledge learned in class. This is important to students in various
disciplines such as engineering, architecture and transportation.
Students, however, have limited on-site access due to issues related to safety concerns, cost and
effort. In an attempt to address such issues, Virtual Reality (VR) applications have been
developed and implemented. With the growth in the number of VR applications, there is
currently a lack of information about the design issues of VR applications, be it from the
perspective of acquiring spatial understanding of complex environments or from the perspective
of integrating different types of information related to the real world. This thesis aims to bridge
this gap by evaluating VR applications with respect to these issues and highlights the lessons
learned from the relevant evaluations.
The results demonstrate that VR application, which links different sources of information (as
developed in this thesis), promotes better learning than conventional printed materials and that
students perceived it positively as a valuable complement to a physical field trip. Further findings
indicate that a cut-away map (i.e., 2.5D map) is an ideal approach to assist with spatial
understanding of complex environments. The design recommendations for the development of
similar VR learning applications are further discussed in this thesis.
Keywords: Virtual Reality, educational software, spatial knowledge, navigation, integrated
Acknowledgements
Alhamdulillah, all praises to Allah for His guidance and blessings throughout my PhD journey.
Without Him, this thesis would not be a reality.
I would like to express my greatest appreciation to my family, especially my
parents, for their unconditional support, love and prayers, and for keeping
on telling me that I could finish this.
I would also like to express my sincere gratitude to:
Keith Unsworth and Alan McKinnon (Lincoln University); Andreas Duenser and Mark
Billinghurst (HIT Lab NZ), for their supervision, constructive advice and guidance in
completing this PhD.
Peter Gostomski and Alfred Herritsch, from the Department of Chemical and Process
Engineering (CAPE), University of Canterbury, for their assistance and advice
throughout the project, especially during the data collection period.
Robert Hellwagner, Klaus Falzberger and Elwin Lee, for providing assistance with this
project during their internships in HIT Lab NZ.
The staff of Teaching and Learning Department of Lincoln University, especially
Caitriona Cameron, for helping me with my academic writing.
Douglas Broughton, the postgraduate administrator, for helping me with
administrative matters.
Eric Scott, Jane Robertson, Janette Busch and Geraldine Murphy, the copy editors
who have provided valuable suggestions for editing the thesis. No changes of
intellectual content were made as a result of these suggestions.
Declarations
Parts of this thesis have been submitted and/or accepted for publication in
advance of submission of the thesis. The publications that I have authored
and co-authored are listed below, according to the year of publication:
Journal publication
Herritsch, A., Abdul Rahim, E., Fee, C.F., Morison, K.R. and Gostomski, P.A. (2013) An
Interactive Virtual Tour of a Milk Powder Plant. Chemical Engineering Education,
47(2), 107-114 - includes part of Chapter 7.
Conference proceedings
Abdul Rahim, E., Duenser, A., Unsworth, K., McKinnon, A., Billinghurst, M.,
Gostomski, P., & Herritsch, A. (2013). Visiting a Milk Factory without Gumboots:
Students’ Attitudes Towards a Virtual Field Trip. Paper presented at the 2013 IEEE
International Conference on Teaching, Assessment and Learning for Engineering
(TALE), 26-29 August 2013. Bali, Indonesia (accepted) – includes part of Chapter 6.
Abdul Rahim, E., Duenser, A., Billinghurst, M., Herritsch, A., Unsworth, K., McKinnon,
A., & Gostomski, P. (2012). A desktop virtual reality application for chemical and
process engineering education. Paper presented at the Proceedings of the 24th
Australian Computer-Human Interaction Conference (OzCHI 2012), 25-29 November
2012 (pp. 1-8). Melbourne, Australia - includes part of Chapter 5.
Herritsch, A., Abdul Rahim, E., Morison, K., Duenser, A., Young, B., Fee, C.,
Winchester, J., & Gostomski, P. (2012). Discoveries from Students’ Interactions with
an Immersive Learning Application. Paper presented at the Chemeca 2012: Quality of
life through chemical engineering, 23-26 September 2012 (pp. 969-979). Wellington,
New Zealand - includes part of Chapter 7.
Herritsch, A., Morison, K., Abdul Rahim, E., Duenser, A., Young, B., Fee, C.,
Winchester, J., Cameron, I., & Gostomski, P. (2011). Recent developments with an
immersive learning tool using a milk powder production application. Paper presented
at the Chemeca 2011, 18-21 Spetember 2011 (pp. 1137-1146). Sydney, Australia -
Abdul Rahim, E., Unsworth, K., McKinnon, A., Duenser, A., Billinghurst, M.,
Gostomski, P., Morison, & K. (2010). Navigation Issues in the Development of a
Virtual Chemical Processing Plant. Paper presented at the New Zealand Computer
Science Research Student Conference (NZCSRSC 2010), Wellington, New Zealand -
Table of Contents
Abstract ... 1
Acknowledgements ... 2
Declarations ... 3
List of Tables... 11
List of Figures ... 13
Chapter 1 Introduction ... 17
1.1 Research motivation ... 18
1.1.1 Spatial knowledge acquisition... 19
1.1.2 VR applications as learning and teaching resources ... 21
1.2 Research problem ... 22
1.2.1 Addressing the problems ... 23
1.3 Research contributions ... 24
1.4 Research background ... 24
1.5 Thesis structure ... 24
Chapter 2 Literature review ... 26
2.1 Virtual Reality ... 26
2.1.1 VR in education and training ... 27
2.2 Spatial knowledge ... 27
2.2.1 The importance of spatial knowledge ... 29
2.2.2 Landmark, route and survey knowledge ... 29
2.2.3 A map as a navigation aid in the VE ... 30
2.2.3.1 Orientation issues ... 32
2.2.3.2 Map designs... 34
2.2.4 Discussion... 39
2.2.5 Section summary ... 42
2.3 VR applications as learning or teaching resources ... 43
2.3.1 The use of VR applications ... 46
2.3.2 VR applications for education ... 48
2.3.2.1 Virtual Chemical Reaction Module (Vicher) ... 48
2.3.2.2 BP refinery application ... 49
2.3.2.3 Virtual Reality Interactive Learning Environment (ViRILE) ... 55
2.3.2.4 Virtual Forest ... 56
2.3.2.5 Grand Coulee panoramas... 57
2.3.2.6 Indian River Lagoon ... 58
2.3.2.7 Tempe Butte VR application ... 59
2.3.2.8 Virtual Trillium ... 60
2.3.2.9 Eastern Mediterranean Island ... 61
2.3.2.10Tidepools VR application ... 62
2.3.2.11Geological field trip ... 63
2.3.2.12Grampians National Park VR application ... 65
2.3.3 Discussion... 65
2.3.3.1 Design of educational VR applications ... 67
2.3.4 Section summary ... 75
2.4 Chapter summary ... 75
2.4.1 Spatial knowledge acquisition... 75
2.4.2 VR applications as learning or teaching resources... 76
Chapter 3 A usability study of the BP VR application ... 79
3.1 Objectives ... 79
3.2 Method ... 80
3.2.1 Participants ... 80
3.2.2 Procedure ... 80
3.3 Results ... 82
3.3.1 Participants’ backgrounds... 82
3.3.2 Participants’ agreement with statements in the questionnaire ... 82
3.3.2.1 The questionnaire related to participants’ experiences using the VR application. ... 83
3.3.2.2 Questionnaire related to the importance of the features in the BP Refinery application ... 86
3.3.3 Observation of the task completion ... 86
3.3.4 Lecturers’ comments and suggestions ... 87
Functionality... 88
3.4 Discussion ... 89
3.4.1 Navigation ... 90
3.4.2 User interface ... 90
3.5 Chapter summary ... 91
Chapter 4 User study 1: Spatial knowledge acquisition in a complex large scale virtual environment ... 92
4.1 Background ... 92
4.1.1 The 2D, 2.5D and 3D maps... 93
4.1.2 Hypothesis... 95
4.2 Description of the VR application ... 95
4.3 Assessment of spatial knowledge ... 98
4.3.1 The selected assessment methods ... 99
4.3.2 Spatial ability measurement ... 101
4.4 Pilot study ... 104
4.4.1 Participants ... 104
4.4.2 Procedure ... 104
4.4.2.1 Practice session ... 104
4.4.2.2 Navigation Task ... 105
4.4.2.3 Spatial knowledge acquisition tests... 106
4.4.2.4 Short interview ... 111
4.4.3 Summary of findings ... 111
4.4.4 Modifications to the VR application and the related tests ... 112
4.5 Main User study ... 113
4.5.1 Participants ... 113
4.5.2 Procedure ... 114
4.6.2 Object placement test ... 115
4.6.2.1 Correct vertical position ... 115
4.6.2.2 Correct horizontal position ... 117
4.6.2.3 Correct orientation ... 120
4.6.2.4 Total scores of the object placement ... 120
4.7 Results ... 120
4.7.1 Landmark recognition test and landmark sequencing test ... 120
4.7.2 The object placement test ... 121
4.7.2.1 Descriptive analysis ... 123
4.7.2.2 Orientation of the objects ... 124
4.7.3 Correlations between spatial ability and the object placement test ... 126
4.7.4 Gender differences ... 127
4.7.5 Observations ... 128
4.7.6 Results summary ... 129
4.8 Discussion ... 130
4.8.1 The 2D map: The top-down view ... 130
4.8.2 The 2.5D map: The cut-away representation of the objects on the map ... 132
4.8.3 The 3D map: The rotation function ... 132
4.8.4 Common properties of the results ... 133
4.8.5 Gender differences, spatial ability ... 137
4.9 Limitations of the study ... 138
4.10 Lessons learned ... 139
Chapter 5 A usability study of the milk processing VR application ... 141
5.1 The VR application ... 142
5.1.1 Specific user interface issues ... 146
5.2 The usability study ... 147
5.2.1 Participants ... 147
5.2.2 Procedure ... 147
5.2.2.1 Practice session ... 147
5.2.2.2 Performing the tasks ... 148
5.2.2.3 Completing the questionnaires ... 148
5.2.3 Interview session ... 149
5.3 Results ... 149
5.3.1 Task performance ... 149
5.3.2 Agreement with statements related to the VR application ... 152
5.3.3 Agreement with statements related to the USE Questionnaire ... 154
5.3.4 Observations and participants’ comments and suggestions ... 155
5.3.4.1 Aspects participants liked ... 155
5.3.4.2 Aspects participants did not like ... 158
5.3.4.3 Suggestions ... 158
5.3.5 Summary ... 158
5.4 Discussion and conclusion ... 159
5.4.1 Addressing issues in the BP VR application ... 159
5.4.2 Usability of the milk processing VR application ... 160
5.4.3 Lessons learned ... 161
5.4.4 Conclusions ... 162
6.1 The organisation of physical field trips in CAPE ... 164
6.1.1 Observations from the physical field trip ... 164
6.1.2 Summary ... 166
6.2 The user study ... 167
6.2.1 Participants ... 167
6.2.2 The virtual field trip ... 167
6.2.3 Questionnaire ... 169
6.2.4 Group interviews ... 170
6.2.5 Procedure ... 171
6.3 Results ... 171
6.3.1 Participants’ attitudes towards physical and virtual field trips ... 171
6.3.2 Questionnaires ... 176
6.3.3 Open-ended questions and group interviews ... 177
6.3.3.1 The contribution of the physical and virtual field trips ... 178
6.3.3.2 The enjoyment of the PFT and VFT... 182
6.3.3.3 Suggestions to improve the VFT experiences ... 183
6.3.3.4 Physical or virtual field trip preferences ... 184
6.3.4 Observations ... 185
6.3.5 Results summary ... 185
6.4 Discussion ... 186
6.4.1 Preferences for the PFT and VFT ... 187
6.4.2 Attitudes towards the VFT ... 192
6.5 Limitations of the study ... 193
6.6 Lessons learned ... 194
Chapter 7 User study 3: The learning assessment comparing the VR application to paper-based learning material ... 196
7.1 Description of the learning materials ... 197
7.1.1 VR application ... 197
7.1.2 Printed notes ... 197
7.1.3 Examples of the information presented in the learning materials ... 199
7.2 Assessments ... 204
7.2.1 Test questions ... 204
7.2.2 Questionnaires ... 205
7.3 User study... 207
7.3.1 Participants ... 207
7.3.2 Procedure ... 207
7.4 Results ... 208
7.4.1 Test marks of the VR and Paper groups ... 208
7.4.2 Participants’ learning styles and test marks ... 210
7.4.3 The time spent using the learning materials ... 211
7.4.4 Usability of the learning materials ... 212
7.4.5 Participants’ levels of agreement with the presentation of the learning materials ... 214
7.4.6 Results summary ... 216
7.5 Discussion ... 216
7.5.3 Satisfaction with the learning materials ... 219
7.5.4 Flexibility of the VR application... 220
7.5.5 Time spent with the learning materials... 220
7.5.6 Students’ need for the learning materials ... 221
7.6 Limitations of the study ... 221
7.7 Lessons learned ... 222
Chapter 8 Conclusion... 223
8.1 Restatement of the research problems and objectives ... 223
8.2 Summary and findings from each user study ... 224
8.3 Lessons learned ... 227
8.4 Limitations of the studies ... 228
8.5 Threats to validity ... 229
8.5.1 Internal validity ... 229
8.5.2 External validity ... 230
8.6 Research contributions ... 230
8.7 Implications of the research ... 231
8.8 Future studies ... 233
References ... 235
Appendix A A usability study of the BP VR application ... 249
A.1 The form for the lecturers ... 249
A.2 The form for the students ... 252
A.3 Instruction for the task (lecturers) ... 255
A.4 Questionnaires (lecturers) ... 256
A.5 Instruction for the task (students) ... 258
A.6 Questionnaires (students) ... 259
Appendix B Spatial knowledge acquisition in a complex large scale virtual environment 261 B.1 Consent form ... 261
B.2 General information form ... 262
B.3 Landmark recognition test ... 265
B.4 Landmark sequencing test ... 269
B.5 Participants’ scores ... 273
B.5.1 Landmark recognition test ... 273
B.5.2 Landmark sequencing test ... 273
B.5.3 Object placement test ... 274
Appendix C A usability study of the milk processing VR application ... 277
C.1 Related forms ... 277
C.2 General usability questionnaire ... 281
C.3 USE questionnaire... 282
Appendix D Students’ attitudes towards virtual field trips ... 283
D.1 Questionnaire related to the physical field trip (Questionnaire-PFT) ... 283
D.3 Group interviews ... 286
D.4 Consent form ... 287
Appendix E The learning assessment comparing the VR application to paper-based learning material ... 289
E.1 Questionnaire (VR group) ... 289
E.2 Questionnaire (Paper group) ... 290
E.3 USE Questionnaire (VR group) ... 291
E.4 USE Questionnaire (Paper group) ... 292
List of Tables
Table 1 The advantages and disadvantages of the different type of maps. ... 42
Table 2 A comparative summary of VR applications. ... 66
Table 3 The principles of multimedia learning (Mayer, 2005). ... 68
Table 4 A summary of the virtual field trips evaluations. ... 70
Table 5 The tasks lecturers were required to perform. ... 86
Table 6 Comments and suggestions from the participants relating to the VR application. .... 88
Table 7 The mean scores and the one-way ANOVA results for the landmark recognition and sequencing tests with different types of map. ... 121
Table 8 The mean scores (and standard deviations) of the participants for the object placement test with different types of map. ... 122
Table 9 The median scores and the results of the Kruskal-Wallis test scores of participants using different types of map. ... 122
Table 10 The number of objects placed in their correct respective position, including objects without a correct placement by participants using different types of map. ... 123
Table 11 The number of participants who managed to place the objects at the correct horizontal position regardless of the vertical position using different types of map. ... 124
Table 12 The number of objects placed in the correct orientation by participants using different types of map. ... 124
Table 13 Correlations between spatial abilities and the object placement test. ... 126
Table 14 The means (and standard deviations) of the scores for the respective tests, grouped according to the gender of the participants. ... 128
Table 15 User interface issues of the VR application and approaches taken to address them. ... 146
Table 16 The task list for the user study of the VR application. ... 150
Table 17 The frequency of responses to each feature of the VR application. ... 156
Table 18 The different contributions of the PFT and the VFT. ... 179
Table 19 The features of the VR application that assist in understanding the VFT. ... 180
Table 20 Examples of responses related to suggestions received from participants to ... 184
Table 21 The test questions classified into the respective Bloom’s taxonomy groups... 204
Table 22 The six levels of Bloom’s taxonomy of educational objectives. ... 205
Table 23 The mean test marks and the results of the independent t-test of participants using the two different learning materials in 2011 and 2012. ... 208
Table 24 The mean of Total, Knowledge and Comprehension marks and independent t-test results of the the marks of the participants in the VR and Paper learning materials groups. ... 209
Table 25 The learning style preferences of the participants in each learning materials group. ... 210
Table 26 Mean marks (and standard deviation) of the students using the VR and Paper learning material, grouped based on their learning preferences ... 211
Table 27 The results of Mann-Whitney U Test of the participants’ agreement with the statements... 213
Table 29 The median of the participants’ responses to the statements related to the ‘VR’ and Paper’ learning methods, from scale of 1= Completely Disagree to 6 =
List of Figures
Figure 2-1 Users can move to specific locations in the VE (left) by selecting the orange
nodes on the map (right) (University of California, 2012). ... 32 Figure 2-2 The ‘forward-up’ map (left) and the ‘north-up’ map (right) (Darken & Cevik,
1999). ... 33 Figure 2-3 The combination of a grid and map (Darken & Sibert, 1996). ... 34 Figure 2-4 The map with an indicator showing the user’s location and position at the
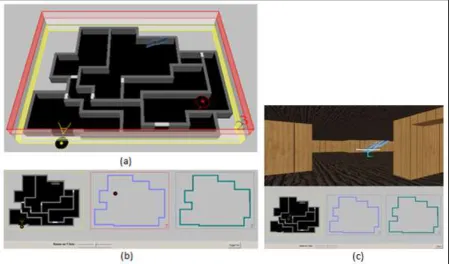
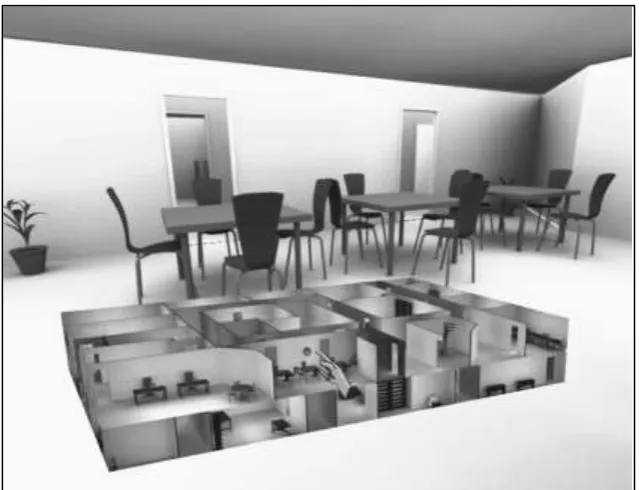
current floor (a). The map is showing level 2, where levels 3 and 4 are slid to the left (b). The blue coloured zone, as in (b), has no significant value (Chittaro et al., 2005) ... 36 Figure 2-5 The 3D map (a) and the 2D map (b) of a multilevel buiding. The 2D map and the
corresponding VE in a multilevel building (c) (Chittaro & Venkataraman, 2006). 37 Figure 2-6 The 3D floor map, 3D building map and the transparent condition of a
multilevel building (Luo, Luo, Wickens, et al., 2010). ... 38 Figure 2-7 The The cut-away map according to the user’s viewing direction in the VE
(Andujar et al., 2010). ... 39 Figure 2-8 The technology-assisted problem solving application (Sidhu & Singh, 2008). ... 43 Figure 2-9 The distillation simulation package (Rafael et al., 2007)... 44 Figure 2-10 A virtual patient used for training audiology students (Duenser, Heitz, &
Moran, 2010). ... 44 Figure 2-11 One section of the panorama potrayed in the BP VR application (Cameron et
al., 2008). ... 45 Figure 2-12 Left: interaction of vapour, right: simulation of an accident in the virtual
plant. Both are presented in graphical representations format instead of
photrealistic (Bell & Fogler, 2004). ... 48 Figure 2-13 The BP Oil Refinery VR application (adapted from (Norton et al., 2007)). ... 49 Figure 2-14 Results generated by the BP Oil Refinery VR application search engine
(adapted from (Cameron et al., 2008)). ... 50 Figure 2-15 A hotspot in the BP Oil Refinery VR application (where the specific equipment
is highlighted in red). When the hotspot is clicked, a list of available items is displayed in a pop-up menu (adapted from Cameron et al., (2008). ... 50 Figure 2-16 Examples of the process flow diagram (left) and animation of the distillation
phase behaviour (right) in the BP Oil Refinery VR application (Cameron et al., 2008). ... 51 Figure 2-17 Piping and instrumentation diagram to the VE reference (left). Animation
video of the processes in the plant (right) (Cameron et al., 2008). ... 51 Figure 2-18 Pump isolation procedures (left) (Cameron et al., 2008) and choosing personal
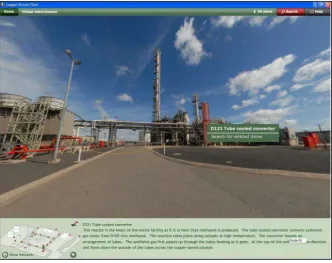
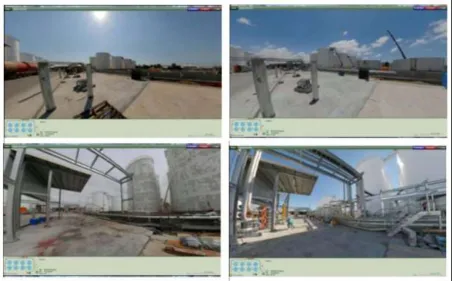
protective equipment (right) in the BP Oil Refinery VR application (Cameron et al., 2005). ... 52 Figure 2-19 The Coogee Energy Plant VR application (Maynard et al., 2011). ... 53 Figure 2-20 The VR appllication showing the sequence of construction at Pacific
Terminals Australia (PTA), starting from the top left image to the bottom right image (Maynard et al., 2011). ... 54 Figure 2-21 The ‘laboratory’ experiments (Schofield, 2010). ... 55 Figure 2-22 The‘real’ industries’ processes (Schofield, 2010)... 56 Figure 2-23 The main page of the application (left) and the sketch function (right) of a
Figure 2-24 A panorama showing the layers deposited at the bottom of the glaciers ... 58
Figure 2-25 Static panoramas (left) and the linked page that provides detailed information (right) in the Tempe Butte VR application (Stumpf et al., 2008). ... 60
Figure 2-26 The Virtual Trillium Trail and a fact card (Harrington, 2009b). ... 61
Figure 2-27 Eastern Mediterranean website (Poland et al., 2003). ... 62
Figure 2-28 Graphical images for a geological virtual field trip (Chang et al., 2009). ... 63
Figure 2-29 Panoramas for a geological virtual field trip (Chang et al., 2009). ... 64
Figure 2-30 The Grampians National Park VR application (Arrowsmith et al., 2005). ... 64
Figure 2-31 The framework of the cognitive theory of multimedia learning (Mayer, 2003). . 67
Figure 2-32 Summary of the research motivations and approaches. ... 77
Figure 3-1 Participants’ level of agreement with the statements related to the experience using the BP VR application. The length of the bars shows the proportion of participants selecting the corresponding level of agreement. The numerical values give the number of participants who selected that level. Mdn gives the median level of agreement. ... 84
Figure 3-2 Participants’ levels of agreement with the statements about the VR application. The length of the bars shows the proportion of participants selecting the corresponding level of agreement. The numerical values give the number of participants who selected that level. Mdn gives the median level of agreement. ... 85
Figure 4-1 The 2D map. ... 93
Figure 4-2 The 2.5D map. ... 93
Figure 4-3 The 3D map. ... 94
Figure 4-4 The position of the maps in the VR application of a milk dryer plant. ... 96
Figure 4-5 The interface of the map and the VR application for the milk dryer plant. ... 96
Figure 4-6 The expanded map of the milk dryer VR application. ... 97
Figure 4-7 The map is hidden when the ‘hide’ button is clicked... 97
Figure 4-8 A sample question of the Mental Rotation Test (Peters, Laeng, et al., 1995) ... 101
Figure 4-9 A sample question of the Card Rotations Test (Ekstrom et al., 1976). ... 102
Figure 4-10 A sample question of the Perspective Taking Test. The dotted line indicates the correct answer (Hegarty & Waller, 2004). ... 103
Figure 4-11 A sample of question of the Guilford-Zimmerman Spatial Orientation Survey. (Guilford, 1956) ... 103
Figure 4-12 Part of the sequence of the nodes on the map. ... 105
Figure 4-13 A sample question for the landmark recognition test. ... 106
Figure 4-14 A sample question for the landmark sequencing test. ... 107
Figure 4-15 The settings for the object placement test. ... 108
Figure 4-16 The marked sticks with the respective levels of the building, used as an indicator to show the respective levels of the building... 109
Figure 4-17 The marked sticks according to the respective levels. ... 109
Figure 4-18 Example of the objects placed on the base. ... 110
Figure 4-19 Two drawings by participants. ... 112
Figure 4-20 The settings for the object placement test ... 113
Figure 4-21 The positions of the objects placed by the participant (left) and the correct vertical positions (right). ... 116
Figure 4-22 The correct horizontal positions of the air blower, bag filter and cyclone. ... 117
Figure 4-24 The positions of the bag filter and air blower when they are placed at the
boundary. ... 118
Figure 4-25 The distance between the cyclone and the air blower and bag filter. ... 119
Figure 4-26 The orientations of the cyclone and the air blower. ... 119
Figure 4-27 The orientation of the cyclone placed by the participants using the 2.5D and 3D maps... 125
Figure 4-28 The orientation of the cyclones by participants using the 2D map. ... 125
Figure 4-29 A 2D map of the process plant (left) and a garden (right). A variety of top-down shapes are seen in the 2D map of the garden. ... 131
Figure 4-30 The small part of the air blower that indicates its orientation. ... 134
Figure 4-31 The orientation of the base with respect to the 2D, 2.5D and 3D maps. ... 136
Figure 5-1 The four panels of the VR application displayed on the screen. ... 143
Figure 5-2 The interactive piping and instrumentation diagram (P&ID) of the VR application. ... 143
Figure 5-3 The hotspots and the ‘Pano Viewer’ panel displayed in half screen. ... 145
Figure 5-4 The pop-up window displays additional information related to the respective unit’s operation. ... 145
Figure 5-5 The notes relating to the ‘arrows’ added to the user manual. ... 151
Figure 5-6 The node numbers in the Info Panel screen. ... 152
Figure 5-7 Participants’ agreements with statements about the VR application. The length of the bars shows the proportion of participants selecting the corresponding level of agreement. The numerical values give the number of participants who selected that level. Mdn gives the median level of agreement. ... 153
Figure 5-8 Participants’ level of agreement with the statements in the USE questionnaire. The length of the bars shows the proportion of participants selecting the corresponding level of agreement. The numerical values give the number of participants who selected that level. Mdn gives the median level of agreement. ... 154
Figure 6-1 The arrangments for the virtual field trip session. ... 168
Figure 6-2 Participants’ level of agreement with statements 1 to 12 in the questionnaire. The length of the bars shows the proportion of participants selecting the corresponding level of agreement. The numerical values give the number of participants who selected that level. Mdn gives the median level of agreement. ... 172
Figure 6-3 Participants’ level of agreement with statements 13 and 14 in the questionnaire. The length of the bars shows the proportion of participants selecting the corresponding level of agreement. The numerical values give the number of participants who selected that level. Mdn gives the median level of agreement. ... 173
Figure 6-4 Participants’ level of agreement with statements 15 to 19 in the questionnaire. The length of the bars shows the proportion of participants selecting the corresponding level of agreement. The numerical values give the number of participants who selected that level. Mdn gives the median level of agreement. ... 173
Figure 6-6 The median for each category based on the level of agreement stated by the participants. ... 175 Figure 6-7 A comparison of students’ attitudes towards the PFT and VFT in the two groups
(Group-PV and Group-V). ... 175 Figure 6-8 Participants’ level of agreement with the statements about the VR application.
The length of the bars shows the proportion of participants selecting the corresponding level of agreement. The numerical values give the number of participants who selected that level. Mdn gives the median level of
agreement. ... 177 Figure 7-1 The text information, PFD and the 3D model presented in the printed notes. ... 198 Figure 7-2 The text information, PFD and the 3D model presented in the VR application. .. 199 Figure 7-3 The detailed PFD, presented in the printed form (top) and the VR application
(bottom). ... 200 Figure 7-4 The front page of the appendix (top) and one of the P&ID (bottom). ... 201 Figure 7-5 The P&ID presented in the VR application. ... 202 Figure 7-6 Information related to the lobe pump presented in a pop-up window (left); a
video of the lobe pump (right). ... 203 Figure 7-7 Information related to the lobe pump presented in the printed notes. ... 203 Figure 7-8 The mean total marks of VR and Paper learning materials participants grouped
according to their GPA. ... 209 Figure 7-9 Participants’ level of agreement with the statements in the USE questionnaire.
The length of the bars shows the proportion of participants selecting the corresponding level of agreement. The numerical values give the number of participants who selected that level. Mdn gives the median level of
Chapter 1
Introduction
In addition to traditional textbooks and lectures, current practice in education encourages
students to gain exposure in the real world through student visits (i.e., field trips) to sites
such as process facilities for engineering students (e.g., McLoughlin, 2004), forests for
forestry students (e.g., Morrell, 2003) and islands for landscape architecture students (e.g.,
Egoz, 1999).
This exposure to, and familiarity with, real world scenarios can be related to material learned
in class. The exposure also enhances students’ understanding of processes in the real world
(Michie, 1998) and helps them to better remember processes that occurred during the field
trips (Falk & Dierking, 1997). Understanding a process may include the construction of a
house or processing milk from liquid to a powder. In addition, exposure helps students gain
spatial knowledge of the sites visited. Spatial knowledge allows students to develop a
representation of a visited site in their minds and, therefore, makes them aware of the
position and layout of the components in the site. Integrating classroom content with real
world scenarios and acquiring spatial knowledge are important to students in various
disciplines such as:
Engineering: Students gain insights into real-time processes occurring in the real
world. Spatial knowledge gained during the trip helps them with their design skills
that require them to know the position of, and connections between, each piece of
equipment.
Architecture: Looking at designs of different buildings helps students gain insight into
their scale. In addition, spatial knowledge enhances their design skills.
Transportation: Looking at the different elements in a city, such as different paths,
houses and buildings, helps students to plan and organise transport facilities (e.g.,
streets, highways, public transport).
Apart from students, spatial knowledge acquisition is also important for training in
Fire fighting: to assist strategy development to put out the fire and to identify the
escape routes.
Plant operations: the operators need both spatial knowledge and process
understanding to assist with trouble shooting particular equipment in a specific
location of a process plant.
Though exposure to the real world is important, students have limited opportunities for this.
Gaining on-site access can be difficult because of safety concerns (Abe et al., 2005; Klemm &
Tuthill, 2003), weather (Lesley & Michael, 2005), time constraints (Abe et al., 2005), and cost
and effort (Lesley & Michael, 2005; Lewis, 2008). Even if access is possible, often it is a
restricted, one-off trip that does not allow touring the site at the students’ own pace.
Therefore, students may not be able to gain sufficient insight, which may make it more
difficult for them to understand the concepts learned in class and to apply that learning to
real-world scenarios. In addition to this, students with impaired mobility (e.g., wheelchair
bound, hearing impaired) may find it difficult to participate in a site visit, although they may
have the opportunity to attend one.
In an attempt to address such issues, Virtual Reality (VR) applications have been developed
and implemented. VR applications create opportunities to ‘bring the environment to the
users’ through interactive 3D environments to enhance the learning experience (Ausburn &
Ausburn, 2004).
However, with the growth of VR applications, there is currently a lack of information about
the design issues of VR applications, be it from the perspective of integrating different types
of information related to the real world or from the perspective of acquiring spatial
knowledge in complex buildings, for example multilevel buildings with large equipment that
does not fit within a single level. This thesis aims to bridge this gap by evaluating VR
applications related to these issues and highlighting the lessons learned from the relevant
studies.
1.1
Research motivation
Over recent decades, research related to using VR applications a) as a medium to acquire
spatial knowledge and b) to relate classroom learning to a virtual environment (e.g., virtual
literature on spatial knowledge acquisition suggests that the applications developed for
spatial knowledge acquisition need to minimise the possibility of causing excess cognitive
overload on the users (Haik, Barker, Sapsford, & Trainis, 2002; Witmer, Sadowski, &
Finkelstein, 2002), which therefore means only the necessary components are included in
the applications. Conversely, applications developed for classroom learning with the
inclusion of virtual environments contain various types of information to assist students with
their learning.
Given the separate literature related to spatial knowledge and learning applications, the
motivation for the research related to these two is now discussed separately.
1.1.1 Spatial knowledge acquisition
The initial development of VR applications related to spatial knowledge acquisition focused
on the military and aviation industries. The applications were used for simulation training,
where the trainees were trained in a safe, simulated environment. The training that focused
on gaining spatial knowledge was important for military and aviation trainees because they
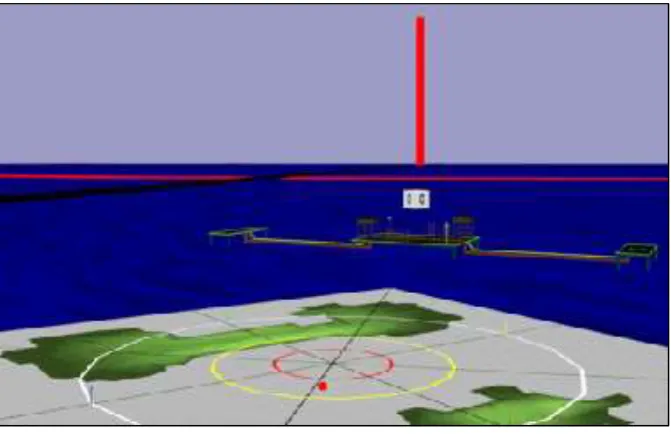
had to be aware of their surroundings as part of the job. Most studies focussed on a
single-level environment, such as a large sea (Darken, Allard, & Achille, 1998) or a top-down view
of a geographical area for aircraft landing (Hutchinson, 1994).
Currently, research on spatial knowledge acquisition no longer focuses on military and
aviation needs but has expanded to investigate how members of the public develop their
spatial knowledge using different types of aid. This is because spatial knowledge is important
to the public for reasons such as evacuation planning (Mol, Jorge, & Couto, 2008), locating
specific areas during an emergency (e.g., emergency room in a hospital) or understanding
the structure and layout of a building for design purposes. These studies focus more on the
interior of buildings commonly navigated by the public.
The studies initially focused on single level buildings (e.g., Darken & Cevik, 1999; Haik et al.,
2002; Stoakley, Conway, & Pausch, 1995). However, the lack of studies for multilevel
buildings motivated Chittaro and Venkataraman (2006) to conduct a similar study on a
multilevel building that was to be used for evacuation training. Since then, there has been an
increase in studies related to spatial knowledge acquisition in virtual multilevel buildings
(Bacim, Trombetta, Rieder, & Pinho, 2008; Luo, Duh, Chen, & Luo, 2009; Luo, Luo, Chen, Jiao,
Although several studies have been conducted on single and multilevel buildings, these
studies may not be relevant to all types of building. With other building features and
purposes, many of today’s buildings are not confined within single and multilevel forms but
go beyond that; for example, multilevel buildings with different floor layouts and different
area sizes. The current increase in the number of complex buildings raises the need to have
more research to aid occupants when evacuating a building in an emergency (Oosterom,
Zlatanova, Fendel, Pu, & Zlatanova, 2005). The need to focus on navigation in different types
of building is also supported by Phan and Choo (2010) who highlight the failure of fire
fighters to put out a fire in a traditional Korean building because of their lack of knowledge
of the structure of the building. In their research, they develop an Augmented Reality (AR)
application to train fire fighters to navigate such buildings. In education, students,
particularly engineering and architecture students, often visit buildings that are complex,
such as multilevel buildings with large equipment that occupies more than one level (e.g.,
automobile manufacturing companies, milk processing plants, oil refineries, aluminium
smelters) or modern multilevel condominiums with unique structure and layout. This further
supports the need to explore the acquisition of spatial knowledge of complex, multilevel
buildings.
A further motivation for this research relates not only to the type of building, but also to
navigation aids used to assist the acquisition of spatial knowledge. As navigation in a virtual
environment lacks sensory cues (Bowman, Davis, Hodges, & Badre, 1999), current literature
focuses on evaluating different types of navigation aids such as signs, maps (Chittaro, Gatla,
& Venkataraman, 2005) and cues (Steiner & Voruganti, 2004). Of all the aids, maps are
common, comprehensively studied aids (Cliburn & Heino, 2009). One reason is the flexibility
in developing computer-based maps that allows them to be interactive, such as being able to
rotate them (Chittaro, Ranon, & Leronutti, 2009) or even use them as a direct navigation tool
(moving from one location to another in the virtual environment). Regardless of the
different types of map, the use of maps as a direct navigation tool is still under-explored, as
many studies focus on using map as a medium to provide an overview in a virtual
environment. This further motivates the exploration of using a map as a navigation aid for
1.1.2 VR applications as learning and teaching resources
In recent decades, there has been a revolution in the development of VR applications in
education. Early developments focussed only on the inclusion of visual presentations with
little additional information. With the growth of technology, current applications can make
use of different information formats (e.g., 3D models, animations, videos and diagrams),
including information that is not available in the real world such as looking inside a working
machine (Bell & Fogler, 2004; Cameron et al., 2008; Norton et al., 2008). Combinations of
information in different formats provide students with greater insights into real-world
scenarios (Ausburn & Ausburn, 2004). In addition, there has been growth in open source
(e.g., PanoSalado1)and VR application development software (e.g., Tourweaver2, Voyager3),
making it easier to develop applications, with less time and effort required by developers.
The simplicity of developing VR applications, alongside the ability to include various types of
information, demonstrates the advantages of VR applications with respect to conventional
learning resources such as paper-based learning materials (e.g., textbooks, lecture notes),
where these materials have restrictions in terms of displaying interactive and integrated
information.
The current state of the literature demonstrates that most VR applications use different
locations (not within the same screen) to display information. This can be seen in the Virtual
Chemical Reaction Module (Vicher) (Bell & Fogler, 2004), Virtual Reality Interactive Learning
Environment (ViRILE) (Schofield, 2010), BP Refinery application (Cameron et al., 2008) and
Virtual Trillium Trails (VTT) (Harrington, 2011), which all use multiple locations to display
information.
An issue when using different locations (not within the same screen) to display information
(particularly in word and picture formats) is the lack of integration between information,
which may cause the students to have limited understanding compared with both words
(e.g., in printed text or narration form) and pictures (e.g., illustrations or animation) being
presented together (Mayer, 1997). This thesis investigates this issue by studying a VR
application that places emphasis on information integration. Subsequent to the
development of the application, it is evaluated in terms of its usability and learning
1
http://www.panosalado.com/
2 http://www.easypano.com/Virtual-tour-software.html 3
effectiveness, given that it is crucial for an educational application to be evaluated in terms
of usability and learning (Squires & Preece, 1996). A usable application allows it to be used
as expected with little or no hesitation (Rubin & Chisnell, 2008). With regard to learning, it is
expected that the application would improve students’ learning compared with conventional
resources, such as paper-based learning materials.
In addition, this thesis discusses the evaluation of a VR application when used as a medium
for a virtual field trip (VFT). Given that a significant reason for developing the VR application
is limited access to industrial sites, it is important to evaluate its use as a VFT. VFTs are not
new, having been studied by Lewis (2008), Spicer & Stratford (2001) and Stumpf, Douglass &
Dorn (2008). However, despite the number of related studies, VFTs were often conducted by
replicating scenarios that happened on physical field trips (PFTs), such as looking at the same
items and walking along the same paths. This meant that students were exposed to similar
scenarios in the PFT and VFT without utilising the capabilities of the technology to develop a
more enriched VR application (e.g., provide integration between learning content and the
virtual environment) to be used as a medium for a VFT. Under-utilising the capability of the
technology has been highlighted as a negative aspect of VFTs, given that the technology
allows one to do more (Spicer & Stratford, 2001). This thesis aims to add knowledge to the
area by further exploring students’ attitudes towards VFTs and PFTs when the learning
content and the virtual environment are integrated, where this scenario is not available in
the PFT.
To summarise, one aspect noted in the literature is the advantage of VR applications
compared with traditional learning resources (e.g., paper-based notes), where the
application can include different formats of information, as demonstrated in many existing
studies. However, one under-explored aspect in these studies is the integration of
information. This absence initiated the motivation to explore the aspect, with the aim of
evaluating it against conventional learning approaches (e.g., paper-based notes and physical
field trips).
1.2
Research problem
The research motivation above leads to the identification of the research problems as stated
i. The absence of studies related to the acquisition of spatial knowledge of multilevel
buildings with large equipment that does not fit within a single level. An extension of
this is that there are not many studies related to using a map as a direct navigation
tool (moving from one location to the other location) compared with just using it to
provide an overview of the virtual environment.
ii. Educational VR applications often have different types of information that are not
well integrated and linked. Since not much is known about integrating different types
of information, the issue is further investigated in this thesis.
1.2.1 Addressing the problems
User studies were conducted to address the research problems. Problem (i) is addressed
through the question:
How do different types of map affect the acquisition of spatial knowledge in a virtual
complex multilevel building?
The complex multilevel building term refers to multilevel buildings that feature, for example,
large equipment that does not fit within a single level - i.e., it occupies more than one level.
This question aims to investigate the differences that occur in the spatial knowledge
acquired by the users of different types of map. The user study is discussed in Chapter 4
(User Study 1: Spatial knowledge acquisition in a complex large scale virtual environment).
For problem (ii), a VR application focusing on integration between different information
formats was evaluated in user studies related to VFTs and students’ learning achievements.
Before that, a usability study of the application was. All these aim to bring together lessons
learned from the evaluations that could provide insights for the future development of
similar applications. These user studies are:
Usability study - Chapter 5 (A usability study of the milk processing VR application).
Comparison of students’ attitudes towards physical and virtual field trips - Chapter 6
(User study 2: Students’ attitudes towards virtual field trips).
Comparison of students’ learning achievements from the VR application and
paper-based materials - Chapter 7 (User study 3: The learning assessment comparing the VR
1.3
Research contributions
The contributions of the thesis are as follows:
i. The thesis demonstrates the effects of different types of map in assisting in the
acquisition of spatial knowledge when using a VR application in a complex multilevel
building.
ii. The thesis provides valuable insights that are useful for developing educational VR
applications that integrate different types of information.
iii. The thesis highlights lessons learned for designing and organising a virtual field trip.
1.4
Research background
In an attempt to address the issue of limited on-site access to industrial plants, the
“Immersive Learning through Virtual Reality” project was initiated as a collaboration
between the HIT Lab New Zealand and the Chemical and Process Engineering Department
(CAPE) at the University of Canterbury. The broad objective of this project was to develop a
Virtual Reality (VR) application to provide students with a resource that offers exposure to a
process facility and integrates the related learning content.
The development of this VR application was based on a multilevel milk processing plant with
integration of the learning content (e.g., Process Flow Diagram (PFD), videos, 3D models).
This provides a suitable platform to address the issues raised in this thesis. The project is
used as a case study to research the gaps raised.
1.5
Thesis structure
This thesis is presented as follows: Chapter 2 reviews the literature related to VR
applications for spatial knowledge acquisition and education and training. Definitions of the
terms used in this thesis are also included in this chapter. Chapter 3 describes a user study
conducted using a VR application simulating an oil refinery. This application was chosen
because it has similar content and purpose to the milk processing plant application
developed in this thesis. Therefore, this provides useful insights for the design of the milk
processing plant application. Chapter 4 describes the user study carried out to investigate
the differences in spatial knowledge acquired (in a large-scale multilevel virtual environment
of a milk processing plant) by users when using different maps. Chapter 5 describes a
application are addressed. Chapter 6 attempts to determine the value of virtual field trips
compared with traditional physical field trips from the students’ perspective. Chapter 7
compares the learning effects of using the VR application as a learning resource for class
assessments compared with conventional printed notes and Chapter 8 concludes with a
Chapter 2
Literature review
The previous chapter provides an overview of the state of the literature related to the use of
Virtual Reality (VR) applications as a medium for acquiring spatial knowledge and as a
medium for integrating classroom learning with the virtual environment. This chapter
extends the previous chapter by reviewing the literature relevant to both areas. It begins by
defining VR and discussing its general use in education and training (Section 2.1). Next, the
review focuses on two aspects: first, on spatial knowledge (Section 2.2) and then on the
design of existing VR applications in education (Section 2.3). The chapter ends with a
summary of the literature (Section 2.4).
2.1
Virtual Reality
Virtual Reality (VR) is defined as “the combination of systems comprising computer
processing (PC-based or higher), a building platform for creating three-dimensional
environments, and peripherals such as visual display and interaction devices that are used to
create and maintain virtual environments”; where a virtual environment (VE) is a
three-dimensional environment that allows users to interact with the objects within the
environment in real time (Cobb & Fraser, 2005, p. 525). Therefore VR provides an
interactive, three-dimensional environment where users can manipulate and explore the
environment (Sherman & Craig, 2003).
The degree of VR varies from non-immersive to immersive, based on the level of the
immersion provided (Vince, 2004). Immersive VR usually includes apparatus such as a Head
Mounted Display (HMD), data gloves or Cave Automatic Virtual Environment (CAVE) that
increases the user’s sense of immersion in the VE. Non-immersive VR, on the other hand,
runs on a standard desktop computer. Although this results in a decreased sense of
immersion, no significant differences are evident in the learning outcomes between the
immersive and non-immersive VR (Moreno & Mayer, 2002). The ability to use non-immersive
VR on a standard desktop computer, without any additional apparatus, makes it a cheaper
and more flexible option than immersive VR, and therefore makes it an adequate tool for
2.1.1 VR in education and training
VR applications were initially developed and implemented in the military and the aviation
industries for simulation training. However, as the technology became more robust and
accessible, applications have been developed for other purposes such as education and
training.
In education, VR applications have been used to showcase physical sites (e.g., manufacturing
plants (Cameron, Crosthwaite, Donaldson, Samsudi, & Fry, 2005), geological sites (Stumpf et
al., 2008), forestry (Abe et al., 2005)), which are becoming difficult to access for reasons such
as safety, cost and confidentiality. These applications help students to be exposed to the
materials learned in the class, which is useful to enhance their understanding. The exposure
also helps students to gain spatial knowledge of the visited site, providing them with an
awareness of the position and layout of the components in the site, which is useful
particularly for engineering and architecture students.
2.2
Spatial knowledge
Spatial knowledge can be acquired through navigation. Navigation is defined as moving from
one point to another (Hunt & Waller, 1999) and is a combination of way finding (cognitive
element) and travel (motoric element) (Sherman & Craig, 2003). Sebok, Nystad & Helgar
(2004) added that navigation also includes orientation, which is the ability to know one’s
current location and view point. Way finding does not involve any movement but only
strategies that lead to movement. Travel describes the act of moving through the
environment (Bowman et al., 1999; Sherman & Craig, 2003). In a VE, there are different ways
to travel, such as relative motion, which requires users to move in a continuous form from
one location to the other (similar to walking technique in the physical world); or absolute
motion, which involves pointing to a location on a map to move to that location (Stuart,
2001).
Navigation is a common daily routine for individuals in the physical world. This may include
going to school, commuting to the office or brisk walking in the evening. These navigation
activities result in the individuals identifying different elements of the environment such as
the buildings, roads and areas within the city and more. Although different cities have
different structures, the individuals seem to identify similar elements that form the
recognised by Lynch (1960), who compared the descriptions provided by the residents from
three cities (Boston, Jersey City and Los Angeles) in their identification of the elements in the
respective city. Lynch shows that the individuals identified common elements from each city:
Paths : Routes where people travel (e.g., streets, footpaths and trails).
Edges : Elements that are not considered paths (e.g., edges of walls and the
shoreline).
Districts : Sections of the city.
Nodes : Points in the city where a person could enter (e.g., junctions, crossing
of a path).
Landmarks : Objects that serve as external reference points for navigation.
To put the elements into context, imagine a small neighbourhood as an example. This small
neighbourhood (district) is part of a big city. There are a few houses and a school
(landmarks) and these houses and the school are connected by roads (path). Along the
roads, there are junctions (nodes) that allow individuals to choose the direction of travel. In
addition, there are walking paths alongside the road (edges) that also provide spaces
between the houses and the roads.
The perception of the above elements however, may differ from the perspective of
individuals who travel in the city. For example, a person who travels by road would see the
road as the routes and the walking paths as the edges, but a person who walks (instead of
travelling by car) would see the opposite, i.e., walking paths are the routes and the roads are
the edges.
The above provides an example of how individuals see things when navigating. Individuals
may see similar elements of the city, but the perception of each element varies. A similar
situation can be applied in different places and scenarios, e.g., navigation in closed buildings
such as shopping malls, manufacturing plants and schools. Individuals navigating a shopping
mall would identify escalators, shops, food courts and car parks but the perception of these
elements may differ among them as some may refer to the escalators as a landmark and
2.2.1 The importance of spatial knowledge
Spatial knowledge is useful for various reasons: for example, workers in a manufacturing
building need to have an understanding of the building’s layout to assist them when looking
for a piece of equipment to be fixed; the occupants of a building need it to evacuate during
an emergency; the public needs it for daily activities such as shopping, looking for a specific
room in a hospital or hotel. When a person knows the location of the respective places s(he)
can avoid being stressed and confused when locating a specific location in a particular area
(Dogu & Erkip, 2000). This could happen to hospital visitors and outpatients when they are
unable to find their way to a specific location, particularly during emergencies (Ulrich et al.,
2008). A similar situation may also occur in operating plants where the workers cannot
locate specific equipment when it needs to be repaired or fixed. For students, spatial
knowledge is useful especially in helping them with design skills, e.g., engineering and
architecture students.
2.2.2 Landmark, route and survey knowledge
When individuals navigate, they first gain landmark knowledge, which is the identification of
the available landmarks in the environment. A landmark is an object in the environment that
serves as a reference point (Lynch, 1960) and may be a ‘start’ or ‘end’ point when people
move in the environment (Siegel & White, 1975).
Once landmarks are identified, people start to develop route knowledge (also known as
procedural knowledge) which describes the path(s) between the landmarks (Siegel & White,
1975). Route knowledge is an egocentric perspective (first person view) and is usually gained
by personal exploration of the environment. At this stage, the person would travel using only
known routes (Satalich, 1995).
As route knowledge expands, people finally develop survey knowledge, which is also known
as configuration knowledge (Darken & Peterson, 2001; Sebrechts et al., 2000). Survey
knowledge is an exocentric perspective (bird’s eye view) and having this knowledge allows
people to build a ‘picture’ of the environment in their mind, which is also known as a mental
map, cognitive map or spatial representation. The mental map may not only include the
landmarks but also other elements that may be used as a reference point as well.
The above demonstrates how the landmark, route and survey knowledge is acquired through
neighbourhood. This is known as ‘primary’ survey knowledge. ‘Primary’ survey knowledge is
developed in a sequential manner, comprising landmark, route and survey knowledge
(Darken, 1996; Siegel & White, 1975).
Another way of acquiring survey knowledge is through other resources such as maps or
photographs, where a person does not need to be directly exposed to the environment. This
is known as ‘secondary’ survey knowledge (Thorndyke & Hayes-Roth, 1982). In ‘secondary’
survey knowledge, a person can gain immediate survey knowledge without the need to first
acquire landmark and route knowledge. For example, a map of a neighbourhood displays the
representation of the playground, houses, streets, etc., which are available in the
neighbourhood. By looking at the map, a person would gain an immediate bird’s eye view of
the neighbourhood (survey knowledge), and at the same time able to identify the houses
and playgrounds (landmark knowledge) and the available streets that connect the houses
and playgrounds (route knowledge). ‘Secondary’ survey knowledge, however, is inferior to
‘primary’ in terms of orientation issues (Darken & Peterson, 2001) because it tends to be
orientation-specific compared with knowledge gained from direct experience in the world
(Thorndyke & Hayes-Roth, 1982).
2.2.3 A map as a navigation aid in the VE
Navigation in a VE is different from the physical one because of a lack of cues for distance,
motion and direction (Bowman et al., 1999), making it more difficult to navigate compared
with the physical environment (Vinson, 1999). Therefore, navigation in a VE is often assisted
with aids such as maps, arrows, signs and other cues. Navigation with aids is more efficient
than navigation without aids (Luo et al., 2009; Wu, Zhang, Hu, & Zhang, 2007; Zuo, Xu, Yuan,
& Feng, 2009).
Although there is a wide range of navigation aids that could be used to assist navigation in a
VE, providing users with many navigation aids at once could result in cognitive overload as
users need to look at multiple aids while navigating the VE (Haik et al., 2002; Witmer et al.,
2002).
Among these navigation aids, maps are most commonly used and have been the subject of a
number of studies (Sherman & Craig, 2003), particularly for a large-scale VE environment
(Cliburn & Heino, 2009; Ruddle, Payne, & Jones, 1999). Cliburn and Heino (2009) undertook