A Study On Pre And Post Demonetisation Impacts
On Selected Sectors (With Reference To Indian
Stock Market)
P. Kamalakannan, S.Sathyakala
ABSTRACT: The demonetisation of banknotes was a policy passed by the Government of India on 8 November 2016 that had a big impact on Indian stock markets. A lot of investors were withdrawing capital from stocks. Some because they were out of funds while others expect a crash, perhaps an opportunity to buy at lower levels. A reliable criterion to gauge the immediate economic impact of a sudden policy shock is to observe stock market trends and for this Analytical study is used to conduct the study. The present study focuses on the analysis of pre and post demonetisation impact on share price movements of major sectoral indices at NSE (National Stock Exchange) and BSE (Bombay Stock Exchange) that includes automobile, consumption, realty, banking and other sectors with the help of various technical and statistical tools. Also the demonetisation impact on flows of Foreign Institutional Investors (FII) & Domestic Institutional Investors (DII) trading activities on Indian Stock Market is also studied. The results of the study reveal that automobile and the real estate (housing) sales were most affected by demonetisation in the short term but gains momentum in the long run. The sectoral indices showed a short term negative impact which will revive to positive growth in long run. Metal, Infrastructure, Oil & gas, banking sectors were benefited from demonetisation and hence investors can make their investments in these sectors and can construct a better portfolio.
Key words: Demonetisation, Nifty, Sensex, Realty (Real Estate), Automobile (Auto), Bullish, Bearish, Foreign Institutional Investors (FII) & Domestic Institutional Investors (DII).
INTRODUCTION
A Bold announcement about Demonetisation announced on Nov 8, 2016, as a measure to curb fake currency for funding terrorism and to eliminate black money inside the country. The Demonetisation move announced by government claimed as a measure to stop faking of the current banknotes apparently used for funding terrorism, as well as a crackdown on black money in the country. This event has led to heightened market volatility. The Purchasing power of goods and services decreased due to the demonetisation, eventually had an adverse impact on the prices of goods like cars, gold, real estate and selected luxury items. The cascading impact is on the prices of core industries like steel, cement etc., Further due to the government’s decision of demonetisation, the market has witnessed a net sell off by FIIs (Foreign Institutional Investors), DIIs (Domestic Institutional Investors) and HNIs (High Networth Individuals). The impact of Demonetisation in the country and presidential elections at US, the indices such as S&P BSE Sensex and Nifty 50 declined to six-month low in the following week after the announcement. REVIEW OF LITERATURE
Stephan H Penman (1989) in his study explained that Technical analysis includes a variety of forecasting techniques such as chart analysis, pattern recognition analysis, seasonality and cycle analysis, and computerized technical trading systems. Several popular technical trading systems are moving averages, channels and momentum oscillators like RSI (Relative Strength Index).
GL Kaminsky and SL Schmukler(1999) - In their study they have found that, in the chaotic financial environment of Asia in 1997–1998, daily changes in stock prices of about 10 percent became commonplace. This paper also analyses what type of news moved the markets in those days of market jitters. They found that movements were triggered by local and neighboring-country news, with news about agreements with international organizations and credit rating agencies having the most weight. However, certain major changes cannot be explained by any obvious significant news, but seem to be enforced by mob instincts of the market itself. The proof suggests that investors react emotionally to corrupt news.
R. Chakrabarti (2001), concluded in his study that in the pre-Asian crisis period any change in FII was found to have a positive impact on the equity returns, whereas in the post- Asian crisis the reverse relationship was noticed. FII’s were a major portion of investments and their roles in determining the movement of share price and indices is considerably high. The movement of indices in India depends only on the trade done in limited number of stocks. Thus, volatility of the market is influenced by frequent buying and selling of stocks by FII’s.
II). The study concludes that Indian Stock markets do not exhibit weak form of market efficiency and thus do not follow random walk in both period I & II. The study implies that the recent financial crisis did not impact the behavior of Indian Stock markets to a great extent
P. Mukherjee and M. Roy (2011), identified various determinants of FII like (1) Investment in Indian markets by foreign investors are based on the equity market returns; (2) FII Flows is influenced by the returns in the Domestic equity market; (3) whereas FII sale and FII net inflow are significantly affected by the performance of the Domestic equity market, but Purchases made during this period by FII’s shows no such impact to this market performance; (4) Investment in Indian Equity market is not used for diversification purpose by the FII investors; (5) FII decisions are impacted by the fundamentals of the economy and exchange rate returns, but such influence do not prove to be strong enough.
IMPORTANCE OF THE STUDY
As Indians fight to cope up with the second demonetisation since 1947 (previously in 1978, Rs.1000, Rs.5000 and Rs.10000 notes were restricted), the scale and scope of this action is significantly bigger. Impact of demonetisation can be gauged by observing the trends and volatility in the stock market during the policy period. Stock market indices have a deep reflection on changes in the economy activity. Therefore, the present study is an attempt to analyze the movement of stocks of selected sectors with the help of financial, technical and statistical tools through which investors can make wise investments and also to create a better portfolio.
SCOPE OF THE STUDY
Amidst adverse effects of demonetisation in short term, the scales tip in favor of the masses over a long term. The study focuses on the analysis of share price movements of major sectoral indices at BSE & NSE and these include automobile, realty, consumption, banking, metal, and infrastructure sectors. Out of which, the most affected sectors such as Automobile (Auto) and Real Estate (Realty) sectors are analyzed and discussed deeply to study the pre and post demonetisation impacts.
OBJECTIVES
To analyze the performance of sectoral indices of NSE and BSE on pre and post demonetisation move.
To analyze the pre and post demonetisation impacts on capital market segment to the flow of FII’s (Foreign Institutional Investors) vs DII’s (Domestic Institutional Investors) trading activity in Indian Stock market.
To ascertain the pre and post demonetisation influence on selected sectors (Nifty Realty & Nifty Auto indices) with effect to Indian Stock market.
LIMITATIONS
Since demonetisation policy is been the recent enactment by the Government of India, it takes time to stabilize itself in the economy.
The study is limited to selected sectors under NSE (National Stock Exchange) and BSE (Bombay Stock Exchange).
RESEARCH METHODOLOGY
Analytical Design is used to conduct the study. The data collection is purely based on secondary data, collected from Industry and stock websites, financial reports, press releases from the Financial Analysts, books, magazines, journals and papers on stock price movements. Statistical tools such as Standard deviation, Covariance, Correlation and Regression analysis are used in the study. Adding to it, financial tools of Technical analysis such as Line charts, Bar charts and RSI (Relative Strength Index) charts are used in the study. The study was conducted during the period of October 2014 to July 2018 where, Pre Demonetisation period is calculated from October 2014 to November 8, 2016 and Post Demonetisation period is calculated from November 9, 2016 to July 2018.
RATIONALE FOR SELECTING THE SECTOR OR INDEX FOR ANALYSIS
Nifty 50 is the major stock index in India introduced by the National Stock Exchange (NSE). It is broader than the Sensex in terms of volume transactions and bench marking, so Nifty 50 index is chosen for the study.
The Nifty 50 index is composed of firms from a varied set of industries. Under Nifty 50 Sectoral indices, Nifty Realty and Nifty Auto indices are taken for analysis in the study as these were most affected sectors in Indian Stock market.
ANALYSIS & DISCUSSION
PRE AND POST DEMONETISATION IMPACTS ON INDIAN STOCK MARKET
Exhibit 1: S&P BSE Sensex and Nifty 50 trend chart on Pre Demonetisation move (October 2014 to November 8, 2016) and on Post Demonetisation move (November 9, 2016 to July 2018)
Source: Secondary data
From the above graph, it is clear that, in pre-demonetisation period, BSE SENSEX had a sharp fall to 23000 on February 2016 and then experienced a bullish trend to 27500 on November 8, 2016 that had gained a positive momentum in the Indian Stock market.
In post-demonetisation period, on Nov 9, 2016, BSE SENSEX smashed almost 1,689 points and NIFTY 50 rushed over 541 points. By the end of the intraday trading section on 15 November 2016, the BSE SENSEX index was lower by 565 points and the NIFTY 50 index was below 8100 intraday. On November 16, a week after, the daily closing price of NSE S&P CNX Nifty 50 index came down by 5.1% as compared to November 8, which is shown in the above graph. This plunge made it the lowest weekly closing value since February 2016. As of now, both SENSEX and NIFTY 50 indices are experiencing bullish trend and reached 37500 and 11320 points respectively
SECTORAL IMPACT ON DEMONETISATION
Exhibit 2: Sectoral performance for the year 2016
Source: Secondary data 0
5000 10000 15000 20000 25000 30000 35000
1-O
ct-14
1-De
c-14
1-F
e
b
-15
1-A
p
r-15
1-Ju
n
-15
1-A
u
g-15
1-O
ct-15
1-De
c-15
1-F
e
b
-16
1-A
p
r-16
1-Ju
n
-16
1-A
u
g-16
1-O
ct-16
TREND CHART OF BSE SENSEX &
NIFTY 50 INDICES
(Pre Demonetisation)
Sensex close price Nifty close price
0 5000 10000 15000 20000 25000 30000 35000 40000
9-N
o
v-16
9-Jan-17 9-Mar-17 9-May-17 9-Ju
l-17
9-S
e
p
-17
9-N
o
v-17
9-Jan-18 9-Mar-18 9-May-18 9-Ju
l-18
TREND CHART OF BSE SENSEX
& NIFTY 50 INDICES
(Post Demonetisation)
Sensex close price Nifty close price
-20.00% -10.00% 0.00% 10.00% 20.00% 30.00% 40.00% 50.00%
0 5000 10000 15000 20000 25000 30000
R
ETU
R
N
S
%
CLOS
E
PRICE
SECTOR
Sectoral performance for the year 2016
From the above chart, it is clear that, to the sectoral performance for the year 2016, the Nifty Metal Index was up by 40% for the year and it is said to be the cash king, followed by the Oil & gas, which gained 23%, while Banking and Auto Indices trailed with 7% and 5% rise respectively. The IT Index was the most affected sector for the year 2016, which is down over by 10%, followed by Pharma index, which plunged a little over 8%, while Realty index and Consumer Durables indices slipped 8% each respectively.
1.1 SECTORAL INDICES PERFORMANCE: NSE (NATIONAL STOCK EXCHANGE)
The means of the closing value of the sectoral indices at NSE is compared for a period of 25 trading days before demonetisation (October 3 to November 8, 2016) with a period of 11 trading days after demonetisation (November 9 to November 24, 2016) to understand the volatility due to policy change. The following graph shows the impact.
Exhibit 3: Mean Sectoral Returns of NSE (National Stock Exchange) on pre and post Demonetisation move
Source: Secondary data
From the above graph, it is clear that, in pre-demonetisation period, the Realty, Consumption and the PSE (Private Sector Enterprise) indices experienced very low returns by -0.2% and -0.1% each respectively, while Metal and FMCG sector indices experienced a relative high returns by 0.2% and 0.03% respectively.
In post-demonetisation period, the automobile sector (Nifty Auto) has recorded the highest plunge of -1.2% followed by Nifty Realty of -1.01% in the mean returns, and Nifty PSE (Private Sector Enterprise) Index experienced the highest surge of 0.14%.
1.2 SECTORAL INDICES PERFORMANCE: BSE (BOMBAY STOCK EXCHANGE)
The performance of the sectoral indices under BSE are calculated on the mean returns of market capitalization from November 8, 2016 to December 23, 2016 for the post demonetisation period.
Exhibit 4: Post Demonetisation Sectoral returns percentage - BSE
-0.08 0.03 -0.1 -0.2 0.01 -0.01
0.2 -0.1
-1.2
-0.82 -0.93 -1.01
-0.73
-0.5
-0.14
0.14
-1.4 -1.2 -1 -0.8 -0.6 -0.4 -0.2 0 0.2 0.4
Nifty Auto Nifty FMCG Nifty India Consumption Nifty Realty Nifty Private Bank Nifty Bank Nifty Metal Nifty PSE Index
MEAN SECTORAL RETURNS ON PRE AND POST DEMONETISATION
Source: Secondary data
From the above graph, it is clear that, most affected sectors by post demonetisation are Realty, Consumer Durables, Auto, Capital goods, FMCG (Fast Moving Consumer Goods), Manufacturing etc. Whereas, the most benefited sectors in post demonetisation are Infrastructure, IT, Healthcare, Oil & Gas etc.
2) TRADING ACTIVITIES ON CAPITAL MARKET SEGMENT
The following is a combined FII/FPI(Foreign Institutional Investors/Foreign Portfolio Investors)
trading data across NSE(National Stock Exchange), BSE (Bombay Stock Exchange) and MSEI (Metropolitan Stock Exchange of India limited) collated on the basis of trades executed by FIIs/FPIs (Foreign Portfolio Investors)
The trading data below of DII’s (Domestic Institutional Investors) indicates the trades executed by Mutual Funds, New Pension System, Banks, Insurance, DFIs and Insurance across NSE, MSEI and BSE
Table no: 1 FII vs DII TRADING ACTIVITIES (From October 2014 to July 2018)
FII (Rs. in Crores) DII (Rs. in Crores)
Date Gross Purchase Gross Sales Net Purchases/ Sales
Gross
Purchase Gross Sales
Net Purchase/ Sales
Pre-Demonetisation period
Oct-14 68678.08 70360.95 -1682.87 30691.34 26588.47 4102.87
Nov-14 92237.70 81292 10945.59 28664.95 35936.29 -7271.34
Dec-14 76004.51 79941.33 -3936.82 37301.10 31345.31 5995.79
Jan-15 97928.91 89388.15 8504.76 33785.16 40316.91 -6531.75
5.49 2.25
2.09 1.64 0.75 0.17 -4.11 -4.87 -5.41 -5.77 -7.58 -8.33 -8.99 -9.77 -11.91 -12.44 -18.42 -27.63
-30 -25 -20 -15 -10 -5 0 5 10
Infrastructure IT Healthcare Oil & Gas Utilities Energy Telecom Sensex Metal Consumer Discretionary Bankex Finance Manufacturing FMCG Capital goods Auto Consumer Durables Realty
Post Demonetisation Sectoral returns (%) - BSE
5515 IJSTR©2020
www.ijstr.org
Feb-15 98624.75 91878.55 6746.20 38472.96 36761.08 1711.88
Mar-15 113231.70 106651.03 6580.67 41189.93 40995.17 194.76
Apr-15 112729.67 104865.31 7864.36 42708.08 31196.62 11511.46
May-15 115328.54 120124.79 -4796.25 42361.08 33778.82 8582.26
Jun-15 88687.39 96880.31 -8192.92 41851.78 29825.23 12026.55
Jul-15 87724.15 85426.10 2298.05 35163.76 35091.45 72.31
Aug-15 95879.11 115651.18 -19772.07 48145.48 31707.95 16437.53
Sep-15 81805.27 93084.59 -11279.32 39091.63 28818.57 10273.06
Oct-15 77250.13 74223.47 3026.66 32159.62 33678.48 -1518.86
Nov-15 75013.31 84043.12 -9029.81 33828.14 25328.16 8499.98
Dec-15 69530.14 71890.16 -2360.02 37088.08 30760.44 6327.64
Jan-16 71491.92 85847.93 -14356.01 43075.94 30201.04 12874.90
Feb-16 74262.92 86776.04 -12513.12 40129.01 29637.40 10491.61
Mar-16 108002.95 83801.44 24201.51 31576.15 48468.05 -16891.90
Apr-16 69963.65 67027.37 2936.28 24467.25 27021.61 -2554.36
May-16 97116.20 97077.81 38.39 38877.32 32119.24 6758.08
Jun-16 89373.04 85415.09 3957.95 35927.95 38101.50 -2173.55
Jul-16 91989.79 81867.10 10122.69 38640.08 44694.68 -6054.60
Aug-16 110195.16 101416.89 8778.27 45174.03 49580.34 -4406.31
Sep-16 101165.89 97836.27 3329.62 51440.20 49440.98 1999.22
Oct-16 72661.20 78431.39 -5770.19 45294.51 37388.16 7906.35
Post Demonetisation period
Nov-16 110863.20 130845.57 -19982.37 66379.78 48102.75 18277.03
Dec-16 74545.48 85870.76 -11325.28 42473.11 33337.02 9136.09
Jan-17 76909.72 78811.04 -1901.32 50855.74 46351.80 4503.94
Feb-17 107722.25 99017.79 8704.46 61116.21 60180.95 935.26
Mar-17 153101.24 126628.07 26473.17 65535.41 69931.02 -4395.61
Apr-17 81594.59 88222.15 -6627.56 60188.82 50941.39 9247.43
May-17 123004.66 123457.20 -452.54 69117.29 64840.23 4277.06
Jun-17 99619.25 103670.68 -4051.43 60330.87 53654.76 6676.11
Jul-17 104497.69 103032.84 1464.85 67911.76 63125.39 4786.37
Aug-17 95588.51 111584.14 -15995.63 70219.04 54013.82 16205.22
Sep-17 95431.19 119401.16 -23969.97 79160.50 58134.97 21025.53
Oct-17 103827.67 111654.20 -7826.53 74713.94 64623.03 10090.91
Nov-17 132245.68 145760.46 -13514.78 89605.94 80362.73 9243.21
Dec-17 96087.52 102499.09 -6411.57 76814.06 68671.18 8142.88
Jan-18 134222.01 124654.01 9568.00 93029.54 92630.81 398.73
Feb-18 101881.52 120500.67 -18619.15 82216.56 64403.55 17813.01
Mar-18 118876.79 110971.94 7904.85 79303.18 72609.27 6693.91
Apr-18 92062.09 101682.65 -9620.56 70705.51 62041.63 8663.88
May-18 120914.92 133274.63 -12359.71 87103.11 72048.63 15054.48
Jun-18 109343.10 119592.27 -10249.17 78930.30 64784.15 14146.15
Jul-18 97483.65 100252.40 -2768.75 74731.75 70885.88 3845.87
From the above table, it is clear that, positive figure indicates net purchases and negative figure indicates net sales.
In pre-demonetisation period (Oct 2014 to Nov 8,2016), the FII’s net purchases recorded maximum on Nov 2014 by Rs.10945 crores & July 2016 by Rs.10122 crores, whereas DII’s recorded maximum net purchases on Aug 2015 by Rs.16438 crores
In post-demonetisation period (Nov 2016 to July 2018), the FII’s net sales was maximum in November 2016 but it was almost equal to DII’s net purchases, and DII’s net purchases was recorded maximum in November 2016 which was due to fall in the prices of almost all the stocks listed in the stock exchanges on
demonetisation move. Now the DII’s net purchases is experiencing a bullish trend and gaining a positive steady growth in the Indian Stock Market. Hence, both FII & DII’s trading activities balanced themselves in the either ways.
3)
PRE AND POST DEMONETISATION IMPACTS ON SECTORIAL INDICES OF NSE (National Stock Exchange) IN TERMS OF SHARE PRICE3.1 PRE AND POST DEMONETISATION IMPACTS ON NIFTY REALTY INDEX Exhibit 5: Trend chart of Nifty Realty index onPre and Post Demonetisation period in terms of share value
Source: Secondary data
From the above chart, in Pre-demonetisation period (October 2014 to November 8, 2016), the stock experienced a bearish (downward) trend in first half of the study to 128 points on Feb 2016. In the last half of the study, the stock experienced bullish (upward) trend of 205 points on Oct 2016.
In Post demonetisation period (From November 9, 2016 to July 2018), Nifty Realty Index shows a bullish trend and reached its peak by 360 points on Jan 2018. Now the Index is experiencing bearish trend, fallen to 264 points in July 2018.
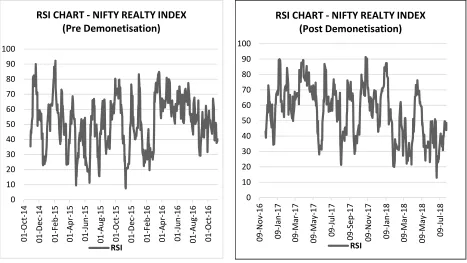
Exhibit 6: RSI (Relative Strength Index) chart of Nifty Realty index onPre and Post Demonetisation period in terms of share value.
0 50 100 150 200 250 300
01-O
ct-14
01-De
c-14
01-F
e
b
-15
01-A
p
r-15
01-Ju
n
-15
01-A
u
g-15
01-O
ct-15
01-De
c-15
01-F
e
b
-16
01
-A
p
r-16
01-Ju
n
-16
01-A
u
g-16
01-O
ct-16
TREND CHART - NIFTY REALTY INDEX
Pre Demonetisation
Nifty Realty Close price
0 50 100 150 200 250 300 350 400
09-N
o
v-16
09-Jan
-17
09-Mar
-17
09-May-17 09
-Ju
l-17
09-S
e
p
-17
09-N
o
v-17
09-Jan
-18
09-Mar
-18
09-May-18 09-Ju
l-18
TREND CHART - NIFTY REALTY INDEX
Post Demonetisation
5517 IJSTR©2020
www.ijstr.org Source: Secondary data
From the above chart, in Pre-demonetisation period, the level of RSI for Nifty Realty is said to be between 30-60 where maximum of the investors were holding their securities, i.e. neither bought nor sold.
In Post Demonetisation period, initially the level of RSI was maximum between 50-80 indicating the bullish trend of the stock i.e. overbought, which is a good signal to the investors for investments. In February 2018, the RSI has fallen to 20 that indicates oversold. Now the RSI is between 30-50 where majority of the investors are holding their securities, i.e. neither bought nor sold.
STATISTICAL ANALYSIS
Table no: 2 Statistical analysis on the basis of stock returns of Nifty Realty Index on pre and post demonetisation period.
Statistical tools
Pre Demonetisation period Post Demonetisation period
Nifty 50 (%) Nifty Realty (%) Nifty 50 (%) Nifty Realty (%)
Average returns 0.02 0.02 0.07 0.12
Variance 0.01 0.04 0.004 0.027
Standard deviation 0.97 2.03 0.66 1.66
Correlation 0.3297 0.6015
Covariance 0.001 0.0003
From the above table it is clear that,
Both Nifty 50 and Nifty realty indices found a rise in their returns in post demonetisation when compared to pre demonetisation. Variance of the returns of indices reduced in post demonetisation period i.e. spread of the returns is less. The Standard deviation is minimized from its mean during post demonetisation period.
The covariance and correlation analysis is calculated between the mean returns of Nifty 50 and Nifty Realty Indices for the period October 2014 to July 2018. The
result of the correlation analysis i.e. the highest correlation coefficient is 0.6015 on post demonetisation period indicating strong positive relationship (positive correlation) exists between the returns for Nifty 50 and Nifty Realty indices. Hence Nifty 50 and Nifty Realty indices move in same direction which indicates to the investors to go confidently in developing a better (diversified) portfolio with Nifty 50 and Nifty Realty indices. 0
10 20 30 40 50 60 70 80 90 100
09-N
o
v-16
09-Jan
-17
09-Mar
-17
09-May-17 09-Ju
l-17
09-S
e
p
-17
09-N
o
v-17
09-Jan
-18
09-Mar
-18
09-May-18 09-Ju
l-18
RSI CHART - NIFTY REALTY INDEX
(Post Demonetisation)
RSI 0
10 20 30 40 50 60 70 80 90 100
01-O
ct-14
01-De
c-14
01-F
e
b
-15
01-A
p
r-15
01-Ju
n
-15
01-A
u
g-15
01-O
ct-15
01-De
c-15
01-F
e
b
-16
01-A
p
r-16
01-Ju
n
-16
01-A
u
g-16
01
-Oc
t-1
6
RSI CHART - NIFTY REALTY INDEX
(Pre Demonetisation)
REGRESSION ANALYSIS
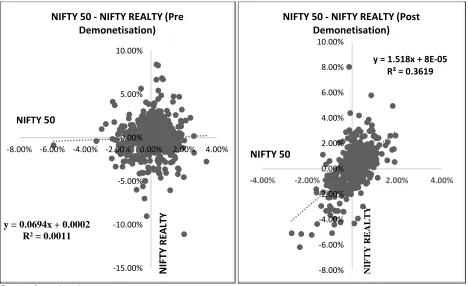
Exhibit 7: Regression Analysis between returns of Nifty 50 & Nifty Realty on Pre and Post demonetisation period
Source: Secondary data
Table no 3: Showing the summary output for the regression analysis between Nifty 50 & Nifty Realty indices on pre and post demonetisation period
Regression Statistics (Nifty 50 – Nifty Realty)
Statistics Pre Demonetisation Post Demonetisation
Multiple R 0.0331 0.6014
R Square 0.0011 0.3619
Adjusted R Square -0.0008 0.3602
Standard Error 0.0203 0.0132
Observations 514 429
Note: Theregression analysis is calculated on the mean returns of Nifty 50 and Nifty Realty indices for the period October 2014 to July 2018.
Nifty 50 index returns (Independent variable) is plotted along x-axis and Nifty Realty index returns (Dependent variable) is plotted along y-axis. The regression line shows how Nifty Realty index returns varies with Nifty 50 index returnsFrom the above table and graph, it is clear that, the regression line is sloping upwards that tells us that as Nifty 50 index returns increase along the x-axis, the Nifty Realty index returns also tend to increase along the y-axis.
In pre demonetisation period, in the regression equation, for every 1% increase in Nifty 50 index returns (X), there is a 0.07% of increase in Nifty Realty index returns. R square is 0.0011 on the variation in Nifty realty (Y) is explained by Nifty 50 regression line.
In post demonetisation period, in the regression equation, for every 1% increase in Nifty 50 index returns (X), there is a 1.52% of increase in Nifty Realty y = 0.0694x + 0.0002
R² = 0.0011
-15.00% -10.00% -5.00% 0.00% 5.00% 10.00%
-8.00% -6.00% -4.00% -2.00% 0.00% 2.00% 4.00%
NIFTY 50 - NIFTY REALTY (Pre
Demonetisation)
NIFTY
50
N
IFTY
R
EA
LTY
y = 1.518x + 8E-05 R² = 0.3619
-8.00% -6.00% -4.00% -2.00% 0.00% 2.00% 4.00% 6.00% 8.00% 10.00%
-4.00% -2.00% 0.00% 2.00% 4.00%
NIFTY 50 - NIFTY REALTY (Post
Demonetisation)
NIFTY 50
NI
FTY
REA
5519 IJSTR©2020
www.ijstr.org index returns. R square is 0.3619 on the variation in
Nifty realty (Y) is explained by Nifty 50 regression
line. Hence there is a significant impact of Nifty 50 on Nifty Realty index.
3.2 PRE AND POST DEMONETISATION IMPACT IN TERMS OF SHARE VALUE OF NIFTY AUTO INDEX
Exhibit no 8: Trend chart of Nifty Auto Index on Pre and Post Demonetisation move
Source: Secondary data
From the above chart, in pre-demonetisation period (October 2014 to November 8, 2016), the stocks experienced a bearish (downward) trend in first half of the study to 6950 points on Feb 2016. In the last half of the study the stock is experiencing bullish (upward) trend of 9913 points during Oct 2016.
In post demonetisation period (From November 9, 2016 to July 2018), Nifty Auto Index shows a bullish trend and reached its peak by 11867 points on Jan 2018 in its share price. And now the Index is experiencing bearish trend, that has fallen to 10752 points in July 2018
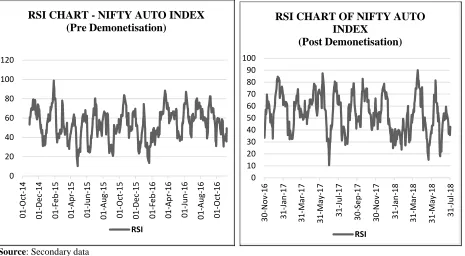
Exhibit 9: RSI (Relative Strength Index) chart of Nifty Auto index onPre and Post Demonetisation period in terms of share value.
0 2000 4000 6000 8000 10000 12000
01-O
ct-14
01-D
e
c-14
01-F
e
b
-15
01-A
p
r-15
01
-Ju
n
-15
01-A
u
g-15
01-O
ct-15
01-D
e
c-15
01-F
e
b
-16
01-A
p
r-16
01-Jun
-16
01-A
u
g-16
01-O
ct-16
NIFTY AUTO INDEX - TREND CHART
(Pre Demonetisation)
Nifty Auto Close price
0 2000 4000 6000 8000 10000 12000 14000
09-N
o
v-16
09-Jan-17 09-M
ar
-17
09-M
ay
-17
09
-Ju
l-17
09
-S
ep-1
7
09-N
o
v-17
09-Jan-18 09-M
ar
-18
09-M
ay
-18
09-Jul
-18
NIFTY AUTO INDEX - TREND CHART
(Post Demonetisation)
Source: Secondary data
From the above chart, in pre-demonetisation period, the level of RSI for Nifty Auto index is said to be between 30-50 where majority of the investors were holding their securities, i.e. neither bought nor sold
In Post Demonetisation period, initially the level of RSI was maximum between 50-80, shows the
bullish trend of the stock that is said to be overbought which is a good signal to the investors to make investments. In April 2018, the RSI has reached its peak to 90 that indicates overbought. Now the RSI is said to be between 30-50 where maximum of the investors were holding their securities, i.e. neither bought nor sold
STATISTICAL ANALYSIS
Table no: 4 Statistical analysis on the basis of stock returns of Nifty Auto Index on pre and post demonetisation period.
Statistical tools
Pre Demonetisation period Post Demonetisation period Nifty 50 (%) Nifty Auto (%) Nifty 50 (%) Nifty Auto (%)
Average returns 0.02 0.06 0.07 0.03
Variance 0.01 0.02 0.004 0.01
Standard deviation 0.97 1.25 0.66 0.98
Correlation 0.0253 0.7570
Covariance 0.0003 0.005
From the above table it is clear that,
Both Nifty 50 and Nifty Auto indices had a rise in their returns in post demonetisation when compared to pre demonetisation. Variance of the returns of indices is reduced in post demonetisation period i.e. spread of the returns is less. The Standard deviation is minimized from its mean in post demonetisation period.
The covariance and correlation analysis is calculated between the mean returns of Nifty 50 and Nifty Auto Indices for the period October 2014 to July 2018. The
result of the correlation analysis i.e. the highest correlation coefficient is 0.7570 on post demonetisation period indicating strong positive relationship (positive correlation) exists between the returns for Nifty 50 and Nifty Auto indices. Hence Nifty 50 and Nifty Auto indices move in same direction which indicates to the investors to go confidently in developing a better (diversified) portfolio with Nifty 50 and Nifty Auto indices
REGRESSION ANALYSIS
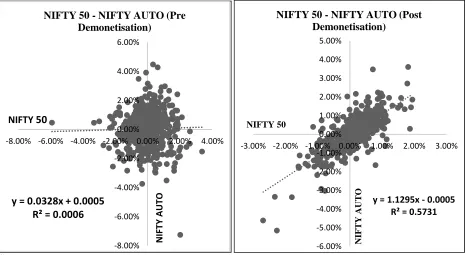
Exhibit 10: Regression Analysis between returns of Nifty 50 & Nifty Auto indices on Pre and Post demonetisation period. 0
20 40 60 80 100 120
01-O
ct-14
01-De
c-14
01-F
e
b
-15
01-A
p
r-15
01-Ju
n
-15
01-A
u
g-15
01
-Oc
t-1
5
01-De
c-15
01-F
e
b
-16
01-A
p
r-16
01-Ju
n
-16
01-A
u
g-16
01-O
ct-16
RSI CHART - NIFTY AUTO INDEX
(Pre Demonetisation)
RSI
0 10 20 30 40 50 60 70 80 90 100
30-N
o
v-16
31-Jan
-17
31-Mar
-17
31
-M
ay-17
31-Ju
l-17
30-S
e
p
-17
30-N
o
v-17
31-Jan
-18
31-Mar
-18
31-May-18 31-Ju
l-18
RSI CHART OF NIFTY AUTO
INDEX
(Post Demonetisation)
5521 IJSTR©2020
www.ijstr.org Source: Secondary data
Table no 5: Showing the summary output for the regression analysis between Nifty 50 & Nifty Auto indices on pre and post demonetisation period
Regression Statistics (Nifty 50 – Nifty Auto)
Statistics Pre Demonetisation Post Demonetisation
Multiple R 0.0238 0.7569
R Square 0.0006 0.5731
Adjusted R Square -0.0013 0.5720
Standard Error 0.0124 0.0064
Observations 514 429
Note: The regression analysis is calculated on the mean returns of Nifty 50 and Nifty Auto indices for the period October 2014 to July 2018. Nifty 50 index returns (Independent variable) is plotted along x-axis and Nifty Auto index returns (Dependent variable) is plotted along y-axis. The regression line shows how Nifty Auto index returns varies with Nifty 50 index returns. From the above table and graph, it is clear that, the regression line is sloping upwards that tells us that as Nifty 50 index returns increase along the x-axis, the Nifty Auto index returns also tend to increase along the y-axis.
In pre demonetisation period, in the regression equation, for every 1% increase in Nifty 50 index returns (X), there is a 0.03% of increase in Nifty Auto index returns. R square is 0.0006 on the variation in Nifty Auto (Y) is explained by Nifty 50 regression line.
In post demonetisation period, in the regression equation, for every 1% increase Nifty 50 index returns
(X), there is a 1.13% of increase in Nifty Auto index returns. R square is 0.5731 on the variation in Nifty Auto (Y) is explained by Nifty 50 regression line.
Hence there is a significant impact of Nifty 50 on Nifty Auto index.
FINDINGS
Sectoral Indices Performance of BSE & NSE on The Basis of Mean Returns
a) Pre-demonetisation returns – Most affected sectors were Realty and Consumption, whereas most benefited ones are Metal and FMCG.
b) Post demonetisation returns – Most affected sectors were Auto, Realty and Consumer Durables, whereas most benefited ones are Nifty PSE (Private Sector Enterprise), Infrastructure, Information Technology, Healthcare and Oil & gas.
y = 0.0328x + 0.0005
R² = 0.0006
-8.00% -6.00% -4.00% -2.00% 0.00% 2.00% 4.00% 6.00%
-8.00% -6.00% -4.00% -2.00% 0.00% 2.00% 4.00%
NIFTY 50 - NIFTY AUTO (Pre Demonetisation)
NIFTY
50
N
IF
TY
A
UT
O y = 1.1295x - 0.0005
R² = 0.5731
-6.00% -5.00% -4.00% -3.00% -2.00% -1.00% 0.00% 1.00% 2.00% 3.00% 4.00% 5.00%
-3.00% -2.00% -1.00% 0.00% 1.00% 2.00% 3.00%
NIFTY 50 - NIFTY AUTO (Post Demonetisation)
NIFTY 50
NI
FTY
AU
The Nifty Metal Index is said to be the cash king for the year 2016.
c) Both BSE SENSEX and NIFTY 50 indices are experiencing bullish trend and reached 37500 and 11320 points respectively during post demonetisation.
FII Vs DII’s trading activities, in pre-demonetisation period (Oct 2014 to Nov 8,2016), the FII’s net purchases recorded maximum on Nov 2014 & July 2016, whereas DII’s recorded maximum net purchases on Aug 2015. In post-demonetisation period (Nov 2016 to July 2018), the FII’s net sales was maximum in November 2016 but it was almost equal to DII’s net purchases, Now the DII’s net purchases is experiencing a bullish trend and gaining a positive steady growth in the Indian Stock Market.
Both Nifty Realty and Nifty Auto indices experienced bearish (downward) trend in post demonetisation period. From January 2017 to current date (July 2018), the indices are reviving their momentum to bullish (upward) trend.
In pre-demonetisation period, the level of RSI for Nifty Auto and Nifty Realty indices is said to be between 30-50 where majority of the investors are holding their securities. In post demonetisation period, the Realty index is regaining their momentum with RSI values indicating overbought of stocks which is a good signal for the investors to make investments. But to Nifty Auto index, majority of the investors are holding their securities.
Statistical analysis indicates both Nifty Realty and Nifty Auto indices shows increased returns in post demonetisation when compared to pre demonetisation.
In Post Demonetisation period, the highest correlation coefficients for both the indices (Nifty Realty & Nifty Auto) in comparison to Nifty 50 index was seem to be positively correlated and moves in same direction, which indicates to the investors to go confidently in developing a better (diversified) portfolio with Nifty 50, Nifty Realty and Nifty Auto Indices.
Regression analysis proves that there is a significant impact of Nifty 50 index on both the Nifty Realty & Nifty Auto indices.
CONCLUSION
Hence, it is evident that, demonetisation had a temporary impact on the stock market and the investors need to look beyond it. Investors have to make wise investment in the potential (long term growth) sectors to get
long term benefit from the stock market. Both the Automobile and the Real estate sector was hard hit by demonetisation move, but now slowly these sectors are gaining momentum in the economy. The demonetisation move, showed a negative impact in the short term, but in the long term, it shows a tremendous positive growth to the economy.
REFERENCES
Anil K. Sharma and Neha Seth (2011), “Recent Financial crisis and market efficiency: An Empirical analysis of Indian Stock Market”, Indore Management Journal, January – March 2011, Volume 2 Issue 4, pp. 27-39.
Anupam Rastogi and Smita Mazumdar (2015), “Corporate Debt Restructuring (CDR) and its impact on Firms’ Stock market performance: A study of Pre and Post CDR Share price movements”, South Asian Journal of Management, Volume no 23, pp. 18-26.
R. Chakrabarti (2001), “FII Flows to India: Nature and Causes”, Journal of International Money and Finance, October – December 2001, Vol. 2, No. 7.
Gurmeet Singh (2015),”FII Flows to Indian Capital Market: A Cause and Effect study”, Business review, June 2015, Vol. 9, Issue.
Gyanpratha (2013), “Influence of FII flows to Indian Stock Market, ACCMAN Journal of Management, Vol. 5, Issue 1.
GL Kaminsky and SL Schmukler (1999), “What triggers market jitters? A chronicle of the Asian crisis”, Journal of International Money and Finance”, August 1999, Vol. 18(4).
P. Mukherjee and M Roy (2011), “The nature of determinants of investments by Institutional investors in the Indian Stock market”, Journal of Emerging Market Finance, November 2011, Vol. 10(3), pp. 253-283.
Shivani Inder and J. S. Pasricha (2015), “ Empirical testing of Asian Stock Market linkages with Indian Stock Market: A cointegration approach, Apeejay Journal of Management and Technology, January 2015, Vol. 10(1), pp. 12-21.