Substance Abuse and Rehabilitation
Dovepress
O R I G I N A L R E S E A R C H open access to scientific and medical research
Open Access Full Text Article
Relationship between buprenorphine adherence
and relapse, health care utilization and costs in
privately and publicly insured patients with
opioid use disorder
Naoko A Ronquest1
Tina M Willson2
Leslie B Montejano2
Vijay R Nadipelli1
Bernd A Wollschlaeger3
1Global Health Economics and
Outcomes Research, Indivior Inc.,
Richmond, VA, USA; 2Outcomes
Research, Truven Health Analytics®,
Part of the IBM Watson Health™ Business, Cambridge, MA, USA;
3Aventura Family Health Center,
Miami, FL, USA
Background: Treatment for opioid use disorder is important because of the negative health,
societal and economic consequences of illicit opioid use, but treatment adherence can be a chal-lenge. This study assessed the association between buprenorphine medication-assisted treatment (MAT) adherence and relapse, health care utilization and costs.
Patients and methods: Patients with opioid use disorder who were newly initiating a
buprenorphine MAT regimen were identified in the 2008–2014 MarketScan® Commercial and
Medicaid Databases and followed for 12 months after their earliest outpatient pharmacy claim for buprenorphine. Adherence was categorized using proportion of days covered (PDC) with buprenorphine, and patients with PDC≥0.80 were classified as adherent. Descriptive and adjusted analyses compared relapse prevalence, utilization and costs, all measured in the 12 months following buprenorphine MAT initiation, of adherent patients to patients in non-adherent PDC categories (PDC<0.20, 0.20≤PDC<0.40, 0.40≤PDC<0.60, 0.60≤PDC<0.80).
Results: Adherent patients were 37.1% of the Commercial sample (N=16,085) and 41.3% of
the Medicaid sample (N=5,688). In both samples, non-adherent patients were significantly more likely than adherent patients to relapse and to have hospitalizations and emergency department visits. As a result, as buprenorphine MAT adherence increased, pharmacy costs increased, but medical costs decreased. Total costs (pharmacy plus medical costs) in the 12 months following buprenorphine MAT initiation decreased with adherence in Commercial patients ($28,525 for PDC<0.20 to $17,844 for PDC≥0.80). A slight decrease in total costs in the 12 months following buprenorphine MAT initiation was also observed in Medicaid patients ($21,292 for PDC<0.20 to $18,621 for PDC≥0.80). After adjustment, total costs of adherent patients in the Commercial sample ($17,519) were significantly lower compared with those of non-adherent patients (range $20,294–$24,431). In the Medicaid sample, adjusted total costs were not significantly different between adherence groups.
Conclusion: Buprenorphine MAT adherence in the 12 months following treatment was
asso-ciated with reduced odds of relapse and reduced unadjusted medical costs. For Commercial patients who were adherent to treatment, the adjusted total costs were predicted to be 30% lower than those for patients with PDC<0.20.
Keywords: buprenorphine, adherence, opioid use disorder, relapse, utilization, costs
Introduction
The misuse of opioids, including prescription pain relievers, illegally produced opioids and heroin, is a growing public health concern. In 2015, an estimated 2.0 million people aged 12 years or older in the USA met the criteria for an opioid use disorder (OUD) Correspondence: Leslie B Montejano
Outcomes Research, Truven Health Analytics, IBM Watson Health, 75 Binney Street, Cambridge, MA 02142, USA Email [email protected]
Journal name: Substance Abuse and Rehabilitation Article Designation: ORIGINAL RESEARCH Year: 2018
Volume: 9
Running head verso: Ronquest et al
Running head recto: Buprenorphine adherence and relapse, utilization and costs in OUD patients DOI: http://dx.doi.org/10.2147/SAR.S150253
Substance Abuse and Rehabilitation downloaded from https://www.dovepress.com/ by 118.70.13.36 on 27-Aug-2020
For personal use only.
Dovepress
Ronquest et al
involving prescription pain relievers in the past 12 months, and 0.6 million individuals had an OUD involving heroin in the past 12 months.1 (The term “opioid use disorder” was
introduced in the Diagnostic and Statistical Manual of Mental Disorders, fifth edition.2 Previously, the terms “opioid
depen-dence” and “opioid abuse” were used to diagnose correspond-ing conditions). Furthermore, the USA is amid a national opioid overdose epidemic with the rate of opioid-related overdose deaths increasing by more than 200% in the past 15 years.3 In addition to death from overdose, OUD has been
associated with blood-borne infections such as hepatitis and HIV, criminal involvement, productivity losses and increased health care utilization and costs.4–10 The resulting economic
burden is significant with recent estimates of the societal costs of OUD and opioid overdose exceeding $78 billion.6
Treatment for OUD is important because of the negative consequences of illicit opioid use; however, treating OUD patients is often challenging as OUD is a chronic disease characterized by episodes of relapse and remission.11
Cur-rent treatment options include psychosocial therapy and medication-assisted treatment (MAT) with methadone, buprenorphine (alone or in combination with naloxone) or naltrexone.11 Buprenorphine MAT, a commonly used therapy
and the focus of this study, is an effective treatment option that is available in outpatient office-based settings through waivered clinicians.12,13 From 2000 to 2016, only physicians
were eligible to apply for and receive waivers. In 2016, US federal regulations extended waivering to nurse practitio-ners (NPs) and physician assistants (PAs). In some states, buprenorphine prescribing may be limited to waivered physi-cians, or NPs and PAs working under a waivered physician, due to state-level scope-of-practice laws.
A previous study found that buprenorphine MAT was associated with a reduced incidence of relapse among patients with OUD.14 In addition, it has been shown that
opioid-dependent patients adherent to buprenorphine MAT in the year following treatment initiation had reduced utilization of expensive health care services15–17 and total health care
costs.15,16 However, these reductions were among patients in
a single Commercial health plan15,16 or in one state Medicaid
plan,17 and to the authors’ knowledge no study has explored
the effect of adherence on outcomes in large real-world samples of patients from different health plans throughout the USA.
The primary objective of this study was to understand the relationship between buprenorphine MAT adherence and odds of relapse, health care resource utilization and costs among both commercially insured and publicly insured (ie,
Medicaid) patients with OUD who were newly initiating buprenorphine MAT. The secondary objective was to identify factors associated with buprenorphine MAT adherence. This study expands on the insights gained from prior studies by examining the impact of adherence among a large, national sample of individuals with OUD.
Patients and methods
Study design and data source
This retrospective, observational cohort study used adminis-trative claims data from the MarketScan® Commercial Claims
and Encounters (Commercial)18 and Medicaid Multi-State
(Medicaid)19 Research Databases. The Commercial Database
includes fully adjudicated medical and pharmacy claims for more than 100 million employees and their dependents from across the USA including more than 38 million lives in 2013 alone. Major data contributors include employers and health plans that cover employees and their dependents through different insurance plan structures including fee-for-service, fully capitated and partially capitated health plans. The Medicaid Database includes similar information for Medicaid beneficiaries in several geographically dispersed states. Both databases provide detailed cost, utilization and outcome data for health care services performed in both inpatient and outpatient settings, including retail and mail order outpatient pharmacies. All study data were de-identified and fully compliant with the Health Insurance Portability and Accountability Act (HIPAA) of 1996. The study entailed analyses of existing databases in which subjects could not be identified. Therefore, the study was not considered human subject research and did not require institutional review board (IRB) approval.
Study population
Patients of any age with at least one outpatient pharmacy claim for buprenorphine from January 1, 2008, to March 31, 2014, in the Commercial Database or June 30, 2014, in the Medicaid Database were selected for analysis. The date of the earliest buprenorphine claim was set as the index date. Patients were required to have at least one inpatient or outpatient service claim including a diagnosis of opioid dependence or abuse (International Classifica-tion of Diseases, Ninth Revision, Clinical ModificaClassifica-tion [ICD-9-CM] 304.0×, 304.7× or 305.5×) prior to or on the index date. Patients with index dates in 2008 may have been identified in the middle of a treatment episode; thus, patients with outpatient pharmacy claims for buprenorphine in the 3 months prior to the index date were excluded to
Substance Abuse and Rehabilitation downloaded from https://www.dovepress.com/ by 118.70.13.36 on 27-Aug-2020
Dovepress Buprenorphine adherence and relapse, utilization and costs in OUD patients
ensure patients were initiating a new treatment episode as of the index date. Continuous enrollment with medical and pharmacy benefits for 6 months prior to and 12 months following the index date was required for study inclusion. Patients from database contributors that may have mental health and substance abuse carve-outs that do not share data with the plan were excluded because claims in the database for these patients may not represent all covered health care utilization. Patients treated with an average daily dose of buprenorphine of less than 4 mg/day and who remained on treatment less than 30 days were excluded, as these patients were likely to be detoxification patients rather than patients using buprenorphine MAT as maintenance therapy. Medicaid patients were excluded if they had dual Medicaid/Medicare eligibility because services covered in full by Medicare may not be included in the MarketScan Medicaid Multi-State Database. Patients were followed up over 12 months, commencing on the index date (ie, at buprenorphine initiation).
Adherence
Buprenorphine MAT adherence was measured using the proportion of days covered (PDC) by buprenorphine in the 12 months following treatment initiation. The total days of possession of buprenorphine were calculated from the days of supply information on outpatient pharmacy claims, regardless of gaps in therapy. For patients who refilled early, overlapping days were appended to the total days of supply. PDC was then calculated as:
PDC Sum of days sup y in the study period Days in the fol
= pl
llow-up period 365days( )
Patients were grouped by PDC into the following cat-egories: PDC<0.20, 0.20≤PDC<0.40, 0.40≤PDC<0.60, 0.60≤PDC<0.80 and PDC≥0.80. Patients with PDC≥0.80 were classified as adherent, consistent with previous studies in this disease area15,16 and other chronic conditions.20
Outcome measures
Relapse prevalence
Relapse prevalence was measured during the follow-up period of the study. Relapses are not directly captured in claims data, so a proxy measure based on services that may be indicators of relapse was employed. The proxy measure, which was a modification of a measure used in previous claims-based studies,21,22 defined relapse as the presence
of claims for any of the following binary (yes/no) relapse indicators:
• Diagnosis code of opioid dependence, continuous or episodic (ICD-9-CM 304.01, 304.02, 304.71, 304.72), following an opioid dependence in remission code (ICD-9-CM 304.03, 304.73)
• Inpatient admission with a primary diagnosis related to opioid use (opioid dependence, opioid abuse or opioid overdose [ICD-9-CM 965.09])
• Detoxification with any diagnosis related to opioid use • Emergency department (ED) visit with any diagnosis
related to opioid use
Based on the clinical experience of one of the authors (BAW) in treating patients with OUD and given the limitations of the claims data used in this study, these indicators were chosen as proxies for relapse, which could capture both apparent relapses (eg, inpatient admission and ED visit) and relapses identified by treating clinicians at an earlier stage (eg, diag-nosis code change and detoxification). Each indicator was measured separately for descriptive review. Patients with one or more relapse indicator at any time during the 12 months following buprenorphine MAT initiation were categorized as having relapsed for the purposes of modeling.
Health care utilization and costs
All-cause health care utilization and costs were evaluated during the 12-month post-index period. Specific utiliza-tion measures included inpatient admissions, ED visits, physician office visits and outpatient pharmacy services. Corresponding costs were measured from the paid amounts on relevant claims, including both the patient responsibil-ity (eg, deductible, copay or coinsurance) and the health plan payment (including coordination of benefit amount). Cost categories were created by summing costs across all relevant claims. Inpatient costs were defined as all costs related to an admission. Outpatient costs included costs from ED visits, physician office visits and other non-pharmacy outpatient services. Medical costs comprised inpatient plus outpatient costs, and total costs comprised medical costs plus outpatient pharmacy costs. If the sum of a patient’s costs across all claims in a category was less than zero, which occasionally happens in claims data if claims are erroneously reconciled, the patient’s costs for that category were set to zero. No trimming of high-end cost outliers was conducted. Similar health care utilization and cost measures were calculated from claims in the 6-month pre-index period to compare against the post-index measures. All cost esti-mates were inflation adjusted to 2014 US dollars, using the medical component of the Consumer Price Index.
Substance Abuse and Rehabilitation downloaded from https://www.dovepress.com/ by 118.70.13.36 on 27-Aug-2020
Dovepress
Ronquest et al
Other variables
Patient demographics including age in years, sex, race (Med-icaid Database only), geographic region of residence (Com-mercial Database only), urban/rural residence, insurance plan type and relationship to the policyholder (Commercial Database only) were measured on the index date. Sex is a binary variable (male, female) in the databases used for this analysis. Race, in the Medicaid Database was categorized as follows: White (not of Hispanic ethnicity); Black (not of Hispanic ethnicity); Hispanic (regardless of race) and others (American Indian/Alaskan Native, Asian or native Hawaiian/ other Pacific Islander). Geographic region in the Commer-cial Database is based on US census regions, which include Northeast, Northcentral (Midwest), South and West. The urban/rural residence designation in the databases is based on whether place of residence is located within a US metro-politan statistical area (urban) or not (rural). Insurance plan type (eg, preferred provider organization [PPO] and health maintenance organization [HMO]) and the relationship to the policyholder (Commercial Database only, ie, employee, spouse or child/others) were categorized as recorded on the index buprenorphine claim.
The Deyo-Charlson Comorbidity Index (DCI)23 was
calculated from claims during the 6-month pre-index period. The DCI is an aggregate measure of comorbidity, expressed as a numeric score, based on the presence of diagnoses for selected chronic conditions (ie, cerebrovascular disease, con-gestive heart failure, chronic pulmonary disease, dementia, diabetes, hemiplegia or paraplegia, HIV/AIDS, liver disease, malignancy [any], metastatic solid tumor, myocardial infarc-tion, peptic ulcer disease, peripheral vascular disease, renal disease and rheumatologic disease), which are assigned weights ranging from 1 to 6 points. Weights for all conditions recorded in the patient’s claims are summed to produce the DCI score. The range of possible scores is 0–33 with higher scores reflective of greater comorbid burden.
Specific pre-index comorbid conditions were measured based on the presence of one or more non-diagnostic claim in the 6-month pre-index period carrying a diagnosis code indicative of the condition. Only non-diagnostic claims – that is, claims other than for laboratory and radiology services – were used to create the comorbid condition variables, because diagnostic claims may list rule-out conditions rather than actual comorbidities. Comorbidity variables included non-opioid drug use disorder, alcohol use disorder, depressive disorder, bipolar disorder, gen-eralized anxiety disorder, schizophrenia, chronic pain condition (eg, migraine, headache syndromes, spondylosis,
disc disorders, cervicalgia, torticollis, neuropathies, osteo-arthritis, rheumatoid osteo-arthritis, endometriosis, chronic pan-creatitis, chronic postoperative or trauma pain), HIV/AIDS, hepatitis B and hepatitis C. The comorbid non-opioid drug use disorder variable measured disorders involving substances other than opioids, alcohol and tobacco, includ-ing sedatives, hypnotics, anxiolytics, cocaine, cannabis, amphetamines, non-amphetamine psychostimulants, hallu-cinogens, antidepressants and other unspecified substances. Opioids were not included in this variable because all patients in the study had evidence of OUD on or prior to the index date, and the intent was to measure comorbid drug use disorders related to non-opioid substances. Alcohol was not included when measuring non-opioid drug use disorder because pre-index comorbid alcohol use disorder was measured with a separate variable.
Concomitant medication use was measured based on one or more outpatient pharmacy claim in the 6-month pre-index period for the following medication classes: opioid analgesics excluding buprenorphine and methadone (eg, codeine, fen-tanyl, hydrocodone, hydromorphone, meperidine, morphine, oxycodone, oxymorphone, pentazocine, propoxyphene and tapentadol), benzodiazepines, non-benzodiazepine sedative/ hypnotics, antidepressants and antipsychotics. An outpatient services claim for an injectable antipsychotic also was con-sidered evidence of concomitant antipsychotic use. MAT other than buprenorphine MAT (ie, methadone MAT, oral naltrexone MAT and extended-release injectable naltrexone MAT) was measured based on one or more relevant claim in the 6-month pre-index period. Psychosocial treatment was measured in the 12-month post-index period.
Buprenorphine dosing variables were created to include as covariates in modeling because previous studies suggested that buprenorphine dose may impact subsequent treatment retention and adherence.24,25 The average daily dose of
buprenorphine was measured over the first 6 months post-index to assess the association between dosing in the initial months of treatment and medication adherence over the 12-month follow-up period. Average daily dose was calcu-lated from information on pharmacy claims by determining the milligrams of product dispensed at each fill (ie, tablet strength × number of tablets) and performing the following calculation:
Average daily dose
Total milligrams dispensed in the time
= frame
Sum of days supply in the time frame
Substance Abuse and Rehabilitation downloaded from https://www.dovepress.com/ by 118.70.13.36 on 27-Aug-2020
Dovepress Buprenorphine adherence and relapse, utilization and costs in OUD patients
Access restrictions (eg, prior authorization) imposed by state Medicaid agencies may affect buprenorphine adherence. Thus, for the Medicaid analysis, a variable was created to indicate the presence of any of the following restrictions on access to buprenorphine: daily dose limit of 16 mg or less, lifetime treatment length limit of 1 year or less or prior authorization frequency of ≤6 months. This variable could not be reported descriptively due to confidentiality agreements with database contributors, but was included as a covariate when modeling buprenorphine adherence.
Statistical analyses
The Commercial and Medicaid samples were analyzed sepa-rately in parallel analyses. The patient group with PDC≥0.80 (ie, patients defined as adherent) was the reference category for all statistical comparisons. Chi-squared tests and Student’s t-tests were used to evaluate the statistical significance of dif-ferences in patient characteristics between PDC categories for categorical variables and continuous variables, respectively. For categorical variables, when more than 20% of cells in a comparison had expected observations of 5 or fewer, Fisher’s exact tests were used. An a priori p-value of <0.05 was set as the threshold for statistical significance.
Adjusted analyses were conducted to examine the impact of PDC on relapse and total health care costs in the year following buprenorphine MAT initiation and to assess the factors of adherence to buprenorphine MAT. Relapse in the 12 months following treatment initiation, a binary (yes/no) variable, was modeled via standard logistic regression. In addition to the PDC category, covariates in the relapse mod-els included the following: age, sex, race (Medicaid only), relationship to policyholder (Commercial only), insurance plan type, pre-index alcohol use disorder diagnosis, pre-index non-opioid drug use disorder diagnosis, pre-index severe mental illness diagnosis (schizophrenia and/or bipolar dis-order), pre-index other mental illness diagnosis (depressive disorder and/or generalized anxiety disorder) and pre-index chronic pain condition diagnosis. Examination of Schoenfeld residuals26 and variation inflation factors27 for each covariate
confirmed the appropriateness of the model structure and absence of high correlation between covariates, respectively.
Generalized linear models (GLMs) with a log link and underlying gamma distribution were used to model the cost data. The same set of covariates used in the relapse models was included in the cost models. Model diagnostics sug-gested that the models may overestimate costs for some covariates among very expensive patients. Costs were, therefore, adjusted based on the GLM coefficients for the
key explanatory variable of PDC category as well as for other variables that the analysis suggested may be cost drivers (Commercial: relationship to policyholder, pre-index chronic pain condition diagnosis; Medicaid: insurance plan type, pre-index severe mental illness diagnosis) in case model trends were dissimilar across subgroups.
Factors associated with adherence were identified in a logistic regression model that estimated the impact of patient characteristics on being in the adherent cohort (ie, having PDC≥0.80 vs. PDC<0.80). Covariates were similar to those used in the relapse and cost models, except that PDC cat-egories were not included as covariates since PDC was used to define the dependent variable of adherence. In addition, the following covariates were added to assess their associa-tion with adherence: geographic region (Commercial only); urban/rural residence; Medicaid access restrictions on buprenorphine (Medicaid only); pre-index MAT other than buprenorphine MAT; buprenorphine average dose in the first 6 months post-index and post-index psychosocial treatment. The review of variation inflation factors27 confirmed that there
was no high multicollinearity between model covariates. All data management, descriptive analyses, bivariate analyses and adjusted analyses were conducted using SAS 9.4 (SAS Institute Inc, Cary, NC, USA).
Results
Patient selection and PDC groups
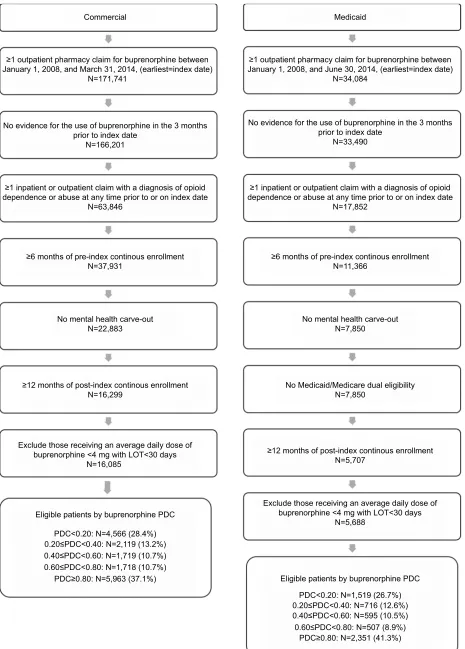
A total of 16,085 commercially insured patients and 5,688 Medicaid patients were qualified for the analysis (Figure 1). In the Commercial sample, 37.1% of patients were classified as adherent based on PDC≥0.80. Among the non-adherent patients, 28.4% had PDC<0.20, 13.2% had 0.20≤PDC<0.40, 10.7% had 0.40≤PDC<0.60 and 10.7% had 0.60≤PDC<0.80. In the Medicaid sample, 41.3% of patients were adherent. Among the non-adherent patients, 26.7% had PDC<0.20, 12.6% had 0.20≤PDC<0.40, 10.5% had 0.40≤PDC<0.60 and 8.9% had 0.60≤PDC<0.80.
Patient characteristics
Baseline patient demographics and clinical characteristics are presented in Table 1 (Commercial) and Table 2 (Medicaid). The majority of patients in the Commercial sample were male (62.7%), while the majority of Medicaid patients (72.6%) were female. The high proportion of female patients in the Medicaid sample is consistent with the high female-to-male ratio among Medicaid beneficiaries in the underlying data-base, which is likely related to Medicaid eligibility require-ments. The overall study sample in both the Commercial
Substance Abuse and Rehabilitation downloaded from https://www.dovepress.com/ by 118.70.13.36 on 27-Aug-2020
Dovepress
Ronquest et al
Figure 1 Patient selection.
Abbreviation: PDC, proportion of days covered; LOT, length of treatment.
Commercial
≥1 outpatient pharmacy claim for buprenorphine between January 1, 2008, and March 31, 2014, (earliest=index date)
N=171,741
≥1 inpatient or outpatient claim with a diagnosis of opioid dependence or abuse at any time prior to or on index date
N=63,846
≥6 months of pre-index continous enrollment N=37,931
No mental health carve-out N=22,883
≥12 months of post-index continous enrollment N=16,299
≥12 months of post-index continous enrollment N=5,707
No Medicaid/Medicare dual eligibility N=7,850
Exclude those receiving an average daily dose of buprenorphine <4 mg with LOT<30 days
N=16,085
Eligible patients by buprenorphine PDC
Eligible patients by buprenorphine PDC Exclude those receiving an average daily dose of
buprenorphine <4 mg with LOT<30 days N=5,688
PDC<0.20: N=4,566 (28.4%)
PDC<0.20: N=1,519 (26.7%) 0.20≤PDC<0.40: N=2,119 (13.2%)
0.20≤PDC<0.40: N=716 (12.6%) 0.40≤PDC<0.60: N=595 (10.5%) 0.60≤PDC<0.80: N=507 (8.9%) 0.40≤PDC<0.60: N=1,719 (10.7%)
0.60≤PDC<0.80: N=1,718 (10.7%) PDC≥0.80: N=5,963 (37.1%)
PDC≥0.80: N=2,351 (41.3%) No mental health carve-out
N=7,850
≥6 months of pre-index continous enrollment N=11,366
≥1 inpatient or outpatient claim with a diagnosis of opioid dependence or abuse at any time prior to or on index date
N=17,852 No evidence for the use of buprenorphine in the 3 months
prior to index date N=166,201
No evidence for the use of buprenorphine in the 3 months prior to index date
N=33,490
≥1 outpatient pharmacy claim for buprenorphine between January 1, 2008, and June 30, 2014, (earliest=index date)
N=34,084 Medicaid
Substance Abuse and Rehabilitation downloaded from https://www.dovepress.com/ by 118.70.13.36 on 27-Aug-2020
Dovepress Buprenorphine adherence and relapse, utilization and costs in OUD patients
Table 1
Baseline demographic and clinical characteristics among adult patients with OUD who were newly initiating buprenorphine MAT: Commercial sample
All (n=
16,085) PDC < 0.20 (n = 4,566) p -value a 0.20 £ PDC < 0.40 (n = 2,119) p -value a 0.40 £ PDC < 0.60 (n = 1,719) p -value a 0.60 £ PDC < 0.80 (n = 1,718) p -value a PDC ≥ 0.80 (n = 5,963)
Age, mean (SD)
32.9 (12.7) 32.3 (13.4) < 0.001 31.0 (12.5) < 0.001 31.7 (12.7) < 0.001 32.3 (12.4) < 0.001 34.5 (12.1)
Age group, n (%)
< 0.001 < 0.001 < 0.001 < 0.001 < 18 years 256 (1.6%) 79 (1.7%) 45 (2.1%) 33 (1.9%) 34 (2.0%) 65 (1.1%) 18–24 years 6,221 (38.7%) 2,084 (45.6%) 989 (46.7%) 766 (44.6%) 684 (39.8%) 1,698 (28.5%) 25–34 years 3,201 (19.9%) 666 (14.6%) 360 (17.0%) 302 (17.6%) 354 (20.6%) 1,519 (25.5%) 35–44 years 2,735 (17.0%) 659 (14.4%) 310 (14.6%) 252 (14.7%) 283 (16.5%) 1,231 (20.6%) 45–54 years 2,482 (15.4%) 677 (14.8%) 297 (14.0%) 252 (14.7%) 249 (14.5%) 1,007 (16.9%) 55–64 years 1,190 (7.4%) 401 (8.8%) 118 (5.6%) 114 (6.6%) 114 (6.6%) 443 (7.4%)
Sex, n (%)
0.004 0.227 0.514 0.687 Male 10,093 (62.7%) 2,792 (61.1%) 1,322 (62.4%) 1,083 (63.0%) 1,088 (63.3%) 3,808 (63.9%) Female 5,992 (37.3%) 1,774 (38.9%) 797 (37.6%) 636 (37.0%) 630 (36.7%) 2,155 (36.1%)
Geographic region, n (%)
< 0.001 < 0.001 < 0.001 0.001 Northeast 4,125 (25.6%) 1,063 (23.3%) 557 (26.3%) 389 (22.6%) 419 (24.4%) 1,697 (28.5%) Northcentral 4,017 (25.0%) 1,174 (25.7%) 575 (27.1%) 415 (24.1%) 432 (25.1%) 1,421 (23.8%) South 4,549 (28.3%) 1,207 (26.4%) 516 (24.4%) 534 (31.1%) 539 (31.4%) 1,753 (29.4%) West 3,238 (20.1%) 1,090 (23.9%) 454 (21.4%) 366 (21.3%) 317 (18.5%) 1,011 (17.0%) Unknown 156 (1.0%) 32 (0.7%) 17 (0.8%) 15 (0.9%) 11 (0.6%) 81 (1.4%)
Urban/rural residence, n (%)
< 0.001 < 0.001 0.023 0.002 Urban 13,828 (86.0%) 4,025 (88.2%) 1,866 (88.1%) 1,478 (86.0%) 1,486 (86.5%) 4,973 (83.4%) Rural 2,102 (13.1%) 509 (11.1%) 237 (11.2%) 226 (13.1%) 221 (12.9%) 909 (15.2%) Unknown 155 (1.0%) 32 (0.7%) 16 (0.8%) 15 (0.9%) 11 (0.6%) 81 (1.4%)
Insurance plan type, n (%)
< 0.001 0.001 0.002 0.444 Comprehensive/indemnity 476 (3.0%) 145 (3.2%) 63 (3.0%) 48 (2.8%) 45 (2.6%) 175 (2.9%) EPO/PPO 9,394 (58.4%) 2,580 (56.5%) 1,233 (58.2%) 1,018 (59.2%) 1,036 (60.3%) 3,527 (59.1%)
POS/POS with capitation
1,718 (10.7%) 475 (10.4%) 218 (10.3%) 166 (9.7%) 198 (11.5%) 661 (11.1%) HMO 2,407 (15.0%) 783 (17.1%) 331 (15.6%) 274 (15.9%) 227 (13.2%) 792 (13.3%) CDHP/HDHP 954 (5.9%) 310 (6.8%) 139 (6.6%) 105 (6.1%) 93 (5.4%) 307 (5.1%) Others/unknown 1,136 (7.1%) 273 (6.0%) 135 (6.4%) 108 (6.3%) 119 (6.9%) 501 (8.4%)
Relationship to policyholder, n (%)
< 0.001 < 0.001 < 0.001 < 0.001 Employee (policyholder) 5,884 (36.6%) 1,357 (29.7%) 641 (30.3%) 534 (31.1%) 605 (35.2%) 2,747 (46.1%) Spouse 4,034 (25.1%) 1,101 (24.1%) 488 (23.0%) 418 (24.3%) 426 (24.8%) 1,601 (26.8%) Child/others 6,167 (38.3%) 2,108 (46.2%) 990 (46.7%) 767 (44.6%) 687 (40.0%) 1,615 (27.1%)
Pre-index Charlson Comorbidity Index, mean (SD)
0.2 (0.7) 0.3 (0.7) < 0.001 0.2 (0.7) 0.082 0.2 (0.8) 0.115 0.2 (0.6) 0.590 0.2 (0.7)
Pre-index comorbid conditions, n (%) Non-opioid drug use disorder
4,566 (28.4%) 1,566 (34.3%) < 0.001 664 (31.3%) < 0.001 503 (29.3%) < 0.001 457 (26.6%) 0.003 1,376 (23.1%)
Alcohol use disorder
1,753 (10.9%) 606 (13.3%) < 0.001 248 (11.7%) < 0.001 190 (11.1%) 0.009 174 (10.1%) 0.145 535 (9.0%) Depressive disorder 4,711 (29.3%) 1,446 (31.7%) < 0.001 621 (29.3%) 0.085 529 (30.8%) 0.005 484 (28.2%) 0.502 1,631 (27.4%) ( Continued )
Substance Abuse and Rehabilitation downloaded from https://www.dovepress.com/ by 118.70.13.36 on 27-Aug-2020
Dovepress
Ronquest et al
All (n=
16,085) PDC < 0.20 (n = 4,566) p -value a 0.20 £ PDC < 0.40 (n = 2,119) p -value a 0.40 £ PDC < 0.60 (n = 1,719) p -value a 0.60 £ PDC < 0.80 (n = 1,718) p -value a PDC ≥ 0.80 (n = 5,963) Bipolar disorder 1,124 (7.0%) 372 (8.1%) < 0.001 160 (7.6%) < 0.001 141 (8.2%) < 0.001 128 (7.5%) 0.002 323 (5.4%)
Generalized anxiety disorder
927 (5.8%) 271 (5.9%) 0.421 120 (5.7%) 0.870 117 (6.8%) 0.054 87 (5.1%) 0.418 332 (5.6%) Schizophrenia 68 (0.4%) 29 (0.6%) N/A 13 (0.6%) N/A < 10 ( < 0.6%) N/A < 10 ( < 0.6%) N/A 16 (0.3%)
Chronic pain condition
7,306 (45.4%) 2,129 (46.6%) 0.725 902 (42.6%) < 0.001 716 (41.7%) < 0.001 758 (44.1%) 0.037 2,801 (47.0%) HIV/AIDS 24 (0.1%) 10 (0.2%) N/A < 10 ( < 0.5%) N/A < 10 ( < 0.6%) N/A < 10 ( < 0.6%) N/A < 10 ( < 0.2%) Hepatitis B 22 (0.1%) < 10 ( < 0.2%) N/A < 10 ( < 0.5%) N/A < 10 ( < 0.6%) N/A < 10 ( < 0.6%) N/A < 10 ( < 0.2%) Hepatitis C 360 (2.2%) 128 (2.8%) < 0.001 50 (2.4%) 0.052 44 (2.6%) 0.020 37 (2.2%) 0.206 101 (1.7%)
Pre-index concomitant medications, n (%) Opioid analgesicsb
8,497 (52.8%) 2,411 (52.8%) 0.004 1,039 (49.0%) < 0.001 835 (48.6%) < 0.001 896 (52.2%) 0.011 3,316 (55.6%) Benzodiazepines 4,695 (29.2%) 1,390 (30.4%) 0.015 630 (29.7%) 0.203 509 (29.6%) 0.280 480 (27.9%) 0.786 1,686 (28.3%) Non-benzodiazepine; sedative/hypnotics 3,467 (21.6%) 1,031 (22.6%) 0.016 476 (22.5%) 0.075 376 (21.9%) 0.263 354 (20.6%) 0.984 1,230 (20.6%) Antidepressants 7,336 (45.6%) 2,092 (45.8%) 0.695 924 (43.6%) 0.039 793 (46.1%) 0.959 772 (44.9%) 0.354 2,755 (46.2%) Antipsychotics 1,969 (12.2%) 614 (13.4%) < 0.001 289 (13.6%) < 0.001 226 (13.1%) 0.002 216 (12.6%) 0.014 624 (10.5%)
Average daily dose of buprenorphine,
c n
(%) < 0.001 < 0.001 < 0.001 < 0.001 ≤ 4 mg 825 (5.1%) 395 (8.7%) 120 (5.7%) 82 (4.8%) 65 (3.8%) 163 (2.7%) > 4–8 mg 3,099 (19.3%) 1,364 (29.9%) 425 (20.1%) 284 (16.5%) 249 (14.5%) 777 (13.0%) > 8–12 mg 2,621 (16.3%) 644 (14.1%) 384 (18.1%) 307 (17.9%) 342 (19.9%) 944 (15.8%) > 12–16 mg 5,018 (31.2%) 1,285 (28.1%) 659 (31.1%) 555 (32.3%) 551 (32.1%) 1,968 (33.0%) > 16–20 mg 1,862 (11.6%) 328 (7.2%) 245 (11.6%) 214 (12.4%) 208 (12.1%) 867 (14.5%) > 20–24 mg 1,970 (12.2%) 399 (8.7%) 222 (10.5%) 204 (11.9%) 223 (13.0%) 922 (15.5%) > 24 mg 690 (4.3%) 151 (3.3%) 64 (3.0%) 73 (4.2%) 80 (4.7%) 322 (5.4%) Notes:
aBased on comparison with the PDC
≥
0.80 group.
bExcluding buprenorphine and methadone. cMeasured during the first 6
months of the post-index period.
Abbreviations:
CDHP, consumer-driven health plan; EPO, exclusive provider organizatio
n; HDHP, high deductible health plan; HMO, health maintenance organization;
MAT, medication-assisted
treatment; OUD, opioid use disorder;
PDC, proportion of days covered; POS, point of service plan; PPO, preferred provider organization; N/A, not applicable.
Table 1
(
Continued
)
Substance Abuse and Rehabilitation downloaded from https://www.dovepress.com/ by 118.70.13.36 on 27-Aug-2020
Dovepress Buprenorphine adherence and relapse, utilization and costs in OUD patients
Table 2
Baseline demographic and clinical characteristics among adult patients with OUD who were newly initiating buprenorphine MAT: Medicaid sample
All (n = 5,688) PDC < 0.20 (n = 1,519) p -value a 0.20 £ PDC < 0.40 (n = 716) p -value a 0.40 £ PDC < 0.60 (n = 595) p -value a 0.60 £ PDC < 0.80 (n = 507) p-value a PDC ≥ 0.80 (n = 2,351)
Age, mean (SD)
32.4 (9.4) 33.2 (10.4) 0.022 31.1 (9.2) < 0.001 31.7 (8.9) 0.051 32.0 (9.2) 0.316 32.5 (8.9)
Age group, n (%)
b < 0.001 < 0.001 0.027 0.434 ≤ 24 years 1,111 (19.5%) 319 (21.0%) 182 (25.4%) 125 (21.0%) 99 (19.5%) 386 (16.4%) 25–34 years 2,683 (47.2%) 622 (40.9%) 333 (46.5%) 282 (47.4%) 251 (49.5%) 1,195 (50.8%) 35–44 years 1,179 (20.7%) 329 (21.7%) 127 (17.7%) 133 (22.4%) 96 (18.9%) 494 (21.0%) 45–54 years 543 (9.5%) 184 (12.1%) 59 (8.2%) 45 (7.6%) 48 (9.5%) 207 (8.8%) 55–65 + years 172 (3.0%) 65 (4.3%) 15 (2.1%) 10 (1.7%) 13 (2.6%) 69 (2.9%)
Sex, n (%)
0.002 0.693 0.686 0.840 Male 1,561 (27.4%) 466 (30.7%) 192 (26.8%) 160 (26.9%) 130 (25.6%) 613 (26.1%) Female 4,127 (72.6%) 1,053 (69.3%) 524 (73.2%) 435 (73.1%) 377 (74.4%) 1,738 (73.9%)
Race, n (%)
< 0.001 0.810 0.660 0.552 White 4,943 (86.9%) 1,262 (83.1%) 634 (88.5%) 521 (87.6%) 452 (89.2%) 2,074 (88.2%) Non-White/unknown 745 (13.1%) 257 (16.9%) 82 (11.5%) 74 (12.4%) 55 (10.8%) 277 (11.8%)
Urban/rural residence, n (%)
0.001 0.448 0.129 0.034 Urban 3,688 (64.8%) 1,062 (69.9%) 443 (61.9%) 373 (62.7%) 297 (58.6%) 1,513 (64.4%) Rural 1,860 (32.7%) 421 (27.7%) 254 (35.5%) 200 (33.6%) 200 (39.4%) 785 (33.4%) Unknown 140 (2.5%) 36 (2.4%) 19 (2.7%) 22 (3.7%) 10 (2.0%) 53 (2.3%)
Insurance plan type, n (%)
c < 0.001 < 0.001 < 0.001 < 0.001 Non-managed care 4,028 (70.8%) 1,007 (66.3%) 485 (67.7%) 391 (65.7%) 338 (66.7%) 1,807 (76.9%)
Medicaid managed care
1,660 (29.2%) 512 (33.7%) 231 (32.3%) 204 (34.3%) 169 (33.3%) 544 (23.1%)
Pre-index Charlson Comorbidity Index, mean (SD)
0.4 (0.9) 0.5 (1.2) < 0.001 0.4 (1.0) 0.068 0.3 (0.7) 0.187 0.3 (0.8) 0.202 0.3 (0.8)
Pre-index comorbid conditions, n (%) Non-opioid drug use disorder
2,176 (38.3%) 685 (45.1%) < 0.001 282 (39.4%) 0.002 232 (39.0%) 0.008 197 (38.9%) 0.014 780 (33.2%)
Alcohol use disorder
559 (9.8%) 196 (12.9%) < 0.001 65 (9.1%) 0.301 61 (10.3%) 0.060 52 (10.3%) 0.077 185 (7.9%) Depressive disorder 2,306 (40.5%) 650 (42.8%) 0.005 304 (42.5%) 0.045 246 (41.3%) 0.171 206 (40.6%) 0.325 900 (38.3%) Bipolar disorder 1,024 (18.0%) 335 (22.1%) < 0.001 126 (17.6%) 0.159 116 (19.5%) 0.015 85 (16.8%) 0.442 362 (15.4%)
Generalized anxiety disorder
606 (10.7%) 161 (10.6%) 0.745 85 (11.9%) 0.484 61 (10.3%) 0.633 42 (8.3%) 0.077 257 (10.9%) Schizophrenia 148 (2.6%) 59 (3.9%) < 0.001 20 (2.8%) 0.043 14 (2.4%) 0.223 17 (3.4%) 0.010 38 (1.6%)
Chronic pain condition
3,290 (57.8%) 924 (60.8%) < 0.001 437 (61.0%) 0.004 351 (59.0%) 0.074 287 (56.6%) 0.486 1,291 (54.9%) HIV/AIDS 48 (0.8%) 22 (1.4%) 0.002 11 (1.5%) 0.005 < 10 ( < 1.7%) N/A < 10 ( < 2.0%) N/A 12 (0.5%) Hepatitis B 27 (0.5%) < 10 ( < 0.7%) N/A < 10 ( < 1.4%) N/A < 10 ( < 1.7%) N/A < 10 ( < 2.0%) N/A 13 (0.6%) Hepatitis C 465 (8.2%) 151 (9.9%) 0.001 55 (7.7%) 0.470 57 (9.6%) 0.025 40 (7.9%) 0.426 162 (6.9%)
Pre-index concomitant medications, n (%) Opioid analgesics
d 3,681 (64.7%) 1,009 (66.4%) 0.007 493 (68.9%) 0.001 389 (65.4%) 0.150 328 (64.7%) 0.290 1,462 (62.2%) Benzodiazepines 1,883 (33.1%) 564 (37.1%) < 0.001 252 (35.2%) 0.007 198 (33.3%) 0.106 167 (32.9%) 0.172 702 (29.9%) Non-benzodiazepine; sedative/hypnotic 1,298 (22.8%) 387 (25.5%) < 0.001 191 (26.7%) < 0.001 143 (24.0%) 0.028 108 (21.3%) 0.491 469 (19.9%) ( Continued )
Substance Abuse and Rehabilitation downloaded from https://www.dovepress.com/ by 118.70.13.36 on 27-Aug-2020
Dovepress
Ronquest et al
and Medicaid samples had an average age of 32 years. Commercial patients with PDC≥0.80 were slightly older and more likely to be the insured employee (as opposed to a dependent) than those with lower adherence. Among Med-icaid patients, the proportion of Black patients was higher among patients with PDC<0.20 (12.1%), 0.20≤PDC<0.40 (6.3%) and 0.40≤PDC<0.60 (6.4%) as compared to patients with PDC≥0.80 (4.3%).
In both the Commercial and Medicaid samples, signifi-cantly higher (p<0.001) rates of baseline alcohol use disorder, non-opioid drug use disorder, depressive disorder and bipolar disorder were observed in those with PDC<0.20 than among adherent patients (PDC≥0.80). A higher rate of chronic pain conditions was observed among Medicaid patients with the lowest level of adherence (PDC<0.20) compared to adherent patients (p<0.001). Medicaid patients with PDC<0.20 had higher rates of concomitant medication use including opioid analgesics, benzodiazepines, non-benzodiazepine sedative/ hypnotics, antidepressants and antipsychotics than adherent patients (opioid analgesics, p=0.007; all other medication classes, p<0.001).
Relapse prevalence
In the Commercial sample, 21.2% of patients had at least one indicator of relapse during the 12-month post-index period with the lowest prevalence of relapse observed in patients with PDC≥0.80 (11.4%). The proportion of patients with at least one indicator of relapse was significantly higher in each of the lower adherence groups compared to the adherent group (Table 3). The same trend was observed when each relapse indicator was considered individually, except for the indicator measuring a diagnosis code of opioid dependence, continuous or episodic, following an opioid dependence in remission code, which was significantly different between the lowest adherence group (PDC<0.20) and the adherent group (PDC≥80%), but similar across other PDC groups.
In the Medicaid sample, 15.0% of patients had at least one indicator of relapse during the 12-month post-index period with the lowest relapse prevalence observed in adher-ent patiadher-ents (10.0%). Similar to the trend observed in the Commercial sample, the proportion of Medicaid patients with an indicator of relapse was significantly higher in each of the lower adherence groups compared to the adherent group (Table 3). The same trend was observed when each relapse indicator was considered individually, except for the indicator measuring a diagnosis code of opioid dependence, continuous or episodic, following an opioid dependence in remission code, which was significantly different between the
All (n = 5,688) PDC < 0.20 (n = 1,519) p -value a 0.20 £ PDC < 0.40 (n = 716) p -value a 0.40 £ PDC < 0.60 (n = 595) p -value a 0.60 £ PDC < 0.80 (n = 507) p-value a PDC ≥ 0.80 (n = 2,351) Antidepressants 2,794 (49.1%) 812 (53.5%) < 0.001 352 (49.2%) 0.203 293 (49.2%) 0.222 245 (48.3%) 0.443 1,092 (46.4%) Antipsychotics 1,075 (18.9%) 349 (23.0%) < 0.001 133 (18.6%) 0.206 116 (19.5%) 0.088 88 (17.4%) 0.657 389 (16.5%)
Average daily dose of buprenorphine,
e n (%)
< 0.001 < 0.001 < 0.001 0.140 ≤ 8 mg 819 (14.4%) 450 (29.6%) 104 (14.5%) 77 (12.9%) 44 (8.7%) 144 (6.1%) > 8–12 mg 605 (10.6%) 156 (10.3%) 95 (13.3%) 82 (13.8%) 56 (11.0%) 216 (9.2%) > 12–16 mg 1,876 (33.0%) 502 (33.0%) 245 (34.2%) 170 (28.6%) 170 (33.5%) 789 (33.6%) > 16–20 mg 806 (14.2%) 140 (9.2%) 96 (13.4%) 91 (15.3%) 82 (16.2%) 397 (16.9%) > 20–24 mg 1,230 (21.6%) 223 (14.7%) 139 (19.4%) 135 (22.7%) 123 (24.3%) 610 (25.9%) > 24 mg 352 (6.2%) 48 (3.2%) 37 (5.2%) 40 (6.7%) 32 (6.3%) 195 (8.3%) Notes: aBas ed on comparison
with the PDC
≥
0.80 group.
bFew patients
were aged < 18 years (n = 55) or aged 65 + years (n < 10), so age group categories were combined. cMedicaid managed care included patients
in POS plans
with capitation
or
HMO plans.
All other plan types
were considered
non-managed
care. Few patients
had
an
unknown plan type (n
<
10); these
patients
were combined
with the non-managed
care
group.
dExcluding buprenorphine and
methadone. eMeasured during the first 6 months of the post-index period. Of 148 patients with a dose of ≤ 4
mg, 105 were in the PDC
<
0.20 group, but few (n
<
10) were in some
other PDC categories;
thus, the ≤ 4 mg and > 4–8 mg average daily
dose categories were combined. Abbreviations:
HMO, health maintenance organization; MAT, medication-assisted treatment; OUD, opioid use disorder; PDC, proportion of days covered; POS, point of service; N/A, not applicable.
Table 2
(
Continued
)
Substance Abuse and Rehabilitation downloaded from https://www.dovepress.com/ by 118.70.13.36 on 27-Aug-2020
Dovepress Buprenorphine adherence and relapse, utilization and costs in OUD patients
Table 3
Unadjusted
relapse prevalence, health care resource
utilization and
costs
in the 12-month post-index period among
adult patients with OUD who were newly initiating
buprenorphine MAT
Commercial sample (n
= 16,085) All (n = 16,085) PDC < 0.20 (n = 4,566) p -value a 0.20 £ PDC < 0.40 (n = 2,119) p -value a 0.40 £ PDC < 0.60 (n = 1,719) p -value a 0.60 £ PDC < 0.80 (n = 1,718) p -value a PDC ≥ 0.80 (n = 5,963)
Relapse prevalence in the 12-month post-index period, n (%) Continuous/episodic dependence following remission diagnosis
355 (2.2%) 45 (1.0%) < 0.001 52 (2.5%) 0.544 48 (2.8%) 0.836 49 (2.9%) 0.733 161 (2.7%)
Inpatient admission, primary diagnosis related to opioid use
b 1,838 (11.4%) 784 (17.2%) < 0.001 380 (17.9%) < 0.001 267 (15.5%) < 0.001 179 (10.4%) < 0.001 228 (3.8%)
Detoxification, any diagnosis related to opioid use
1,893 (11.8%) 739 (16.2%) < 0.001 398 (18.8%) < 0.001 276 (16.1%) < 0.001 195 (11.4%) < 0.001 285 (4.8%)
ED visit, any diagnosis related to opioid use
1,195 (7.4%) 485 (10.6%) < 0.001 227 (10.7%) < 0.001 144 (8.4%) < 0.001 123 (7.2%) < 0.001 216 (3.6%)
Any of the abovementioned relapse indicators
3,404 (21.2%) 1,288 (28.2%) < 0.001 640 (30.2%) < 0.001 444 (25.8%) < 0.001 351 (20.4%) < 0.001 681 (11.4%)
Utilization in the 12-month post-index period Patients with an inpatient admission, n (%)
5,122 (31.8%) 2,025 (44.3%) < 0.001 869 (41.0%) < 0.001 644 (37.5%) < 0.001 517 (30.1%) < 0.001 1,067 (17.9%)
Patients with any ED visit, n (%)
7,314 (45.5%) 2,512 (55.0%) < 0.001 1,175 (55.5%) < 0.001 828 (48.2%) < 0.001 742 (43.2%) < 0.001 2,057 (34.5%)
Number of physician office visits per patient, mean (SD)
11.2 (10.0) 8.9 (10.1) < 0.001 9.9 (9.4) 0.046 10.7 (9.1) 0.015 12.1 (10.2) 0.717 13.2 (10.0) Number
of outpatient pharmacy
claims per patient, mean (SD)
37.9 (29.7) 33.2 (33.5) < 0.001 34.6 (31.0) < 0.001 37.2 (28.5) < 0.001 39.6 (26.5) < 0.001 42.3 (26.4)
Costs in the 12-month post-index period, mean (SD) Inpatient costs
$6,555 ($33,613) $10,953 ($55,006) < 0.001 $8,792 ($27,193) < 0.001 $7,633 ($25,619) < 0.001 $5,689 ($22,657) < 0.001 $2,330 ($9,832) Outpatient costs $11,211 ($19,477) $14,212 ($24,842) < 0.001 $12,436 ($20,936) < 0.001 $12,689 ($22,102) < 0.001 $10,556 ($21,553) < 0.001 $8,239 ($10,181) ED costs $1,029 ($2,905) $1,510 ($3,742) < 0.001 $1,386 ($3,999) < 0.001 $1,162 ($2,932) < 0.001 $842 ($1,999) < 0.001 $549 ($1,504)
Outpatient physician office visit costs
$1,199 ($1,235) $988 ($1,280) < 0.001 $1,100 ($1,185) < 0.001 $1,175 ($1,272) < 0.001 $1,299 ($1,242) 0.023 $1,373 ($1,173)
Other outpatient costs
$8,983 ($18,330) $11,715 ($23,460) < 0.001 $9,950 ($18,987) < 0.001 $10,352 ($21,103) < 0.001 $8,415 ($20,929) < 0.001 $6,317 ($9,416) Medical costs $17,765 ($42,537) $25,165 ($64,377) < 0.001 $21,228 ($39,620) < 0.001 $20,322 ($39,815) < 0.001 $16,245 ($34,271) < 0.001 $10,570 ($15,694)
Outpatient pharmacy costs
$5,241 ($6,073) $3,360 ($6,707) < 0.001 $3,800 ($5,694) < 0.001 $4,635 ($5,506) < 0.001 $5,561 ($5,322) < 0.001 $7,275 ($5,379)
Total health care costs, mean
(SD) $23,006 ($43,643) $28,525 ($65,851) < 0.001 $25,028 ($41,114) < 0.001 $24,957 ($41,455) < 0.001 $21,806 ($35,278) < 0.001 $17,844 ($17,642) ( Continued )
Substance Abuse and Rehabilitation downloaded from https://www.dovepress.com/ by 118.70.13.36 on 27-Aug-2020
Dovepress
Ronquest et al
Medicaid sample (n
= 5,688) All (n = 5,688) PDC < 0.20 (n = 1,519) p -value a 0.20 £ PDC < 0.40 (n = 716) p -value a 0.40 £ PDC < 0.60 (n = 595) p -value a 0.60 £ PDC < 0.80 (n = 507) p -value a PDC ≥ 0.80 (n = 2,351)
Relapse prevalence in the 12-month post-index period, n (%) Continuous/episodic dependence following remission diagnosis
141 (2.5%) 11 (0.7%) < 0.001 9 (1.3%) 0.002 21 (3.5%) 0.961 18 (3.6%) 0.945 82 (3.5%)
Inpatient admission, primary diagnosis related to opioid use
b 96 (1.7%) 44 (2.9%) < 0.001 17 (2.4%) < 0.001 14 (2.4%) < 0.001 <10 (<2.0%) N/A 14 (0.6%)
Detoxification, any diagnosis related to opioid use
129 (2.3%) 58 (3.8%) < 0.001 25 (3.5%) < 0.001 17 (2.9%) < 0.001 11 (2.2%) 0.004 18 (0.8%)
ED visit, any diagnosis related to opioid use
604 (10.6%) 228 (15.0%) < 0.001 118 (16.5%) < 0.001 62 (10.4%) < 0.001 56 (11.0%) < 0.001 140 (6.0%)
Any of the abovementioned relapse indicators
853 (15.0%) 296 (19.5%) < 0.001 142 (19.8%) < 0.001 100 (16.8%) < 0.001 80 (15.8%) < 0.001 235 (10.0%)
Utilization in the 12-month post-index period Patients with an inpatient admission, n (%)
1,645 (28.9%) 592 (39.0%) < 0.001 255 (35.6%) < 0.001 185 (31.1%) < 0.001 145 (28.6%) < 0.001 468 (19.9%)
Patients with any ED visit, n (%)
4,133 (72.7%) 1,209 (79.6%) < 0.001 569 (79.5%) < 0.001 450 (75.6%) < 0.001 376 (74.2%) < 0.001 1,529 (65.0%)
Number of physician office visits per patient, mean (SD)
10.6 (9.4) 8.3 (8.0) < 0.001 9.2 (7.5) < 0.001 10.1 (8.6) < 0.001 11.3 (8.8) 0.006 12.6 (10.5)
Number of outpatient pharmacy claims per patient, mean (SD)
47.6 (34.3) 42.6 (39.9) < 0.001 41.1 (32.6) < 0.001 46.6 (32.5) < 0.001 50.1 (32.0) 0.128 52.4 (31.0)
Costs in the 12-month post-index period, mean (SD) Inpatient costs
$5,600 ($30,440) $8,914 ($42,990) < 0.001 $8,535 ($44,359) < 0.001 $6,888 ($26,534) < 0.001 $5,137 ($24,979) < 0.001 $2,339 ($10,804) Outpatient costs $8,407 ($9,120) $8,822 ($9,730) 0.009 $8,583 ($11,701) 0.181 $8,511 ($8,355) 0.234 $8,386 ($8,179) 0.420 $8,064 ($8,135) ED costs $1,115 ($2,327) $1,604 ($2,883) < 0.001 $1,543 ($3,654) < 0.001 $1,217 ($2,127) < 0.001 $1,027 ($1,617) < 0.001 $661 ($1,243)
Outpatient physician office visit costs
$863 ($862) $654 ($665) < 0.001 $744 ($667) < 0.001 $827 ($789) < 0.001 $916 ($840) 0.014 $1,033 ($1,003)
Other outpatient costs
$6,429 ($8,035) $6,565 ($8,082) 0.447 $6,296 ($10,218) 0.834 $6,467 ($7,164) 0.778 $6,442 ($7,459) 0.845 $6,370 ($7,569) Medical costs $14,008 ($33,413) $17,737 ($46,395) < 0.001 $17,118 ($47,841) < 0.001 $15,398 ($30,027) < 0.001 $13,523 ($27,473) < 0.001 $10,403 ($14,114)
Outpatient pharmacy costs
$5,880 ($7,316) $3,555 ($7,621) < 0.001 $4,136 ($7,502) < 0.001 $4,665 ($4,223) < 0.001 $5,896 ($4,396) < 0.001 $8,218 ($7,480)
Total health care costs, mean
(SD) $19,888 ($34,652) $21,292 ($47,595) 0.013 $21,254 ($48,923) 0.027 $20,063 ($31,044) 0.128 $19,419 ($28,713) 0.406 $18,621 ($17,020) Notes:
aBased on comparison with the PDC
≥
0.80 group.
bDiagnoses related to opioid use included opioid dependence, opioid abuse or opioid overdose.
Abbreviations:
ED, emergency department; MAT, medication-assisted treatment; OUD, opioid use disorder; PDC, proportion of days covered; N/A, not applicable.
Table 3
(
Continued
)
Substance Abuse and Rehabilitation downloaded from https://www.dovepress.com/ by 118.70.13.36 on 27-Aug-2020
Dovepress Buprenorphine adherence and relapse, utilization and costs in OUD patients
two lowest adherence groups (PDC<0.20, 0.20≤PDC<0.40) and the adherent group (PDC≥80%), but similar across other PDC groups. In contrast to relapse prevalence in the Com-mercial sample, an ED visit with any diagnosis related to opioid use was the most common individual relapse indicator among Medicaid patients.
After adjustment to control for differences between cohorts, Commercial patients in all other PDC groups had significantly higher odds of experiencing at least one indica-tor of relapse in the 12 months post buprenorphine MAT ini-tiation compared to the reference group of adherent patients with PDC≥80% (PDC<0.20: adjusted odds ratio [AOR]=2.02, 95% CI=1.77–2.32; 0.20≤PDC<0.40: AOR=2.33, 95% CI=1.99–2.74; 0.40≤PDC<0.60: AOR=2.27, 95% CI=1.92– 2.70; 0.60≤PDC<0.80: AOR=1.65, 95% CI=1.37–1.98; all p<0.001). Similar results were observed among Medicaid patients in the 12-month post-index period (PDC<0.20: AOR=1.76, 95% CI=1.40–2.20; 0.20≤PDC<0.40: AOR=1.90, 95% CI=1.45–2.50; 0.40≤PDC<0.60: AOR=1.65, 95%
CI=1.22–2.23; 0.60≤PDC<0.80: AOR=1.48, 95% CI=1.06– 2.06; all p<0.01; Table 4).
Health care utilization and costs
Table 3 presents the unadjusted health care resource utiliza-tion and costs by the PDC group in the 12 months following buprenorphine MAT initiation. In both the Commercial and Medicaid samples, the proportion of patients with an inpatient admission in the 12 months following the index date was significantly higher in the non-adherent groups compared to the adherent cohort. The proportion of patients hospitalized in the lowest non-adherent group (PDC<0.20) was about twice that of patients with PDC≥80% (Commer-cial: 44.3% vs. 17.9%, p<0.001; Medicaid: 39.0% vs. 19.9%, p<0.001). A similar pattern was observed for ED utilization (Commercial: 55.0% vs. 34.5%, p<0.001; Medicaid: 79.6% vs. 65.0%, p<0.001). Adherent patients had a significantly higher number of physician office visits post buprenorphine MAT initiation than non-adherent patients. In both the
Com-Table 4 Adjusted odds of at least one indicator of relapse in the 12-month post-index period among adult patients with OUD who
were newly initiating buprenorphine MATa
Effectb Commercial sample
(n=16,085)
Medicaid sample
(n=5,688)
OR, point estimate
95% Wald OR, point
estimate
95% Wald Confidence
limits
Confidence limits
PDC: <0.20 (vs. PDC≥0.80) 2.02 1.77 2.32 1.76 1.40 2.20
PDC: 0.20≤PDC<0.40 (vs. PDC≥0.80) 2.33 1.99 2.74 1.90 1.45 2.50
PDC: 0.40≤PDC<0.60 (vs. PDC≥0.80) 2.27 1.92 2.70 1.65 1.22 2.23
PDC: 0.60≤PDC<0.80 (vs. PDC≥0.80) 1.65 1.37 1.98 1.48 1.06 2.06
Age 0.99 0.98 0.99 0.98 0.97 0.99
Female sex (vs. male) 0.97 0.87 1.08 0.87 0.72 1.07
Black race (vs. White) N/A N/A N/A 1.24 0.89 1.75
Hispanic race (vs. White) N/A N/A N/A 1.16 0.49 2.75
Other race (vs. White) N/A N/A N/A 1.52 1.06 2.18
Spouse relationship to policyholder (vs. employee) 1.01 0.86 1.19 N/A N/A N/A
Child/other relationship to policyholder (vs. employee) 2.02 1.69 2.42 N/A N/A N/A
Comprehensive/indemnity insurance plan type (vs. EPO/PPO) 1.51 1.15 2.00 N/A N/A N/A
POS/POS with capitation insurance plan type (vs. EPO/PPO) 0.90 0.76 1.07 N/A N/A N/A
HMO insurance plan type (vs. EPO/PPO) 0.99 0.86 1.14 N/A N/A N/A
CDHP/HDHP insurance plan type (vs. EPO/PPO) 0.91 0.74 1.21 N/A N/A N/A
Medicaid managed care plan type (vs. non-managed care) N/A N/A N/A 1.10 0.91 1.34
Pre-index alcohol use disorder diagnosis (vs. no) 1.22 1.05 1.42 1.18 0.90 1.56
Pre-index non-opioid drug use disorder diagnosis (vs. no) 1.30 1.17 1.45 1.41 1.17 1.71
Pre-index severe mental illness diagnosis (vs. no) 1.15 0.96 1.38 1.37 1.11 1.70
Pre-index other mental illness diagnosis (vs. no) 1.17 1.04 1.31 1.02 0.85 1.23
Pre-index chronic pain condition diagnosis (vs. no) 0.97 0.87 1.09 1.07 0.89 1.29
Notes: aBased on logistic regression models; examination of variance inflation factors confirmed the absence of high correlation between covariates. bCovariates differed
for the Commercial and Medicaid models due to differences in the underlying databases used for the analysis; variables not included in a model are denoted with “N/A”.
Abbreviations: CDHP, consumer-driven health plan; EPO, exclusive provider organization; HDHP, high deductible health plan; HMO, health maintenance organization; MAT, medication-assisted treatment; OUD, opioid use disorder; PDC, proportion of days covered; POS, point of service plan; PPO, preferred provider organization; N/A, not applicable.
Substance Abuse and Rehabilitation downloaded from https://www.dovepress.com/ by 118.70.13.36 on 27-Aug-2020
Dovepress
Ronquest et al
mercial and Medicaid samples, patients with PDC≥80% incurred about 13 physician office visits, on average, over the 12-month post-index period, compared to about eight visits for patients with PDC<0.20 (p<0.01). The difference may be explained, in part, by office visits required for buprenor-phine MAT initiation and monitoring. As expected given the association between medication adherence and prescription fills, adherent patients also had a higher number of pharmacy claims than non-adherent patients.
The average unadjusted total health care costs in the 12-month post-index period were $23,006 and $19,888 for the patients in the Commercial and Medicaid samples, respectively. In the Commercial sample, the mean unad-justed total health care costs decreased as adherence levels increased from $28,525 in patients with PDC<0.20 to $17,844 in patients with PDC≥0.80. The average health care costs in the Medicaid sample decreased slightly from $21,292 in patients with PDC<0.20 to $18,621 in patients with PDC≥0.80. Mean unadjusted outpatient pharmacy costs increased with adherence in both Commercial and Medicaid
patients while medical costs decreased with adherence levels. The large standard deviations as given in Table 3 are typi-cal of health care cost data, which are often highly skewed. This study’s inclusion criteria required all patients to have buprenorphine MAT utilization at index so there was not a cluster of patients with zero total costs; however, there were some patients with very high costs that resulted in large SDs around the mean costs.
Table 5 presents the adjusted mean total health care costs in the 12 months post buprenorphine MAT initiation for the Commercial and Medicaid samples. After adjusting for differences between PDC groups using GLMs, mean total costs in the Commercial sample decreased as adher-ence increased, with adherent patients (PDC≥0.80) having significantly lower adjusted mean total costs ($17,519) as compared to patients in all non-adherent groups (PDC<0.80; range from $20,294 to $24,431). Other factors that were found to significantly affect the health care costs in the Com-mercial sample included relationship to policyholder and having a comorbid chronic pain condition. Adjusted mean
Table 5 Adjusted total costs in the 12-month post-index period based on GLMs among adult patients with OUD who were newly
initiating buprenorphine MATa
Explanatory
variableb
Patient group Mean Standard
error
Difference in mean
Standard error of the difference
95% lower simultaneous confidence
limitc
95% upper simultaneous confidence
limitc
Commercial sample
(n=16,085)
PDC <0.20 $24,431 $403 –$6,912 $482 –$8,208 –$5,616
0.20 to <0.40 $22,697 $506 –$5,178 $570 –$6,712 –$3,644
0.40 to <0.60 $22,878 $555 –$5,359 $614 –$7,012 –$3,706
0.60 to <0.80 $20,294 $493 –$2,775 $559 –$4,278 –$1,272
≥0.80d $17,519 $264
Relationship to policyholder
Child/others $27,073 $505 $8,503 $594 $7,338 $9,668
Spouse $20,325 $400 $1,755 $508 $759 $2,751
Employeed $18,570 $313
Pre-index chronic pain condition
Yes $24,995 $378 $6,155 $465 $5,243 $7,067
Nod $18,840 $272
Medicaid sample
(n=5,688)
PDC PDC<0.20 $18,202 $693 $1,810 $1,015 –$921 $4,541
0.20≤PDC<0.40 $20,119 $902 –$107 $1,168 –$3,248 $3,034
0.40≤PDC<0.60 $19,387 $912 $625 $1,175 –$2,536 $3,786
0.60≤PDC<0.80 $18,710 $921 $1,302 $1,182 –$1,878 $4,482
PDC≥0.80d $20,012 $742
Insurance plan type Non-managed care $19,371 $703 –$3,406 $1,144 –$5,649 –$1,163
Managed cared $22,777 $903
Pre-index severe mental illness
Yes $24,146 $1,018 $5,873 $1,202 $3,518 $8,228
Nod $18,273 $639
Notes: aBased on GLMs, with model coefficients for the explanatory variable used to adjust costs. Model covariates included PDC, age, sex, race (Medicaid only), relationship
to policyholder (Commercial only), insurance plan type, pre-index diagnosis of alcohol use disorder, non-opioid drug use disorder, severe mental illness (schizophrenia and/or bipolar disorder diagnosis), other mental illnesses (depressive disorder and/or generalized anxiety disorder diagnosis) and chronic pain condition. bThe explanatory
variable of interest in this analysis was PDC. Adjusted costs are shown for the PDC groups and other variables that the analyses suggested may be cost drivers (Commercial: relationship to policyholder, pre-index chronic pain condition; Medicaid: insurance plan type, pre-index severe mental illness). cThe 95% upper and lower confidence limits
are around the difference in mean. dReference category.
Abbreviations: GLMs, generalized linear models; MAT, medication-assisted treatment; OUD, opioid use disorder; PDC, proportion of days covered.
Substance Abuse and Rehabilitation downloaded from https://www.dovepress.com/ by 118.70.13.36 on 27-Aug-2020
Dovepress Buprenorphine adherence and relapse, utilization and costs in OUD patients
total costs were significantly lower for insured employees ($18,570) than for covered dependents (spouses, $20,325; children/others, $27,073). Contrarily, the adjusted mean total costs of Commercial patients with a pre-index chronic pain condition were significantly higher ($24,995) than similar patients with no pre-index claims indicative of a chronic pain condition ($18,840).
In the Medicaid sample, adjusted mean total costs were not significantly different between adherent (PDC≥0.80) and non-adherent groups (PDC<0.80). Factors found to significantly affect the health care costs in the Medicaid sample included managed care plan type and severe men-tal illness comorbidity status. Adjusted mean tomen-tal costs for patients in Medicaid managed care plans were higher ($22,777) than for Medicaid patients in non-managed care plans ($19,371). Patients with a pre-index severe mental illness had significantly higher adjusted mean total costs in the 12-month post-index period ($24,146) than patients with no claims evidence of such a condition ($18,273).
Factors associated with adherence
Variables in the logistic regression models that were sig-nificantly associated with increased odds of adherence (PDC≥0.80) in Commercial patients (Figure 2) included receipt of psychosocial therapy post-index (AOR=1.26, 95% CI=1.173–1.348), rural residence vs. urban (AOR=1.21, 95% CI=1.098–1.335), and Northeast geographic region vs. South (AOR=1.20, 95% CI=1.095–1.312). Factors significantly associated with decreased odds of adherence were being a child or other dependent of the policyholder vs. being the employee (AOR=0.37, 95% CI=0.335–0.414), being a spouse of the policyholder vs. being the employee (AOR=0.81, 95% CI=0.746–0.885), average daily dose of buprenorphine MAT <12 mg vs. 12–24 mg (AOR=0.61, 95% CI=0.570–0.656), pre-index severe mental illness diagnosis (AOR=0.73, 95% CI=0.631–0.834), pre-index non-opioid drug use disorder diagnosis (AOR=0.79, 95% CI=0.726–0.852), pre-index alcohol use disorder diagnosis (AOR=0.83, 95% CI=0.737–0.926), pre-index chronic pain
Figure 2 Predictors of adherence (PDC≥0.80) among adult patients with OUD who were newly initiating buprenorphine MAT: Commercial sample.
Note: Based on logistic regression models; examination of variance inflation factors confirmed the absence of high correlation between covariates (n=16,085).
Abbreviations: CDHP, consumer-driven health plan; HDHP, high deductible health plan; HMO, health maintenance organization; M, months; MAT, medication-assisted treatment; OUD, opioid use disorder; PDC, proportion of days covered; POS, point of service plan; PPO, preferred provider organization.
Age
Female sex (vs. Male)
Spouse relationship to policyholder (vs. Employee)
Child/other relationship to policyholder (vs. Employee)
Northeast geographic region (vs. South) Northcentral geographic region (vs. South)
West geographic region (vs. South)
Rural residence (vs. Urban)
Comprehensive/Indemnity plan type (vs. EPO/PPO)
POS/POS with capitation plan type (vs. EPO/PPO)
HMO plan tpe (vs. EPO/PPO)
CDHP/HDHP plan type (vs. EPO/PPO) Pre-index alcohol use disorder diagnosis (vs. No)
0.99 (95% Cl 0.989–0.997)
0.95 (95% Cl 0.888–1.024)
0.81 (95% Cl 0.746–0.885)
0.37 (95% Cl 0.335–0.414)
1.20 (95% Cl 1.095–1.312)
0.97 (95% Cl 0.881–1.059)
0.85 (95% Cl 0.773–0.944)
1.21 (95% Cl 1.098–1.335)
0.96 (95% Cl 0.790–1.177)
1.02 (95% Cl 0.912–1.134)
0.91 (95% Cl 0.822–1.002)
0.86 (95% Cl 0.739–0.991)
0.83 (95% Cl 0.737–0.926)
0.25 0.5 0.75 1 1.25 1.5 1.75 OR
0.79 (95% Cl 0.726–0.852)
0.73 (95% Cl 0.631–0.834)
0.95 (95% Cl 0.882–1.028)
0.90 (95% Cl 0.834–0.966)
1.16 (95% Cl 0.995–1.347)
0.61 (95% Cl 0.570–0.656)
1.16 (95% Cl 0.989–1.361)
1.26 (95% CI 1.173–1.348) Pre-index non-opioid drug use disorder diagnosis (vs. No)
Pre-index severe mental illness diagnosis (vs. No)
Pre-index other mental illness diagnosis (vs. No)
Pre-index chronic pain condition diagnosis (vs. No)
Pre-index MAT other than buprenorphine MAT (vs. No)
Buprenorphine dose 6M post-index <12 mg (vs. 12–24 mg)
Buprenorphine dose 6M post-index >24 mg (vs. 12–24 mg)
Post-index psychosocial treatment (vs. No)
Substance Abuse and Rehabilitation downloaded from https://www.dovepress.com/ by 118.70.13.36 on 27-Aug-2020
Dovepress
Ronquest et al
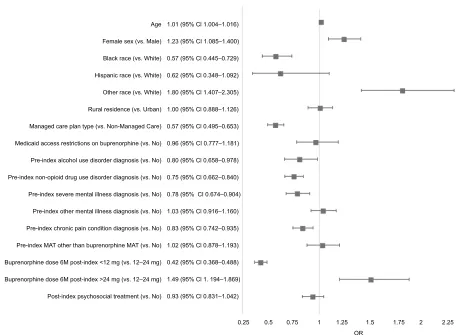
diagnosis (AOR=0.90, 95% CI 0.834–0.966) and West geo-graphic region vs. South (AOR=0.85, 95% CI=0.773–0.944). In the Medicaid sample, variables significantly associ-ated with increased odds of adherence based on logistic regression models (Figure 3) included female (AOR=1.23, 95% CI=1.085–1.400) and average daily dose of buprenor-phine MAT >24 mg vs. 12–24 mg (AOR=1.49, 95% CI=1.194–1.869). Factors significantly associated with decreased odds of PDC≥0.80 were average daily dose of buprenorphine MAT <12 mg vs. 12–24 mg (AOR=0.42, 95% CI=0.368–0.488), managed care plan type vs. non-managed care plan type (AOR=0.57, 95% CI=0.495–0.653), pre-index non-opioid drug use disorder diagnosis (AOR=0.75, 95% CI=0.662–0.840), pre-index severe mental illness diagnosis (AOR=0.78, 95% CI=0.674–0.904), pre-index chronic pain condition diagnosis (AOR=0.83, 95% CI=0.742–0.935) and pre-index alcohol use disorder diagnosis (AOR=0.80, 95% CI 0.658–0.978).
Discussion
This study assessed adherence in the 12 months following buprenorphine MAT initiation among OUD patients and found that 37% of Commercial patients and 41% of Medicaid patients were classified as adherent, based on PDC of 0.80 or above. The Commercial adherence rate is similar to the findings of two previous retrospective claims database studies utilizing a single US commercial health plan population. One study15
found that 32% of patients were adherent to buprenorphine MAT in the year following treatment initiation, while the other16 determined that 36%–43% were adherent, depending
on the adherence definition used. The Medicaid adherence rate in this study based on a multistate sample appeared higher than results from a previous analysis of data from one state Med-icaid program.17 Different adherence measures between the
two studies make direct comparison difficult, but the previous analysis found that only 21% of patients persistently refilled buprenorphine over 12 months following treatment initiation.
Figure 3 Predictors of adherence (PDC≥0.80) among adult patients with OUD who were newly initiating buprenorphine MAT: Medicaid sample.
Note: Based on logistic regression models; examination of variance inflation factors confirmed the absence of high correlation between covariates (N=5,688).
Abbreviations: M, months; MAT, medication-assisted treatment; OUD, opioid use disorder; PDC, proportion of days covered.
1.01 (95% Cl 1.004–1.016)
1.23 (95% CI 1.085–1.400)
0.57 (95% Cl 0.445–0.729)
0.62 (95% Cl 0.348–1.092)
1.80 (95% Cl 1.407–2.305)
1.00 (95% Cl 0.888–1.126)
0.57 (95% Cl 0.495–0.653)
0.96 (95% CI 0.777–1.181)
0.80 (95% Cl 0.658–0.978)
0.75 (95% Cl 0.662–0.840)
0.78 (95% CI 0.674–0.904)
1.03 (95% Cl 0.916–1.160)
0.83 (95% Cl 0.742–0.935)
1.02 (95% Cl 0.878–1.193)
0.42 (95% Cl 0.368–0.488)
1.49 (95% Cl 1. 194–1.869)
0.93 (95% Cl 0.831–1.042) Age
Female sex (vs. Male)
Black race (vs. White)
Hispanic race (vs. White)
Other race (vs. White)
Rural residence (vs. Urban)
Managed care plan type (vs. Non-Managed Care)
Medicaid access restrictions on buprenorphine (vs. No)
Pre-index alcohol use disorder diagnosis (vs. No)
Pre-index non-opioid drug use disorder diagnosis (vs. No)
Pre-index severe mental illness diagnosis (vs. No)
Pre-index other mental illness diagnosis (vs. No)
Pre-index chronic pain condition diagnosis (vs. No)
Pre-index MAT other than buprenorphine MAT (vs. No)
Buprenorphine dose 6M post-index <12 mg (vs. 12–24 mg)
Buprenorphine dose 6M post-index >24 mg (vs. 12–24 mg)
Post-index psychosocial treatment (vs. No)
OR
0.25 0.5 0.75 1 1.25 1.5 1.75 2 2.25 2.5
Substance Abuse and Rehabilitation downloaded from https://www.dovepress.com/ by 118.70.13.36 on 27-Aug-2020