R E S E A R C H
Open Access
Adding spatial distribution clue to
aggregated vector in image retrieval
Pingping Liu
1,2,3*, Zhuang Miao
1, Huili Guo
1, Yeran Wang
1and Ni Ai
1Abstract
This study proposes a novel algorithm that enhances the distinctiveness of the traditional vector of locally aggregated descriptors (VLAD) using spatial distribution clue of local features. The algorithm introduces a new method to compute the spatial distribution entropy (SDE) of clusters. Unlike conventional methods, this algorithm considers the distribution of full spatial information provided by local feature detectors rather than only utilizing the spatial coordinate statistics. For each cluster, the corresponding spatial distribution is computed using a histogram of spatial locations, scales, and orientations of all local features inside the cluster. Entropy is calculated from the spatial distributions of all clusters of an image to create a distribution function, which is further normalized and concatenated with the VLAD vector to generate the final representation. Image retrieval and classification experiments on public datasets are performed. Experimental results show that the proposed algorithms produce better or comparable retrieval performance than several state-of-the-art algorithms. In addition, we extend our SDE to the convolutional neural network (CNN) feature, which further improves the CNN feature result in image retrieval.
Keywords:Image retrieval, Vector of locally aggregated descriptors, Spatial distribution entropy, Quantization error, Normalization
1 Introduction
With the rapid development of camera and internet technology, numerous large image and video data-bases continue to increase. Searching for similar results to a query image in these large databases with high search accuracy, high efficiency, and low mem-ory usage is the main challenge in image retrieval research field. Many visual search systems are avail-able for retrieving relevant multimedia content to the query, and the most simple and direct method is rely-ing on textual label with the multimedia content. However, these systems significantly suffer from the semantic gap [1]. Content-based image retrieval (CBIR), which returns result images that share certain visual elements with the query image, was proposed to address the semantic gap problem.
Initially, the effect of CBIR was unsatisfactory. Until the early 2000s, two pioneering works considerably im-proved CBIR. The first one is the scale-invariant feature transform (SIFT) [2]. Lowe [2] proposed the feature de-tector that detects local features from an image. These features are consistent with variations, such as view-point, illumination, and other viewing conditions. The second one is the bag-of-visual-words (BoW) method [3]. The BoW descriptor represents the distribution of visual words and shows considerable distinctiveness and robustness; hence, this descriptor has been widely used in the field of CBIR. Based on these pioneering works, aggregated vector-based methods emerged, including vector quantization [3], sparse coding [4], locality-constrained linear coding [5], and soft assignment [6]. Aggregated vector-based encoding methods succeed in various image retrieval applications [3–5, 7–9]. The vector of locally aggregated descriptors (VLAD) [8] is one of the most widely adopted aggregated vector-based methods.
Nevertheless, quantization-based methods, such as BoW [3], VLAD [8], or Fisher vector (FV) [10], inevitably have a * Correspondence:[email protected]
1
College of Computer Science and Technology, Jilin University, Changchun 130012, China
2Key Laboratory of Symbolic Computation and Knowledge Engineering of
Ministry of Education, Jilin University, Changchun 130012, China Full list of author information is available at the end of the article
few drawbacks [11]. One of the most critical drawbacks is the tradeoff between quantization error and searching accuracy. In a quantization-based method, high search ac-curacy relies on an enormous vocabulary to reduce the quantization error and improve the distinctiveness of global representations. Improving the distinctiveness of the quantization-based global representation (such as VLAD [8]) is the focus of this study. Although most quantization-based global representations are quantization-based on local image descriptors (such as SIFT [2] and SURF [12]), a few important spatial relevant information of these local fea-tures are generated by the local feature detectors [13], such as coordinates, scale, orientation, or saliency of local feature points apart from the local feature descriptors. This kind of feature resource could be utilized.
The spatial relationship in an image exists between dif-ferent regions of the image; however, spatial information is always neglected due to the orderless representation of the image using quantization-based methods [14]. Although methods based on query expansion [15], soft quantization [16], and large vocabulary size [17] can en-hance the image retrieval performance, these methods lack spatial information that provides discriminating details.
Despite these improvements, most quantization-based methods do not consider the geometric relationships between local features, which strongly limit their perform-ance in large-scale image search systems. A final re-ranking step is typically performed to improve the quality of the initial ranking either by checking the geometric consistency of the matches [17–19] or providing additional information modeling the preferences or visual attention of users to overcome this limitation [20]. Such re-ranking methods are commonly used only for a subset of images because they are often computationally expen-sive and significantly increase the retrieval time.
The following three constraints should be consid-ered in large-scale image retrieval applications: search accuracy, efficiency, and memory usage [8]. In this study, we aim to boost the distinctiveness of the ag-gregated vector with additional detailed spatial infor-mation. Simultaneously, the proposed method should use low memory and be efficient for large-scale image retrieval applications. To this end, we attempt to adopt a simple yet effective mechanism. We build spatial distribution entropy (SDE) of every cluster based on the spatial information of local features and utilize it as a complementary clue to the original VLAD representation.
We provide a detailed analysis of SDE utilization to improve the original VLAD representation in image retrieval problem and describe the most appropriate configurations. In addition, we demonstrate that the SDE method can be combined with other add-ons to
the original VLAD representation applied in image retrieval.
The proposed SDE shows significant compatibility. Except for the traditional VLAD method, we attempt to combine triangulation embedding (T-embedding) and democratic aggregation [21] method with the proposed SDE. In our experiment, our SDE further improves the retrieval accuracy of T-embedding. In recent years, deep convolutional neural network (CNN) has dem-onstrated state-of-the-art performance in various tasks on image recognition and retrieval. In this study, we also inte-grate our SDE with CNN-based methods to further im-prove the retrieval accuracy.
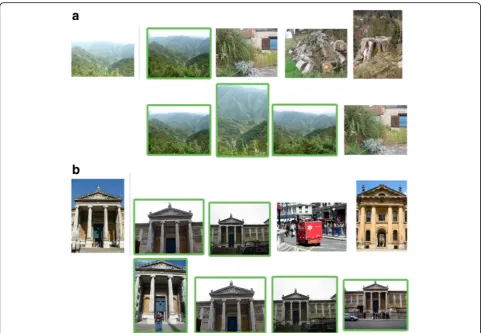
Figure 1 shows an example of image retrieval using the proposed method.
The rest of this paper is organized as follows. We first review the related work on global representation in large-scale image retrieval in Section 2. Then, we intro-duce the method of building the SDE-boosted VLAD representation and discuss the motivations in Section 3. Detailed experiments and main results are provided in Section 4 to validate the effectiveness of our proposed method. Finally, we summarize the paper with conclu-sive remarks in Section 5.
2 Related work
CBIR has been a long-standing research topic in the computer vision society. In CBIR research, images are indexed by their visual features, such as texture and color. A straightforward strategy in CBIR is to employ global representation to retrieve images that are similar to the query. Many CBIR systems are based on local fea-tures, such as SIFT [2], RootSIFT [22], and SURF, to simultaneously attain the invariance and distinctiveness [12]. Among these global image representations, BoW [3] used to be the most widely adopted method, which was first proposed in 2003 and was then applied in image classification in 2005. In BoW architecture, local features are extracted from images, and each local fea-ture is assigned to the nearest visual word computed from a pre-trained vocabulary.
Aggregated vectors, such as VLAD [8] and FV [10], are proven to be more effective than BoW in terms of efficiency and memory cost in large-scale image re-trieval. Aggregated vectors use a small-sized codebook and can be further reduced by dimension reduction while preserving excellent performance.
computation, VLAD is a common choice in many large-scale image retrieval systems. VLAD descriptor can be reduced to a small size when applied to large-scale image retrieval. PCA can be employed on aggregated vectors to achieve dimensionality reduction. In addition, the vector can be further quantized into compact codes after dimension reduction by locality-sensitive hashing (LSH) [23] and spectral hashing (SH) [24].
2.1 Visual burstiness
The existence of a few large values in the VLAD vector will weaken the role of its other components. This prob-lem is called visual burstiness. We need some processing to deal with visual burstiness in VLAD.
Notably, different local features unequally contribute to the VLAD descriptor when residuals are summed together to generate VLAD descriptors. Several normalization approaches are proposed to solve this problem [25–27]. The BoW method solves the visual burstiness by square-rooting and renormalizing the
BoW vectors [25]. Similarly, VLAD uses intra-normalization [27] to solve visual burstiness. In this method, the residuals of each centroid are L2-normalized [8] within each VLAD block. The original VLAD vector is also further power normalized [8]; then, L2-normalized [8] in the quantization stage. Intra-normalization is useful for suppressing visual burstiness while power normalization reduces the effect of large values in the descriptor, and L2 normalization facilitates a good invariance of VLAD descriptors for the number of local features. Recently, Jegou et al. [21] proposed T-embedding method, which computes the residuals between all local features and centroids. Moreover, T-embedding can suppress burstiness through “democratic” weighted aggregation [21].
2.2 Quantization effect
In the image retrieval process, using different data-sets for training the codebook will produce different
results. Arandjelovi´c [27] proposed cluster adapta-tion mechanism to improve retrieval performance when the cluster centers used for VLAD are incon-sistent with the training dataset. The adapted cluster center is the mean of all local features in the data-sets assigned to the original cluster center. This method can reduce the sensitivity of changing the training sets or real-world large-scale retrieval where images are added to the database with time.
2.3 Fine-grained quantization
The size of the codebook plays an important role in aggregating the local features. Generally, a large codebook leads to a high retrieval accuracy. However, a large codebook will lead to a consider-able time overhead and take up additional storage space. Hence, the codebook size should be small in large-scale image retrieval. The codebook size in VLAD is very small; hence, VLAD produces a multi-dimensional residual vector for each cluster center to preserve the retrieval accuracy. In other studies, Liu et al. [28] and Liu et al. [29] proposed methods of multiple clustering. Although small-sized code-books lead to quantization error, the multiple clus-tering method can reduce the quantization error by providing a detailed division of the local features based on the original assignment. Wang et al. [30] proposed a hierarchical quantization method, which uses a tree structure to significantly increase the computing speed when VLAD descriptors are gener-ated using a large codebook.
2.4 Additional improvements for image descriptors
2.4.1 Reduce visual burstiness and quantization error
The residuals in VLAD describe the distance between the local feature points and the cluster centroids. Moreover, the local features have other useful informa-tion. Peng et al. [11] proposed an improved VLAD by adding shape and skewness information of each cluster to the original VLAD. The improved descriptor is called H-VLAD*. This method achieves higher retrieval accur-acy but requires a descriptor that is two to three times the size of the original VLAD. H-VLAD* [11] is time-consuming for large-scale image retrieval. Fine-residual VLAD [29] and VLAD+intra+adapt [27] proposed their solutions for visual burstiness and quantization error. Zhou et al. [31] proposed a method of calculating the distribution entropy for the features in each cluster. The distribution entropy can be concatenated with VLAD to obtain a double-sized VLAD descriptor, or it can be fused with the original VLAD without increasing the length of descriptors. Adding distribution entropy is ef-fective for improving image retrieval accuracy.
2.4.2 Spatial information
Many methods use spatial information as a supple-ment to the descriptor. Mehmood et al. [32] proposed a combination of local and global histograms based on BoW [3] descriptors. BoW [3] computes a global histogram of visual words. Mehmood et al. [32] constructed local histogram over the local rectangular region of the image. Local histogram provides a de-tailed statistics on visual vocabulary. The combination of local and global histograms agrees well with BoW [3]. Compared with our SDEVLAD, Mehmood et al. [32] did not use additional sources to enhance retrieval accuracy, and SDEVLAD shows better scalability. Krapac et al. [33] introduced an extension of BoW [3] image representations to encode spatial layout which improves the result of image categorization. Krapac et al. [33] also computed the spatial mean and variance of clusters using the Fisher kernel. The spatial layout is combined with the Fisher kernel after being processed by the Gaussian mixture model. In addition, the coordinates of the local feature are used in the calculation of spatial layout. Notably, the descriptor of [33] is large. Koniusz et al. [34] leveraged spatial coordinate coding to simplify the representation of spatial pyramid in object cat-egory recognition. Koniusz et al. [34] also changed the way of introducing spatial information during the formation of histograms to provide a compact and effective representation. This change further improved the performance of soft assignment in the classifica-tion process. Sánchezet et al. [35] improved the result of object classification based on FV. For the variance due to the limits of local statistics and the variation in the proportion of object-dependent information, Sánchezet al. [35] proposed to augment the descrip-tors with their spatial locations and create a bounding box for the local features. In our proposed method SDEVLAD, we use entropy to describe the spatial distribution. SDEVLAD is very compact and shows large scalability in our experiment. A detailed analysis of SDEVLAD will be provided in Section 3.
2.4.3 CNN-based methods
the final compact descriptor of the image. Gong et al. [40] proposed a method of combining CNN fea-tures of different scales. They used the CNN feafea-tures from different scales to calculate the residual vectors and eventually combined them to produce the final representation. The combination of VLAD and CNN [36] enhances the potential of the VLAD-based approach.
2.5 Joint dimension reduction
In large-scale retrieval application, high-dimensional global image representations are often dimensionally reduced to short image representations by PCA, which can be further encoded in compact codes using binarization or product quantization techniques. Jegou and Chumstudy [41] investigated the effects of PCA on BoW and VLAD representa-tions and advocated joint dimensionality reduction with multiple vocabularies to reduce quantization artifacts. Subsequently, Radenovicet et al. [42] ex-perimentally showed that generating diverse multiple vocabularies has crucial effects on search perform-ance. Moreover, each of the multiple vocabularies was learned on local feature descriptors obtained with varying parameter settings.
3 Proposed method
3.1 Spatial information of local descriptor
Image representation is one of the key issues for large-scale image retrieval applications. Popular global image representations, such as BoW [3], VLAD [8], and FV [10], are all based on local features (e.g., SIFT [2]). In general, three main steps are followed to build compact image representations: (1) feature extraction, (2) embed-ding, and (3) aggregation. The feature extraction output is a set of local image features, and each descriptor of the local features is mapped into a high-dimensional vector, which is called embedding. In the last step, all the embedded vectors of an image are integrated into a single vector. Clearly, the starting point of this flow is the set of local feature descriptors extracted in the fea-ture extraction step.
Local feature extraction always comprises two main stages: feature detection and feature description [43]. Local feature detector detects points or regions covariant with a class of transformations, and local feature description selects the most appropriate descriptor to characterize the points or regions. The most widely used feature detectors are Harris–Laplacian [13], Hessian–Laplacian [13], DoG [44], Harris affine [13, 45], Hessian affine [13], and MSER [46]. Meanwhile, the most popular local feature descriptors are SIFT [2] and SURF [12]. Therefore, the complete local image fea-ture should include two parts of information as
follows: feature detector output, which is always de-noted as location, scale, orientation, saliency, and shape parameters; and feature descriptors, which are often recorded in high-dimensional vectors, such as 128-dimensional SIFT descriptors. In most CBIR sys-tems, global image representations (such as BoW [3], VLAD [8], and FV [10]) are based on local image de-scriptors, whereas the output of the feature detector information is ignored. In this study, we attempt to leverage the spatial information provided by the local feature detector to build a more discriminative global image representation compared with the original ag-gregated vectors.
In CBIR systems, the Hessian-affine detector [13] is the most adopted local feature detector due to its performance. The Hessian-affine detector is an affine-invariant region detector, and its main steps include initial region detector with Hessian matrix and auto-matic characteristic scale selection, shape estimation with the second moment matrix, and affine region normalization to the circular one. The typical outputs of the Hessian-affine detector include location and affine region parameters. However, the scale and orientation of the location can also be detected with the main results.
3.2 SDE
We attempt to find a simple but effective way of in-tegrating spatial information of local features to the final global image representation to improve the dis-tinctiveness of the representation. In our previous work [31], we attempted to add distribution entropy of descriptors in each cluster to the VLAD vector, and the results proved its feasibility. One drawback of this approach is the high-dimensional vector and complexity burden due to the generation with 128-dimensional SIFT descriptors within each cluster. However, this shortcoming inspires us to utilize distribution entropy as a complementary clue to the original image representation to improve retrieval performance.
The entropy of a relative frequency distribution is a useful measure of dispersion for ordinal and nominal data. Entropy is calculated using the following for-mula [47]:
H¼−Xki¼1pilnðpiÞ;
whereH is the entropy of distribution, kis the number of possible outcomes, and pi is the relative frequency of
theith outcome.
information of local features in CBIR applications is gen-erated by the Hessian-affine detector. The detective scale is simultaneously generated with the spatial coordinate. Furthermore, the orientation attributes of the local features are provided in most popular large-scale image retrieval datasets, such as Holidays [19] and Oxfor5K [17]. From these geometric files, spatial coordinates and scale and orientation must be jointly used to differenti-ate local features. Therefore, we select the spatial coord-inate (Lx, Ly), scale σ , and orientation θ together to
build the SDE.
After the quantization stage in the original VLAD algorithm, every SIFT descriptor is assigned to a clus-ter cenclus-ter (visual word) μi. Herein, we introduce the
SDE in each cluster as follows: considering an input image of size H × W pixels, the biggest scale of all local features is σ∗, and the biggest orientation of all local features is θ∗.
First, a set of SIFT descriptors Xi= {xi1,……xin} is
assigned toμi, and the SDE is built on the spatial clue of
these local features.
From the preceding discussion, the spatial clue of every local feature could be denoted as (Lx, Ly, σ, θ),
whereLxand Lyrepresent the spatial coordinate, σ
rep-resents the scale, and θ represents the orientation. A 4-dimensional spatial histogram is built with this spatial information.
The 4-dimensional spatial histogram on a spatial grid G is as follows:
h¼fh mð ;n;t;sÞj1≤m≤M;1≤n≤N;1≤t≤T;1≤s≤Sg;
where h(m,n,t,s) is the number of local feature occur-rences in the spatial grid located on the image region of
m−1 ð ÞH
M;mMH
ðn−1ÞWN;nWNðt−1ÞσT;tσT ðs−1Þθs;sθs. The total number of the grids on the 4-dimensional histogram isMNTS.
Second, the probability density of clusterμican be
fur-ther computed as follows:
p mð ;n;t;sÞ ¼h mð ;n;t;sÞ=XMm¼1XNn¼1XTt¼1XSs¼1
h mð ;n;t;sÞ:
Using the 4-dimensional spatial histogram h and the probability density p, the entropy measure Ei of cluster
μiis computed as follows:
Ei¼−
XM
m¼1
XN
n¼1
XT
t¼1
XS
s¼1p mð ;n;t;sÞ
lnðp mð ;n;t;sÞÞ:
Hence, spatial entropy Ei for cluster μi is generated.
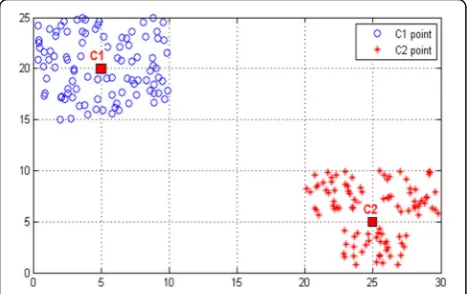
Figure 2 shows an example to describe the advantage of SDE and intuitively demonstrate its role. Herein, we only use the coordinate information of local feature points because the coordinates are suitable for demonstration in the figure. In Fig. 2, the local feature points are quan-tized into two clusters, C1 and C2 are the centroids. Evidently, the distribution of the clusters is different. However, these clusters may share the same residuals, which represent the distance between the points and cluster centers. SDE will lead to different C1 and C2; hence, we added SDE to the original residual vector as a complementary clue.
3.3 Adding SDE to VLAD representation
VLAD is a feature descriptor that aggregates the local fea-tures of an image. VLAD uses a dictionary to aggregate local features, and the local features extracted from the image are partitioned to the nearest cluster by computing the Euclidean distance. For VLAD algorithm, each local feature is used to obtain the residual vector with the cor-responding cluster, and the residuals of each cluster are summed up to generate a VLAD descriptor. The calcula-tion process is shown as follows, wherexjis the local
fea-ture assigned toμi according to their Euclidean distance,
andinis the number of local descriptors belonging to the ith cluster:
Vi¼
Xin
j¼1
xj−μi:
Such a VLAD representation can be discriminatory. Although the distribution of their local features is differ-ent, directly adding residuals will lead to different clusters share similar residual vectors. We use the 4-dimensional spatial information of the local feature to compute our SDE to describe the spatial distribution of all the local features assigned to each cluster and provide a discriminative VLAD descriptor.
In the original VLAD workflow [8], a fixed-length vec-tor representation V from a set of local D-dimensional descriptors are produced. Similar to BoW [3], if a pre-trained visual dictionary is used, then the size of V would be K∗D. The residual vector Vi of cluster μi
would be D-dimensional similar to the local features. When adding SDE to VLAD representation, the simplest method is to concatenate residual vector and SDE vector as follows:
EVi¼½Vi;Ei j 1≤i≤K:
As previously discussed, Ei vector would be one-dimensional, and the final EV representation would be K∗(D+ 1)-dimensional.
Although direct concatenation can fuse the two types of vectors to enhance the discrimination of the final presentation, a few adjustments are still necessary. As the VLAD vector could adopt different kinds of normalization stages [8, 26, 27] to deal with the visual burstiness problem and further improve the retrieval performance, we adopt a similar method for the SDE vector before its fusion with the VLAD vector, which is called difference normalization [31]:
Ei¼jexpð ÞEi jε:
The VLAD vector is also residual normalized [26] and intra-normalized [27] before fusion with entropy vector. After the fusion, the EV vector is further power-normalized [8] and L2-power-normalized [8] to generate the final representation.
3.4 Adaptation and LCS
In our experiment, we also apply a few other improve-ments to generate the final representation, such as adap-tation and local coordinate system.
3.4.1 Adaptation [27]
After quantization using K-means, we can obtain the clusters of the images and identify which cluster a local feature belongs to through the algorithm of the nearest neighbors. On these bases, we use all the features assigned to a cluster to obtain their mean value which represents their geometric center. We use this geometric center rather than the original cluster.
3.4.2 LCS [22]
The LCS provides a method of training a rotation matrix for each cluster. LCS could be understood as locally performed PCA. For each word in the vocabulary, a rotation matrix will be formed by the corresponding eigenvectors. These pre-trained rotation matrices will be applied to the VLAD descriptor formation. Then, a
VLAD vector with residual normalization [26] and LCS is generated as follows:
Vi¼
Xin
j¼1RLCS
xj−μi xj
−μik:
RLCSis the rotation matrix corresponding to clusterμi.
3.5 Computation process of SDEVLAD
Herein, we holistically describe SDEVLAD. The proposed SDEVLAD is a combination of the preced-ing methods described. Algorithm 1 clearly presents the computation process of SDEVLAD. This algo-rithm has four input elements, where S represents the set of local features, R is the rotation matrix in LCS corresponding to centroids C, and SD is the spatial information of local features. In Algorithm 1, we first assign local features to the nearest centroid. We assign the spatial information to each centroid according to the assignment of local features. Then, we use the spatial information (SSD) of each centroid to compute the entropy Ei and
concatenated with VLAD after power normalization [8] and L2 normalization [8].
3.6 Complexity analysis
Our method calculates the distribution entropy of spatial information in the range covered by each cluster center; that is, the dimension of SDE is equal to the number of cluster centersKfor an image. We separately divide the 4-dimensional spatial information of the feature points into M, N,T, andS parts. If we useBto denote the bin amount of 4-dimensional spatial histogram, then B should also be equal toM∗N∗T∗S. The preceding dis-cussion clearly indicates that the computation complex-ity of the spatial entropy generation part is O(K*D*B), whereKis the size of vocabulary,Dis the dimension of local features, and B is the product of M, N, T, and S. Finding the most appropriate parameter M, N,T, and S to attain the best performance will be discussed in the parameter analysis part.
The dimension of the descriptor for the original VLAD is the dimension D of the SIFT multiplied by the number of clusters K, and the dimension of SDEVLAD is (D + 1) * K. Adding SDE to the VLAD descriptor only deals with the additional K-dimensional data, and the workload is close to that of the original VLAD.
3.7 Parameter analysis
In this section, the main parameters of the proposed method are analyzed on the Holidays dataset. The com-plexity analysis clearly shows that the BIN amountB of spatial information, which is equal to M∗N∗T∗S, is important in SDE computation. On the one hand, increasing B can facilitate an accurate expression of spatial information. On the other hand, ifBis extremely large, then the spatial information distribution will be extremely sparse.
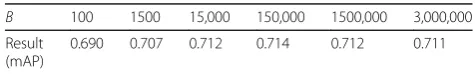
Table 1 shows the results of our test on B of SDE. Herein, we set M∗N∗T∗S to different ranges of values. The distribution of the scale and orientation is similar, and the case is similar for the two dimensions of coordinates. Therefore, we set M = N and S = T. We also maintain the value of M and N to be larger than the value of S and T in that the values of coor-dinates are more extensive. In the preceding discus-sion, the result should increase from a small value as the value of M∗N∗T∗S increases, reaches a max-imum point, and then decreases. As shown in Table 1, the result significantly improves when we increaseBfrom 100. When the value of Bbecomes extremely large (after
150,000), the result begins to decrease. Restricted by our minitype server, we did not provide the results whenBis larger than 3,000,000. In Table 1, the retrieval accuracy reaches the maximum withM∗N∗T∗Sequal to 150,000. Then, we make a slight adjustment onM,N,T, andSwith M∗N∗T∗S approximately at 150,000. Finally, we setM, Nto 25 andS,Tto 16.
3.8 Datasets
Experiments are conducted on the following widely used benchmark collections for image retrieval.
INRIA Holidays [19] is a dataset comprising 1491 high-resolution personal holiday photos of different lo-cations and objects, 500 of which are used as queries. The collection includes a large variety of scene types (natural, manmade, water, and fire effects). The search quality is measured by mAP, with the query removed from the ranked list.
Oxford5k Buildings [17] contains 5062 images down-loaded from Flickr and is often referred to as Oxford 5K. A total of 55 queries are specified by an image and a rectangular region of interest, and the accuracy is mea-sured by mAP.
In training sets for Holiday and Oxford5K, we use Flickr60k [19] and Paris datasets [16] as vocabulary training sets, respectively.
We use Holidays to evaluate the performance of large-scale image retrieval. We add one million im-ages collected from Flickr, which are referred to as Flickr1M [19], to the original Holiday dataset.
4 Results and discussion
4.1 Full-size representation comparison
In this section, we separately tested SDEVLAD on Holidays [19] and Oxford [17] datasets. We first apply the root op-tion to the SIFT [22] and then the adaptaop-tion and LCS im-provements. We found that the combination of power [8] and L2 normalization [8] is an excellent choice to perform the normalization for VLAD representation. Herein, we use 64 clusters to generate our VLAD and SDEVLAD representation.
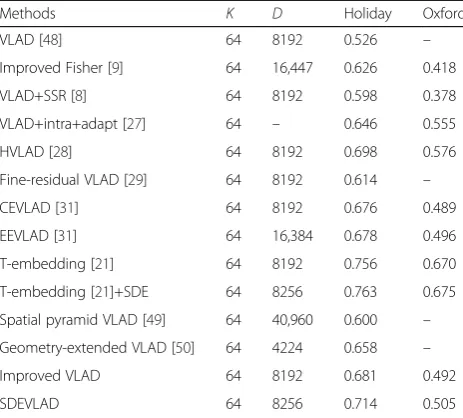
VLAD and FV express the distribution of local fea-tures. VLAD descriptor is a simplified non-probabilistic version of the FV. Improved Fisher [9] proposes a normalization procedure and a binarization strategy to provide a suitable FV for retrieval. The result of the im-proved Fisher [9] is 0.626(mAP), which is better than the VLAD result of 0.526. VLAD has improved scalability. Table 2 shows many improvement methods for VLAD. Among the improved methods, VLAD+SSR [8] obtains 0.598 and 0.378 for Holiday and Oxford, respectively. The method fine-residual VLAD [29] for quantifying the residual of VLAD obtains 0.614 on Holidays. VLAD +intra+adapt [27] achieves 0.646 on Holidays. These
Table 1The influence ofBon retrieval accuracy
B 100 1500 15,000 150,000 1500,000 3,000,000
Result (mAP)
methods mainly propose their solutions for visual bursti-ness and quantization error. In our proposed method, the clusters are precisely adjusted, the descriptors are normal-ized in the production process, and a decorrelation step is performed on local features through the LCS [22]. These operations are effective in reducing visual burstiness and quantization error. Simultaneously, our SDE provides a dis-tinguishable SDEVLAD using spatial information. Finally, our SDEVLAD achieves 0.714(mAP) on Holidays and 0.505(mAP) on Oxford.
Notably, the result of the VLAD+intra+adapt [27] method on Oxford is 0.555 and the result of the HVLAD [28] method on Oxford is 0.567, which are better than the SDEVLAD result of 0.505 on Oxford. For the VLAD+intra+adapt [27] method, the image de-scriptor is of medium dimensionality (20 to 32 k-dimen-sional), which is larger than the SDEVLAD dimension of 8256. HVLAD [28] combines hierarchical VLAD with a few other improvement methods, such as multiple as-signment [28], thereby allowing HVLAD to exceed the SDEVLAD result on Oxford. However, the SDEVLAD result of 0.714 on Holidays is still better than the 0.698 of HVLAD. CEVLAD [31] and EEVLAD [31] calculate the distribution entropy value based on the VLAD [48] vector. CEVLAD [31] and EEVLAD [31] obtain 0.676(mAP) and 0.678(mAP) on Holidays, respectively, while SDEVLAD achieves 0.714(mAP). Compared with our local spatial information-based distribution entropy, our SDE obtains better results.
In our experiments, we prefer to add improvements based on the VLAD method because VLAD is compact and extensible. T-embedding and democratic aggregation [21] method achieves 0.756(mAP) on Holidays in our
experiment, which is better than the result of SDEVLAD. Hence, we also attempted the combination of SDE with T-embedding descriptors. Our SDE further increases the re-sult of T-embedding [21] on Holidays to 0.763(mAP) and shows considerable compatibility. Compared with SDEV-LAD, T-embedding [21] achieves better results on Holidays and Oxford. However, the computation of T-embedding [21] is complicated. And T-embedding did not obtain a sat-isfying result when reduced to 128-dimensional compared with SDEVLAD in [21].
In Table 2, we obtain 0.681(mAP) and 0.492(mAP) on Holidays and Oxford, respectively, through the improved VLAD. The improved VLAD is similar to SDEVLAD but without the SDE. Adding SDE improves the results to 0.714(mAP) and 0.505(mAP) on Holidays and Oxford, respectively.
We also provide other methods that employ spatial in-formation for comparison. Spatial pyramid VLAD [49] repeatedly subdivides the image into subregions, and each division forms one layer of the pyramid. This method mainly considers the similarity of local regions between the images. VLFeat [50] provides the geometry-extended VLAD method, which directly concatenates local features with their location information after normalization. Geometry-extended VLAD involves loca-tion informaloca-tion in the calculaloca-tion of the residual vector to describe the distribution of local features. For image retrieval task on Holidays, the spatial pyramid VLAD [49] achieves 0.600(mAP), the geometry-extended VLAD achieves 0.658(mAP), and the result of our SDEVLAD is 0.714(mAP). Compared with the spatial pyramid VLAD, SDEVLAD provides a more refined calculation for all the local features. Geometry-extended VLAD directly concatenates location information with local features. In our SDEVLAD, we use the spatial information to com-pute the spatial entropy which has improved stability. In recent years, CNN-based methods have performed well in image retrieval and recognition tasks. The combin-ation of spatial informcombin-ation with CNN features will be discussed in subsequent chapters.
In addition, we divide our method into three parts to specifically determine the effect of our method: (1) intra-normalization and centroid adaptation, (2) residual normalization and LCS, and (3) SDE. The gradual addition of these parts together will result in 0.622(mAP), 0.681(mAP), and 0.714(mAP) on Holidays dataset. The SDE significantly improves the retrieval accuracy. We also tested the time spent on full-size SDEVLAD descriptors on Holidays dataset. Obtaining one SDEVLAD descriptor of the Holidays dataset takes 0.162 s on average when our procedure is run on the minitype server with 12 labs. Of the 0.162 s, 0.086 s is used to compute the SDE. Our SDEVLAD significantly improved the result by adding
Table 2Image retrieval task on Holidays and Oxford for full-size representation comparison
Methods K D Holiday Oxford
VLAD [48] 64 8192 0.526 –
Improved Fisher [9] 64 16,447 0.626 0.418
VLAD+SSR [8] 64 8192 0.598 0.378
VLAD+intra+adapt [27] 64 – 0.646 0.555
HVLAD [28] 64 8192 0.698 0.576
Fine-residual VLAD [29] 64 8192 0.614 –
CEVLAD [31] 64 8192 0.676 0.489
EEVLAD [31] 64 16,384 0.678 0.496
T-embedding [21] 64 8192 0.756 0.670
T-embedding [21]+SDE 64 8256 0.763 0.675
Spatial pyramid VLAD [49] 64 40,960 0.600 –
Geometry-extended VLAD [50] 64 4224 0.658 –
Improved VLAD 64 8192 0.681 0.492
spatial information to VLAD. The coordinates, scale, and orientation of local features are used to compute a 4-dimensional SDE. In our test, we spend twice the time for VLAD descriptor computation to obtain an SDEVLAD. The difference of the time spent can be further reduced when a large server is used.
4.2 Compact-size representation comparison (128-dimensional)
In this section, we use PCA to reduce the VLAD repre-sentation to 128-dimensional to measure the perform-ance of compact representation of our proposed method. The calculation method of VLAD is still the same as that in Section 4.1.
The VLAD vector can be reduced to a very compact vector expression by PCA. In addition to the general PCA, several other methods are used to further improve the search accuracy, such as the application combining PCA with the L2 normalization [8] used before the PCA projection. The three steps of the PCA are appropriately used [41], and the main processes are described below. After calculating the VLAD vector, we first need to center the VLAD vector, that is, subtract the mean of these vectors and then calculate the eigenvalues and eigenvectors of the VLAD. Then, 128 of the eigenvalues and their corresponding eigenvectors are used to reduce the VLAD representation.
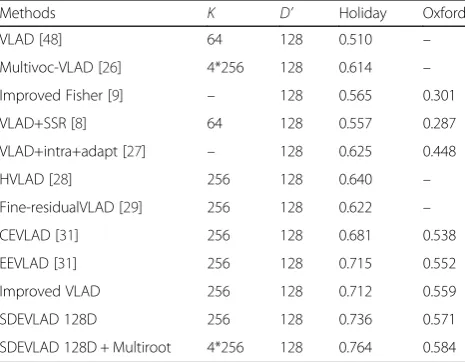
Table 3 shows the results of 128-dimensional compact VLAD on Holidays and Oxford, and the VLAD is gener-ated using 256 clusters. In addition, another joint dimen-sionality reduction method called Multiroot [42] is used in this experiment. The original SIFT and the RootSIFT with parameters 0.4, 0.5, and 0.6 are used to compute the VLAD. These methods are merged and then reduced to
128-dimensional. This approach is similar to Multivoc [41]. The Multivoc method generates multiple VLAD rep-resentations by multiple quantizations, and then, the PCA method is performed to filter duplicate parts to obtain additional useful information. The VLAD representation obtained from the Multivoc is somewhat repetitive. However, if we use RootSIFT features with different parameters, then repetitiveness can be reduced, and the compact VLAD representation will contain additional use-ful information.
Table 3 indicates that the compact-size SDEVLAD can yield an evident performance gain. On the Holidays dataset, the best result of the method without adding the distribution entropy is HVLAD for 0.640(mAP). VLAD [48] achieves 0.510(mAP) when K is assigned to 64, and Multivoc-VLAD [26] achieves 0.614(mAP) using four codebooks of 256 centroids. Our method reached 0.736(mAP) in the absence of multiple assignment method [28]. The result can also be further improved to 0.764 with Multiroot. T-embedding and democratic aggregation [21] obtain 0.72(mAP) and 0.615(mAP) when reduced to 1024 and 128 in [21], respectively. CEVLAD and EEVLAD obtain 0.681 and 0.715 on Holidays, respectively. Our method achieves 0.736, which is better than EEVLAD and CEVLAD. The two types of entropy are added based on the VLAD repre-sentation, while SDE is calculated based on the spatial information of local features. The spatial information is of high distinguishability; hence, SDE obtains a better re-sult than EEVLAD and CEVLAD. In addition, improved VLAD achieves 0.712(mAP) on Holidays. Improved VLAD is similar to SDEVLAD but without the SDE. Adding SDE improves the result to 0.736(mAP), which further validates the effect of our SDE. Similar findings could be obtained from the results of Oxford.
4.3 Large-scale retrieval (Flickr1M)
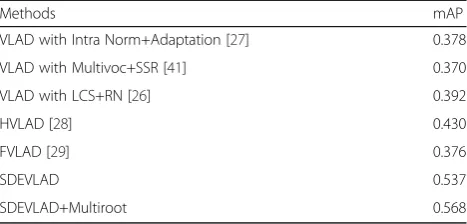
In this section, we examine the extensibility of SDEVLAD by combining Flickr1M as an interference with the Holidays dataset. We still use the method in Section 4.2 to calculate the VLAD descriptor of Holidays and Flickr1M dataset. First, we use the method of Section 4.1 to compute the full-size VLAD descriptor for Holidays and Flickr1M. Then, the Multiroot [42] is used to obtain the 128-dimensional VLAD. We combine the VLAD descrip-tor of Holidays and Flickr1M to calculate the retrieval accuracy. In addition, we use 256 clusters trained from Flickr60k and the Multiroot joint dimensionality reduction to reduce the VLAD repre-sentation to 128 dimensions. Finally, Table 4 shows the results. Compared to the best performance of other methods in large-scale image retrieval applica-tion which achieves 0.430 [28], the proposed
Table 3SIFT descriptor results of image retrieval task on Holidays and Oxford for compact-size representation comparison
Methods K D’ Holiday Oxford
VLAD [48] 64 128 0.510 –
Multivoc-VLAD [26] 4*256 128 0.614 –
Improved Fisher [9] – 128 0.565 0.301
VLAD+SSR [8] 64 128 0.557 0.287
VLAD+intra+adapt [27] – 128 0.625 0.448
HVLAD [28] 256 128 0.640 –
Fine-residualVLAD [29] 256 128 0.622 –
CEVLAD [31] 256 128 0.681 0.538
EEVLAD [31] 256 128 0.715 0.552
Improved VLAD 256 128 0.712 0.559
SDEVLAD 128D 256 128 0.736 0.571
SDEVLAD achieves 0.537, and the result can be fur-ther improved to 0.568 by Multiroot [42]. Our SDEVLAD also shows excellent extensibility.
4.4 Image classification
SDEVLAD is also effective in the image classification ex-periment on PASCAL VOC2007 dataset [51]. Nearly 10,000 images of 20 categories are present in PASCAL VOC2007. In this task, recognizing objects in the pictures and assigning them to different categories are necessary. The result is represented by the mean of aver-age precision (mAP) over 20 categories.
The image classification approach is provided by the VLFeat toolbox [50]. We densely extract local features at nine different scales. In this case, the number of local features in an image is enormous. Hence, we use a subset of 5 K SIFT descriptors to obtain a vocabulary with 256 centroids. Then, the computing process of SDEVLAD is similar to that in Section 3.5. In addition, our image classification method adopted another way of extracting local tures in image retrieval. The number of local fea-tures increases, while only nine values are available for the scale of local feature points in our image classification. The change of scale is extremely smaller than the coordinates of local feature points, and the case is similar in the orientation values. In this case, directly computing a 4-dimensional SDE will lead to excessive time overhead. Therefore, we slightly adjust our SDEVLAD for image classification to partly utilize the scale and orientation information of the local features. First, we compute the coordin-ate distribution entropy for each cluster using the coordinate information of local features assigned to the clusters. Then, we use the scale and orientation information of all local features in an image to compute the scale and orientation distribution entropy for the entire image. Finally, we concatenate the K-dimensional coordinate distribution entropy with the 1-dimensional
scale and orientation distribution entropy to obtain our improved SDE for image classification.
Table 5 shows that our method improves the classifi-cation result of VLAD from 0.5601 to 0.5804. Our SDEVLAD also achieves a better result than CEVLAD (0.5665) and EEVLAD (0.5714) from a recent work in [31], which computes the distribution entropy of VLAD vector. In addition, improved VLAD, which is similar to SDEVLAD but without the SDE, achieves 0.5580. Adding SDE improves the result to 0.5804, which further validates the effect of our SDE. In conclusion, our SDEVLAD is effective for image classification.
4.5 Image retrieval based on CNN features
In the previous experiments, we demonstrated that our SDE can be fused with the VLAD descriptors to further improve the accuracy of image retrieval. These descriptors were generated based on SIFT features. In recent years, CNN features have achieved outstanding performance in image retrieval, classification, and recognition. In addition, a few methods are available to generate VLAD descriptors using CNN features. Hence, we can further integrate our SDE with these CNN-based methods. In this section, we use the MOP-CNN [40] and NetVLAD [39] methods to com-bine with our SDE.
4.5.1 Mop-CNN [40]
In this section, we attempt to combine the SDE with MOP-CNN [40] features. In the previous chapters, we have introduced a method called Multiroot [42], which combines the descriptors obtained using differ-ent parameters to obtain an improved descriptive descriptor. Similar to Multiroot [42], MOP-CNN [40] extracts CNN features from different scales and sub-sequently combines them after further processing. The processing of CNN features is a procedure of re-sidual vector calculation. CNN features are assigned to different cluster centers, and residuals of each clus-ter cenclus-ter are then accumulated. In our experiment, the descriptors of each image are 50,000 dimensions and are then reduced to 4096 dimensions by PCA. Table 6 shows the results. In MOP-CNN [40], CNN features of patch sizes 128 and 64 are used to obtain the VLAD descriptor. Moreover, the CNN features of
Table 5Results of image classification task
Methods mAP
VLAD 0.5601
CEVLAD [31] 0.5665
EEVLAD [31] 0.5714
Improved VLAD 0.5580
SDEVLAD 0.5804
Table 4Comparison of 128-dimensional results in large-scale image retrieval on Holidays with Flickr1M
Methods mAP
VLAD with Intra Norm+Adaptation [27] 0.378
VLAD with Multivoc+SSR [41] 0.370
VLAD with LCS+RN [26] 0.392
HVLAD [28] 0.430
FVLAD [29] 0.376
SDEVLAD 0.537
patch size 256 are directly concatenated with the VLAD descriptors generated from patch sizes 64 and 128. Our SDE is generated in the VLAD calculation. Hence, we only add SDE on patch sizes 128 and 64. When the patch size is 64, our SDE improves the re-sult from 0.7633 to 0.7657. When the patch size is set to 128, our SDE improves the result from 0.7686 to 0.7708. When descriptors of three different patch sizes are combined, such combination is imperfect because the features of patch size 256 were not processed through VLAD. However, our SDE still improves the result from 0.7906 to 0.7958, and the result of combining three different patch sizes in [40] is 0.7882. The SDE further improves the results of MOP-CNN [40].
4.5.2 NetVLAD
NetVLAD [39] was originally designed for place recogni-tion. NetVLAD mimics the standard image retrieval pipeline to provide robustness for translation and partial occlusion. Arandjelovic et al. [39] proposed the trainable CNN architecture the main component of which is a new generalized VLAD layer. This architecture uses CNN to extract dense descriptors from images. A new pooling layer similar to VLAD is added at the end of this architecture. The VLAD layer aggregates CNN features to obtain VLAD descriptors. The architecture of NetV-LAD [39] is also effective for image retrieval tasks. In previous experiments, we use the SDE to describe the distribution of local features during aggregation. In the VLAD layer of NetVLAD [39], we also use SDE to de-scribe the distribution of local features. The SDE is com-bined with original VLAD descriptors. In experiments, the descriptors are reduced to 256-dimensional by PCA, and the vocabulary size (K) is set to 64. The retrieval accuracy of NetVLAD [39] is 0.821(mAP) on original Holidays dataset. As shown in Table 7, SDE improves the result to 0.864(mAP). SDE increases the distinguish-ability of NetVLAD descriptors.
5 Conclusions
In this paper, we propose the method of adding SDE to VLAD representation. The original VLAD method is represented by calculating the residuals between the centroids and the local feature points. The local features with different coordinates, scales, or orientations may share a similar residual vector through this way. Taking less account of the differences of spatial information be-tween local features will lead to incorrect matches. Compared to original VLAD, our SDEVLAD descriptor only add K dimensions where K is the number of the clusters. And in the course of experiment, we have tried to integrate SDEVLAD with many other improvement of VLAD most of which get better results when com-bined with our SDE.
In this paper, SDE uses the coordinate, scale, and orientation information of the feature points and obtains a good result. So, we could try to find more distinctive information of the feature points, and we can use the information to calculate another multi-dimensional distribution entropy. The current SDE is the distribution of spatial information in the area cov-ered by each cluster, and we can also try to divide the image into several regions by other methods to get a more suitable way for representing the spatial information of feature points. In Section 4.5, we use the MOP-CNN [40] and NetVLAD [39] methods to combine with our spatial distribution entropy. With the development of CNN, we will explore different ways to combine spatial distribution entropy with CNN features to make SDEVLAD improved.
Acknowledgements Not applicable.
Funding
This work was supported by the Jilin Province Science and Technology Development Program under grant no. 20150520063JH, the Nature Science Foundation of China under grant no. 61101155, and the General Financial Grant from China Postdoctoral Science Foundation under grant no. 2015M571363.
Availability of data and materials
The data used in this paper was obtained through our rigorous experiment. Our data is available.
About the authors
Pingping Liu is an associate professor in the Computer Science and Technology College of Jilin University. She received her bachelor’s degree from Jilin University in 2001 and her master’s degree and doctor’s degree in 2004 and 2009, respectively. Zhuang Miao, Huili Guo, Yeran Wang, and Ni Ai are postgraduates of Computer Science and Technology College from Jilin University.
Authors’contributions
PL conceived our SDEVLAD method, wrote this article, and guided our work throughout the process. ZM finished the combination of our method with VLAD and completed the revision of the paper. HG, YW, and NA validated the results. All authors read and approved the final manuscript.
Table 7Result of NetVLAD [39]+SDE on Holidays
K Dimension NetVLAD [39] NetVLAD [39] +SDE
64 256 0.821 0.864
Table 6Results of MOP-CNN [40]+SDE on Holidays
Patch size D MOP-CNN [40] MOP-CNN [40]+SDE
128 4096 0.7686 0.7708
64 4096 0.7633 0.7657
Ethics approval and consent to participate Not applicable.
Consent for publication Not applicable.
Competing interests
The authors declare that they have no competing interests.
Publisher’s Note
Springer Nature remains neutral with regard to jurisdictional claims in published maps and institutional affiliations.
Author details
1College of Computer Science and Technology, Jilin University, Changchun
130012, China.2Key Laboratory of Symbolic Computation and Knowledge Engineering of Ministry of Education, Jilin University, Changchun 130012, China.3School of Mechanical Science and Engineering, Jilin University, Changchun 130025, China.
Received: 23 March 2017 Accepted: 10 January 2018
References
1. S AWM, M Worring, S Santini, A Gupta, R Jain, Content-based image retrieval at the end of the early years. IEEE Trans. Pattern Anal. Mach. Intell.
22(12), 1349–1380 (2000). https://doi.org/10.1109/34.895972
2. D Lowe, Distinctive image features from scale-invariant keypoints. Int. J. Comput. Vis.60(2), 91–110 (2004)
3. Sivic, J. and A. Zisserman (2003). Video Google: A text retrieval approach to object matching in videos. null, IEEE
4. J Yang et al.,Linear Spatial Pyramid Matching Using Sparse Coding for Image Classification. Computer Vision and Pattern Recognition, 2009. CVPR 2009(IEEE Conference on, IEEE, 2009)
5. Wang, J., et al. (2010). Locality-Constrained Linear Coding for Image Classification. Computer Vision and Pattern Recognition (CVPR), 2010 IEEE Conference on, IEEE.
6. Liu, L., et al. (2011). In Defense of Soft-Assignment Coding. Computer Vision (ICCV), 2011 IEEE International Conference on, IEEE.
7. Kim, T.-E. and M. H. Kim (2015). Improving the search accuracy of the VLAD through weighted aggregation of local descriptors. J. Vis. Commun. Image Represent. 31, 237–252
8. H Jegou et al., Aggregating local image descriptors into compact codes. Pattern Analysis and Machine Intelligence, IEEE Transactions on34(9), 1704– 1716 (2012)
9. Perronnin, F., et al. (2010). Large-Scale Image Retrieval with Compressed Fisher Vectors. Computer Vision and Pattern Recognition (CVPR), 2010 IEEE Conference on, IEEE.
10. F Perronnin et al., Improving the fisher kernel for large-scale image classification. Computer Vision–ECCV2010, 143–156 (2010)
11. Peng, X., et al. (2014). Boosting VLAD with supervised dictionary learning and high-order statistics (European Conference on Computer Vision, Springer
12. H Bay, A Ess, T Tuytelaars, L Van Gool, Speeded-up robust features (SURF). Comput. Vis. Image Underst.110(3), 346–359 (2008) http://dx.doi.org/10. 1016/j.cviu.2007.09.014
13. K Mikolajczyk, C Schmid, Scale & affine invariant interest point detectors. Int. J. Comput. Vis.60(1), 63–86 (2004)
14. Ali, N., et al. (2016). Image retrieval by addition of spatial information based on histograms of triangular regions. Computers Electrical Engineering
54, 539–550
15. O Chum et al.,Total Recall: Automatic Query Expansion with a Generative Feature Model for Object Retrieval. Computer Vision, 2007(ICCV 2007. IEEE 11th International Conference on, IEEE, 2007)
16. Philbin, J., et al. (2008). Lost in quantization: Improving particular object retrieval in large scale image databases. Computer Vision and Pattern Recognition, 2008 (CVPR 2008. IEEE Conference on, IEEE)
17. J Philbin et al.,Object Retrieval with Large Vocabularies and Fast Spatial Matching. Computer Vision and Pattern Recognition, 2007. CVPR’07(IEEE Conference on, IEEE, 2007)
18. H Xie et al., Efficient feature detection and effective post-verification for large scale near-duplicate image search. IEEE TRANSACTIONS on multimedia
13(6), 1319–1332 (2011)
19. H Jegou et al., Hamming embedding and weak geometric consistency for large scale image search. Computer Vision–ECCV2008, 304–317 (2008) 20. J Huang, X Yang, X Fang, W Lin, R Zhang, Integrating visual saliency and
consistency for re-ranking image search results. IEEE Transactions on Multimedia13(4), 653–661 (2011). https://doi.org/10.1109/TMM.2011. 2127463
21. Jégou, H. and A. Zisserman (2014). Triangulation embedding and democratic aggregation for image search. Proceedings of the IEEE conference on computer vision and pattern recognition
22. Arandjelović, R. and A. Zisserman (2012). Three Things Everyone should Know to Improve Object Retrieval. Computer Vision and Pattern Recognition (CVPR), 2012 IEEE Conference on, IEEE.
23. Andoni, A. and P. Indyk (2006). Near-optimal hashing algorithms for approximate nearest neighbor in high dimensions. Foundations of Computer Science, 2006. FOCS’06. 47th Annual IEEE Symposium on, IEEE 24. Weiss, Y., et al. (2009). Spectral Hashing. Advances in Neural Information
Processing Systems.
25. Jégou, H., et al., (2009). On the burstiness of visual elements. Computer Vision and Pattern Recognition, 2009. CVPR 2009. IEEE Conference on, IEEE 26. Delhumeau, J., et al. (2013). Revisiting the VLAD image representation.
Proceedings of the 21st ACM international conference on Multimedia, ACM 27. Arandjelovic, R. and A. Zisserman (2013). All about VLAD. Computer Vision
and Pattern Recognition CVPR. 2013 IEEE Conference on.
28. Z Liu et al., Making residual vector distribution uniform for distinctive image representation. IEEE Transactions on Circuits & Systems for Video Technology26(2), 375–384 (2016)
29. Z Liu et al., Fine-residual VLAD for image retrieval. Neurocomputing173(P3), 1183–1191 (2016)
30. Wang, Y., et al. (2015). Hierarchical multi-VLAD for image retrieval. Image Processing (ICIP), 2015 IEEE International Conference on, IEEE
31. Q Zhou, C Wang, P Liu, Q Li, Y Wang, S Chen, Distribution entropy boosted VLAD for image retrieval. Entropy18(8), 311 (2016)
32. Mehmood, Z., et al. (2016). A novel image retrieval based on a combination of local and global histograms of visual words. Mathematical Problems in Engineering 2016. vol. 2016, Article ID 8217250, 12 pages, 2016. https://doi. org/10.1155/2016/8217250
33. Krapac, J., et al. (2011). Modeling spatial layout with fisher vectors for image categorization. Computer Vision (ICCV), 2011 IEEE International Conference on, IEEE
34. Koniusz, P. and K. Mikolajczyk (2011). Spatial coordinate coding to reduce histogram representations, dominant angle and colour pyramid match. Image Processing (ICIP), 2011 18th IEEE International Conference on, IEEE 35. J Sánchez, F Perronnin, TD Campos, Modeling the spatial layout of images
beyond spatial pyramids. Pattern Recogn. Lett.33(16), 2216–2223 (2012) 36. Y Lecun, BE Boser, JS Denker, D Henderson, RE Howard, W Hubbard, LD Jackel, Back propagation applied to handwritten zip code recognition. Neural Comput.1(4), 541–551 (1989)
37. A Krizhevsky et al., ImageNet classification with deep convolutional neural networks. Commun. ACM60(2), 2012 (2013)
38. Zeiler, M.D. and R. Fergus (2014). Visualizing and understanding
convolutional networks European conference on computer vision, Springer 39. R Arandjelovic et al., NetVLAD: CNN architecture for weakly supervised place
recognition. IEEE Transactions on Pattern Analysis & Machine Intelligence
PP(99), 1 (2015)
40. Gong, Y., et al. (2014). Multi-scale orderless pooling of deep convolutional activation features. European conference on computer vision, Springer 41. Jégou, H. and O. Chum (2012). Negative evidences and co-occurences in
image retrieval: The benefit of PCA and whitening. Computer Vision–ECCV 2012: 774-787
42. Radenović, F., et al. (2015). Multiple measurements and joint dimensionality reduction for large scale image search with short vectors. Proceedings of the 5th ACM on International Conference on Multimedia Retrieval, ACM 43. T Tuytelaars, K Mikolajczyk, Local invariant feature detectors: a survey.
Foundations and Trends in Computer Graphics and Vision3(3), 177–280 (2008)
45. T Lindeberg, J Garding, Shape-adapted smoothing in estimation of 3-D shape cues from affine deformations of local 2-D brightness structure. Image Vis. Comput.15(6), 415–434 (1997)
46. J Matas et al., Robust wide-baseline stereo from maximally stable extremal regions. Image & Vision Computing22(10), 761–767 (2004)
47. CE Shannon, W Weaver, N Wiener, The mathematical theory of communication. Phys. Today3(9), 31–32 (1950)
48. Jégou, H., et al. (2010). Aggregating local descriptors into a compact image representation. Computer Vision and Pattern Recognition (CVPR), 2010 IEEE Conference on, IEEE
49. Zhou, R., et al. (2014). Spatial pyramid VLAD. Visual Communications and Image Processing Conference, 2014 IEEE, IEEE
50. A Vedaldi, B Fulkerson,Vlfeat: An Open and Portable Library of Computer Vision Algorithms(International Conference on Multimedea 2010, Firenze, 2010) October
![Table 6 Results of MOP-CNN [40]+SDE on Holidays](https://thumb-us.123doks.com/thumbv2/123dok_us/887816.1586189/12.595.56.292.704.733/table-results-of-mop-cnn-sde-on-holidays.webp)
