ORIGINAL ARTICLE
Practical techniques for the vibration method with additional
mass: bending vibration generated by tapping cross section
Yoshitaka Kubojima1 · Satomi Sonoda2 · Hideo Kato1Received: 26 July 2017 / Accepted: 7 October 2017 / Published online: 13 November 2017 © The Japan Wood Research Society 2017
this approach, the weight, density, and Young’s modulus of a bar can be calculated without weighing it [1–6]. This testing method is referred to as the vibration method with additional mass in this study, and this method enables to simply obtain properties of each piled lumber and each beam of timber guardrails.
Several test conditions have been studied to apply the vibration method with additional mass to actual cases. The suitable mass ratio (additional mass/specimen) and the con-nection way between the additional mass and specimen were experimentally examined. The accuracy of the evaluated material property decreased as the mass ratio increased. The optimum mass ratio for estimation of the material property was approximately 2%. The mean value of estimation error of test with the wood screws connection under the most suit-able mass ratio indicated − 1%. When using the adhesive connection, the mean value was approximately − 7% [7]. The effect of the crosser’s position used for piled lumber on longitudinal vibration was investigated. Placing cross-ers at the nodal positions ensures that accurate density and Young’s modulus values can be determined using the vibra-tion method with addivibra-tional mass without the influence of weight of the upper lumber [8]. The effect of moisture con-tent on the estimation accuracy of the vibration method with additional mass was examined. The estimation accuracy was affected by an increase in the resonance frequency, caused by the drying process during the vibration tests. The estima-tion accuracy in the bending vibraestima-tion test was higher than that in the longitudinal vibration test [9].
Hence, the bending vibration test is suitable for piled lumber from the aspect of estimation accuracy. However, generating the bending vibration for wood inside the piled lumber is difficult. By contrast, generating the longitudinal vibration for such wood is easy.
Abstract This work examines the effect of a method for generating bending vibration on the accuracy of a non-destructive and simple estimation of weight, density, and Young’s modulus through a vibration test without measur-ing specimen weight. The resonance frequencies with and without the concentrated mass generated by tapping the RT (radial tangential)-plane under the free-free condition were compared with those generated by the normal free-free bend-ing vibration. The air-dried specimens and wet specimens in a drying process at 20 °C and 65% relative humidity were used and then their weight, density, and Young’s modulus were estimated by the vibration test. The appropriate reso-nance frequency of the bending vibration could be obtained by tapping the RT-plane. Generating bending vibration by tapping the RT-plane is effective for the application of the vibration method with additional mass to a drying process.
Keywords Bending vibration · Cross section ·
Longitudinal vibration · Vibration method with additional mass
Introduction
Adding mass to a bar decreases the resonance frequencies of the bar due to longitudinal and bending vibrations. With
* Yoshitaka Kubojima [email protected]
1 Forestry and Forest Products Research Institute, 1 Matsunosato, Tsukuba, Ibaraki 305-8687, Japan 2 Toyama Prefectural Agricultural, Forestry and Fisheries
When a plate is tapped, many vibration modes such as flexural, torsional, longitudinal and other vibrations appear. The resonance frequencies of the flexural vibration modes, those of the torsional vibration modes and longitudinal vibra-tion modes can be identified easily: when a rectangular bar is tapped along its edge line, a frequency spectrum of complex vibrations of bending and twisting occurs. By contrast, when the bar is tapped along its center line, pure bending vibration occurs [10, 11].
We attempted generating the bending vibration by tapping a cross section of wood and examined whether or not the vibra-tion method with addivibra-tional mass can be accurately performed using the obtained resonance frequencies.
Vibration method with additional mass
In the case of a thin beam, the effects of shear deflection and rotary inertia involved in the bending vibrational deflection are negligible, and Euler–Bernoulli elementary theory of bending can be applied to the vibration.
The Young’s modulus using the bending vibrations E of a rectangular bar with length l, is expressed as follows:
where ρ, ω, A, and I are the density, angular frequency (ω = 2πf, f resonance frequency), cross-sectional area, and the moment of inertia of the cross section, respectively. The value of mn is explained below.
The frequency equation for the free-free bending vibra-tion with concentrated mass M placed at x = al (x distance along the bar, 0 ≤ a ≤ 1, a + b = 1) of a rectangular bar (Fig. 1) is expressed as follows [12]:
(1) E=
(
l m
n
)2
𝜌A
I 𝜔
2 n
(2) (
cosm
ncoshmn−1
) − 1
2𝜇mn {(
cosam
ncoshamn+1
)
(
sinbmncoshbmn−cosbmnsinhbmn)
+(cosbmncoshbmn+1) (
sinam
ncoshamn−cosamnsinhamn
)} =0
where µ is the ratio of the concentrated mass to the mass of the bar and is written as:
The suffix n is the resonance mode number. If µ = 0, Eq. (2) becomes
where the suffix 0 represents the value without the concen-trated mass.
For a bar without a concentrated mass, Eq. (4) gives:
The density and Young’s modulus are the same before and after the concentrated mass is bound to a specimen. Thus, using Eq. (1) obtains,
The value of µ can be calculated by substituting mn from Eq. (6) into Eq. (2). The weight and density can be obtained by substituting the calculated µ, the concentrated mass, and the dimensions of a bar into Eq. (3). The Young’s modulus can be calculated by substituting the density from Eq. (3) and the resonance frequency without the concentrated mass into Eq. (1) [1–6]. This procedure is referred to as the “vibra-tion method with addi“vibra-tional mass” in this study.
Materials and methods Specimens
Sitka spruce (Picea sitchensis Carr.) was used as the sample specimen in this study. Air-dried specimens with dimen-sions of 1500–1600 mm (L longitudinal) × 100–105 mm (R radial) × 100–105 mm (T tangential) (large specimen) and those 300 mm (L) × 30 mm (R) × 5 mm (T) (small specimen) were made. Five large specimens and ten small specimens were used. The specimens were straight-grained and had no knots. The large specimens were conditioned at 20 °C and 65% relative humidity (RH). The tests were conducted under the same conditions.
Small specimens were placed under water and then con-ditioned at 20 °C and 65% RH until they attained a constant weight. The tests were performed directly after taking the specimen from water (0 h) and again after 3, 6, 9, 12, 15, 18, 21, and 24 h, and when the weight of the specimen became (3) 𝜇=
M
𝜌Al
(4)
cosm
n0coshmn0−1=0
(5) m
10=4.730, m20=7.853, m30=10.996, m
n0=
1
2(2n+1)π(n>3)
(6)
m
n= √
f
n
f
n0
m
n0
bl al
l M
a + b = 1, 0 ≤a,b≤ 1
constant at 20 °C and 65% RH (8 day). When the weight of the specimen became constant at 20 °C and 65% RH, the specimen is considered to be air-dried. After finishing the test under the air-dried condition, the small specimens were oven-dried at 105 °C.
The oven-dried weight was used to calculate the moisture content of the small specimen. The moisture content at 0 h varied from 104 to 128%.
The following nine steps shown in Table 1 were applied to the small specimens. All tests were conducted under 20 °C and 65% RH.
Step 1 The dimensions and weight of the small specimen were measured.
Step 2 The first free-free bending vibration test without the concentrated mass was performed. The vibration was generated by tapping the LR-plane of a specimen.
Step 3 The first vibration test by tapping the RT-plane of a specimen without the concentrated mass was performed.
Step 4 The specimen and the concentrated mass were weighed.
Step 5 The vibration test with the concentrated mass was performed. The vibration was generated by tapping the RT-plane of a specimen.
Step 6 The specimen was weighed.
Step 7 The second vibration test by tapping the RT-plane of a specimen without the concentrated mass was performed.
Step 8 The second free-free bending vibration test with-out the concentrated mass was performed. The vibration was generated by tapping the LR-plane of a specimen.
Step 9 The specimen was weighed.
The resonance frequency will increase with the decrease in the moisture content caused by drying during vibration tests, and the increase in the resonance frequency will affect the accuracy of the vibration method with additional mass. Hence, the first and second vibration tests without the con-centrated mass (steps 2, 3, 7, and 8) were conducted [9].
Generation of longitudinal and bending vibrations by tapping a cross section
Longitudinal and bending vibrations were generated by tap-ping a cross section on the specimen with and without the concentrated mass using the following procedure as shown in Fig. 2. The test bar was suspended by two threads at the nodal positions of free-free vibration corresponding to its first resonance mode (y-axis for the large specimen: R- and T-directions, y-axis for the small specimen: T-direction), and then the bending vibration was generated by tapping the RT-plane of the bar at one end using a wooden hammer (tapping 1), while bar motion was detected by a microphone (Precision Sound Level Meter 2003, NODE Co., Ltd, Tokyo, Japan) at the other end (microphone placements 1 and 2). The signal was processed through the fast Fourier transform (FFT) digital signal analyzer (CF-5220, Ono Sokki Co., Ltd, Yokohama, Japan) to yield high-resolution resonance frequencies.
An iron plate with dimensions of 70.1 mm × 70.1 mm × 9.2 mm (approximately 347.4 g) for the large specimen and that with dimensions of 2 mm × 3 mm × 25 mm (1.30 g) for the small specimen were used as the concentrated mass and were bonded at x = 0 on the LR- and LT-planes of the large specimen and on the LR-plane of the small specimen with two-sided adhesive tape. The concentrated mass placements were 1 and 2 for the large specimen. A couple of different placement of iron plates was conducted because the center of gravity of the iron plate was changed by their placement. The bonding surface of the iron plate to the small specimen was a 2 mm × 30 mm plane. The values of µ were 0.0481–0.0569 for the large specimen and 0.0267–0.0578 for the small specimen, which were calculated using the masses of the concentrated mass and the specimen.
Table 1 Steps of vibration tests
M concentrated mass, RT radial tangential
Step Dimension Weight Vibration test
Specimen M Free-free bending Tapping RT-plane
Without M Without M With M
1 ○ ○
2 ○
3 ○
4 ○ ○
5 ○
6 ○
7 ○
8 ○
Bending vibration test
To compare the resonance frequency of bending vibration and that generated by tapping a cross section mentioned above, free-free bending vibration tests were conducted on the large and small specimens with and without the con-centrated mass using the following procedure as shown in Fig. 2. The test bar was suspended by two threads at the nodal positions of free-free vibration corresponding to its first resonance mode, and then the bending vibration was generated by tapping the LR-plane (y-axis, T-direction) and LT-plane (y-axis, R-directions) of the large specimen and the LR-plane of the small specimen (y-axis, T-direction) at one end using the wooden hammer (tapping 2), while bar motion was detected by a microphone at the other end (microphone placement 2). The signal was processed through the FFT digital signal analyzer to yield high-resolution resonance frequencies.
Results and discussion
The means (standard deviations) of the density obtained using the weight and volume of the specimen and the Young’s modulus using free-free longitudinal vibration without the concentrated mass were 405 (0.015) kg/m3 and
10.94 (0.88) GPa for the large specimen and 533 (0.020)
kg/m3 and 16.62 (0.94) GPa for the small specimen,
respec-tively, when the specimen weight became constant.
Figure 3 shows an example of waveforms generated by tapping the RT-plane of the large specimens (microphone placement 1 in Fig. 2). Various vibration modes appeared. The Young’s modulus obtained by the Goens-Hearmon regression method based on the Timoshenko theory of bend-ing [13–15] using the resonance frequencies of B1–B4 was 12.17 GPa while all the Young’s moduli obtained by the longitudinal vibration theory using L1–L5 were 12.28 GPa, respectively. Because they were similar values, B1–B4 were the bending vibration modes and L1–L5 were the
Fig. 2 A schematic diagram of the experimental setup for the
free-free vibration tests Microphone
Specimen
x
y Suspending thread
Hammer Tapping 2
Tapping 1
Bandpath
filter analyzerFFT
x: Longitudinal direction
y: Radial direction or Tangential direction Microphone
placement 1
Microphone placement 2 Concentrated mass
Concentrated mass
placement 1 Concentrated massplacement 2 Specimen
Suspending thread 9.2 mm
70 mm
-80 -60 -40 -20 0 20
0 2000 4000 6000 8000 10000
Voltage [dBV]
Frequency [Hz]
B1 B2
B3B4 L1
L2 L3 L4
L5 Bn: Bending, n-th mode Ln: Longitudinal, n-th mode
longitudinal vibration modes. Thus, the bending modes could be distinguished from the longitudinal modes.
The resonance frequencies without the concentrated mass generated by tapping the RT-plane (f10RT) of the large speci-mens were similar to those generated by the free-free bend-ing vibration (f10FF) as shown in Table 2. The average (stand-ard deviation) of the ratio f10RT/f10FF for the small specimens for 0 h–8 day (step 3/step 2 and step 7/step 8) was 1.0000 (0.00085). These results show that the appropriate resonance frequency of the bending vibration could be obtained by tapping the RT-plane.
The ratios of weight, density, and Young’s modulus, esti-mated by the vibration method with additional mass, to those obtained by the normal method without the concentrated mass (W/W0, ρ/ρ0, E/E0) were examined. The weight, den-sity, and Young’s modulus by the normal method (W0, ρ0, and E0) were obtained as follows. The weight W0 was the actual measurement. The density ρ0 was calculated from W0
and volume of the specimen. The Young’s modulus E0 was calculated using Eqs. (1) and (5). Resonance frequency was measured without the concentrated mass. These three ratios all show the same values (W/W0 = ρ/ρ0 = E/E0) and indicate the estimation accuracy of the vibration method with addi-tional mass. W/W0 = ρ/ρ0 = E/E0 = 1 means that the estima-tion of weight, density, and Young’s modulus by the vibra-tion method with addivibra-tional mass is perfect.
Table 3 shows the results of large specimens. Consider-ing the ratio for uncorrected calculation (a = 0 was used for estimation, “uncorrected” in Table 3), the estimation accu-racy was slightly lower than the previous results using the similar size specimens [8]. When a = 70.1/2l = 35.05/l and
a = 9.2/2l = 4.6/l were used for the calculation based on the center of gravity of the iron plate, the estimation accuracy was improved (“corrected” in Table 3).
The difference of resonance frequency between “y-axis: T-direction” and “y-axis: R-direction” for the same con-centrated mass placement in Fig. 2 was very small such as 1–7 Hz. In this case, it is possible for a peak to split into two as shown in Fig. 4 because the shape of the cross section of the specimen is similar to a square and the difference of the shear modulus of the LR-plane and that of the LT-plane is not large [11]. When two peaks appear, it is difficult to choose the correct peak from the two peaks.
Consider the case when two peaks appear. Let fn0L be the larger resonance frequency without the concentrated mass and fn0S be the smaller resonance frequency without the concentrated mass. Let fnL be the larger resonance fre-quency with the concentrated mass and fnS be the smaller resonance frequency with the concentrated mass. In this case, substituting fnL/fn0L and fnS/fn0S into Eq. (6) are suit-able. For the large specimen no. 1, using the pair of larger values (f10 = 255.0000 Hz and f1 = 237.1875 Hz, y-axis: R-direction, concentrated mass placement 1 in Fig. 2) and the smaller values (f10 = 253.7500 Hz and f1 = 233.5313 Hz,
y-axis: T-direction, concentrated mass placement 1 in Fig. 2) is effective.
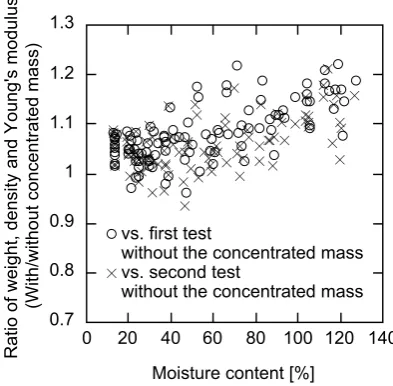
Figure 5 shows all results of the changes in the ratio of
W/W0 = ρ/ρ0 = E/E0 for the small specimens during drying at 20 °C and 65% RH. Roughly speaking, the ratio decreased and approached 1 as the moisture content decreased. When the resonance frequencies without the concentrated mass were values obtained from the first vibration test (step 2), the average (standard deviation) of the ratio was 1.08 (0.058), and when those were values obtained from the second vibra-tion test (step 8), the average (standard deviavibra-tion) of the ratio was 1.06 (0.050). The improvement of the estimation accuracy by using the second bending vibration test without the concentrated mass was similar to the previous study [8]. Since the moisture content of the small specimens continued to decrease during drying, the resonance frequencies without the concentrated mass obtained from the second vibration test was larger than those obtained from the first vibration test. Consequently, fn/fn0 and mn [Eq. (6)] obtained from the second vibration test were smaller than those obtained from the first vibration test. Since µ increases with the decrease in
mn [9], µ obtained from the second vibration test was larger than that obtained from the first vibration test. Since µ is expressed by Eq. (3), the weight obtained from the second vibration test was smaller than that obtained from the first vibration test. Therefore, one can conclude that generating bending vibration by tapping the RT-plane is effective for a drying process.
Table 2 Comparison of the resonance frequency of the first mode without the concentrated mass generated by tapping the RT-plane (f10RT) with that by the free-free bending vibration (f10FF)
y-axis: refer to Fig. 2, f10RT: Tapping 1 and Microphone placement 2 in Fig. 2, f10FF: Tapping 2 and Microphone placement 2 in Fig. 2
Specimen y-axis f10RT (Hz) f10FF (Hz) f10RT/f10FF
1 T-direction 253.7500 253.7500 1.0000
R-direction 255.0000 255.0000 1.0000
2 T-direction 252.5938 252.8125 0.9991
R-direction 245.5938 245.6250 0.9999
3 T-direction 220.6563 220.7500 0.9996
R-direction 222.7200 222.8125 0.9996
4 T-direction 231.5750 231.7500 0.9992
R-direction 236.0250 236.0000 1.0001
5 T-direction 218.6500 218.6000 1.0002
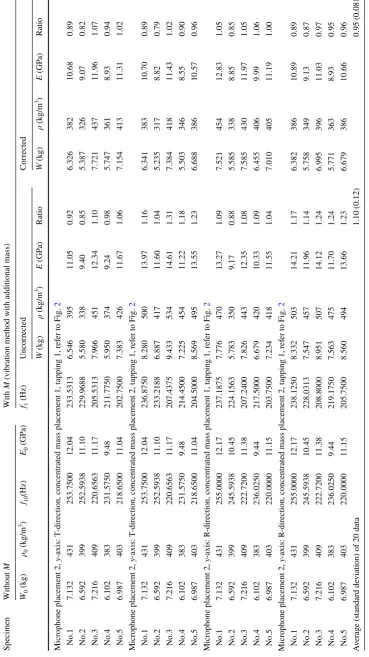
Table 3 Es timations b y t he vibr ation me thod wit
h additional mass f
or t he lar ge specimens M concentr ated mass, W w eight, ρ density , f1 resonance fr eq
uency of t
he firs
t mode,
E
Y
oung’
s modulus, Suffix 0: dat
a wit
hout t
he concentr
ated mass, R
atio: W / W0 = ρ / ρ0 = E / E0 Specimen W ithout M W ith M (vibr ation me thod wit
h additional mass)
W0 (k g) ρ0 (k g/m 3) f10 (Hz) E0 (GP a) f1 (Hz) Uncor rected Cor rected W (k g) ρ (k g/m 3) E (GP a) Ratio W (k g) ρ (k g/m 3) E (GP a) Ratio Micr
ophone placement 2,
y
-axis: T
-dir
ection, concentr
ated mass placement 1, t
apping 1, r
ef er t o F ig. 2 N o.1 7.132 431 253.7500 12.04 233.5313 6.546 395 11.05 0.92 6.326 382 10.68 0.89 N o.2 6.592 399 252.5938 11.10 229.9688 5.580 338 9.40 0.85 5.387 326 9.07 0.82 N o.3 7.216 409 220.6563 11.17 205.5313 7.966 451 12.34 1.10 7.721 437 11.96 1.07 N o.4 6.102 383 231.5750 9.48 211.7750 5.950 374 9.24 0.98 5.747 361 8.93 0.94 N o.5 6.987 403 218.6500 11.04 202.7500 7.383 426 11.67 1.06 7.154 413 11.31 1.02 Micr
ophone placement 2,
y
-axis: T
-dir
ection, concentr
ated mass placement 2, t
apping 1, r
ef er t o F ig. 2 N o.1 7.132 431 253.7500 12.04 236.8750 8.280 500 13.97 1.16 6.341 383 10.70 0.89 N o.2 6.592 399 252.5938 11.10 233.2188 6.887 417 11.60 1.04 5.235 317 8.82 0.79 N o.3 7.216 409 220.6563 11.17 207.4375 9.433 534 14.61 1.31 7.384 418 11.43 1.02 N o.4 6.102 383 231.5750 9.48 214.4500 7.225 454 11.22 1.18 5.503 346 8.55 0.90 N o.5 6.987 403 218.6500 11.04 204.5000 8.569 495 13.55 1.23 6.688 386 10.57 0.96 Micr
ophone placement 2,
y
-axis: R
-dir
ection, concentr
ated mass placement 1, t
apping 1, r
ef er t o F ig. 2 N o.1 7.132 431 255.0000 12.17 237.1875 7.776 470 13.27 1.09 7.521 454 12.83 1.05 N o.2 6.592 399 245.5938 10.45 224.1563 5.783 350 9.17 0.88 5.585 338 8.85 0.85 N o.3 7.216 409 222.7200 11.38 207.2400 7.826 443 12.35 1.08 7.585 430 11.97 1.05 N o.4 6.102 383 236.0250 9.44 217.5000 6.679 420 10.33 1.09 6.455 406 9.99 1.06 N o.5 6.987 403 220.0000 11.15 203.7500 7.234 418 11.55 1.04 7.010 405 11.19 1.00 Micr
ophone placement 2,
y
-axis: R
-dir
ection, concentr
ated mass placement 2, t
apping 1, r
ef er t o F ig. 2 N o.1 7.132 431 255.0000 12.17 238.1250 8.332 503 14.21 1.17 6.382 386 10.89 0.89 N o.2 6.592 399 245.5938 10.45 228.0313 7.547 457 11.96 1.14 5.758 349 9.13 0.87 N o.3 7.216 409 222.7200 11.38 208.8000 8.951 507 14.12 1.24 6.995 396 11.03 0.97 N o.4 6.102 383 236.0250 9.44 219.1750 7.563 475 11.70 1.24 5.771 363 8.93 0.95 N o.5 6.987 403 220.0000 11.15 205.7500 8.560 494 13.66 1.23 6.679 386 10.66 0.96 Av er ag e (s tandar d de
viation) of 20 dat
a
1.10 (0.12)
Conclusions
The resonance frequencies with and without the concen-trated mass generated by tapping the RT-plane under the free-free condition were compared with those generated by the normal free-free bending vibration. Then, the weight, density, and Young’s modulus estimated by the vibration method with additional mass using the bending vibration generated by tapping the RT-plane were examined. The fol-lowing results were obtained:
1. The appropriate resonance frequency of the bending vibration could be obtained by tapping the RT-plane. 2. When two peaks appear, using the pair of larger values
and the pair of lower values is effective.
3. Generating bending vibration by tapping the RT-plane was effective for the application of the vibration method with additional mass to a drying process.
Acknowledgements This study was supported by JSPS KAKENHI Grant number JP15K07522.
References
1. Skrinar M (2002) On elastic beams parameter identification using eigenfrequencies changes and the method of added mass. Comput Mater Sci 25:207–217
2. Türker T, Bayraktar A (2008) Structural parameter identification of fixed end beams by inverse method using measured natural frequencies. Shock Vib 15:505–515
3. Kubojima Y, Sonoda S (2015) Measuring Young’s modulus of a wooden bar using longitudinal vibration without measuring its weight. Eur J Wood Wood Prod 73:399–401
4. Matsubara M, Aono A, Kawamura S (2015) Experimental iden-tification of structural properties of elastic beam with homo-geneous and uniform cross section. Trans JSME. doi:10.1299/ transjsme.15-00279
5. Kubojima Y, Kato H, Tonosaki M, Sonoda S (2016) Measuring Young’s modulus of a wooden bar using flexural vibration without measuring its weight. BioRes 11:800–810
6. Matsubara M, Aono A, Ise T, Kawamura S (2016) Study on identification method of line density of the elastic beam under unknown boundary conditions. Trans JSME. doi:10.1299/ transjsme.15-00669
7. Sonoda S, Kubojima Y, Kato H (2016) Practical techniques for the vibration method with additional mass part 2: experimental study on the additional mass in longitudinal vibration test for timber measurement. CD-ROM Proceedings of the World Conference on Timber Engineering (WCTE 2016)
8. Kubojima Y, Sonoda S, Kato H (2017) Practical techniques for the vibration method with additional mass: effect of crossers’ position in longitudinal vibration. J Wood Sci 63:147–153
9. Kubojima Y, Sonoda S, Kato H (2017) Practical techniques for the vibration method with additional mass: effect of specimen moisture content. J Wood Sci. doi:10.1007/s10086-017-1653-0
10. Sobue N (1988) Simultaneous determination of Young’s modulus and shear modulus of structural lumber by complex vibrations of bending and twisting. Mokuzai Gakkaishi 34:652–657
11. Kubojima Y, Tonosaki M (2013) Effect of specimen width on the shear modulus of wood obtained by flexural vibration tests. Wood Fib Sci 45:170–177
12. Kubojima Y, Tonosaki M, Yoshihara H (2005) Effect of addi-tional mass on Young’s modulus of a wooden beam. J Test Eval 33:278–282
13. Timoshenko SP (1921) On the correction for shear of the dif-ferential equation for transverse vibrations of prismatic bars. Phil Mag 6 Ser 41:744–746
14. Goens E (1930) Über die Bestimmung des Elastizitätsmodulus von Stäben mit Hilfe von Biegungsschwingungen (in German). Annal Phys 5:649–678
15. Hearmon RFS (1958) The influence of shear and rotatory inertia on the free flexural vibration of wooden beams. Brit J Appl Phys 9:381–388
-75 -70 -65 -60 -55 -50 -45 -40
100 150 200 250 300 350
Voltage [dBV
]
Frequency [Hz] Peak 1 Peak 2
Fig. 4 An example of split peaks of large specimens
0.7 0.8 0.9 1 1.1 1.2 1.3
0 20 40 60 80 100 120 140
Ratio of weight, density and Young's modulus
(With/without concentrated mass)
Moisture content [%] vs. first test
without the concentrated mass vs. second test
without the concentrated mass