RESEARCH
Investigation of hole-free phase plate
performance in transmission electron
microscopy under different operation
conditions by experiments and simulations
Rebecca Pretzsch
1*, Manuel Dries
1, Simon Hettler
1, Martin Spiecker
2, Martin Obermair
1and Dagmar Gerthsen
1Abstract
Hole-free phase plates (HFPPs), also known as Volta phase plates, were already demonstrated to be well suited for in-focus transmission electron microscopy imaging of organic objects. However, the underlying physical processes have not been fully understood yet. To further elucidate the imaging properties of HFPPs, phase shift measurements were carried out under different experimental conditions. Both positive and negative phase shifts occur depending on the diameter of the zero-order electron beam and the HFPP film temperature. The analysis of Thon ring patterns of an amorphous carbon test sample reveals that the phase-shifting patch can be significantly larger than the size of the zero-order beam on the HFPP film. An HFPP was used for in-focus phase contrast imaging of carbon nanotube (CNT) bundles under positive and negative phase-shifting conditions. The comparison of experimental and simulated images of CNT bundles gives detailed information on the phase shift profile, which depends on the spatial frequency in the vicinity of the zero-order beam. The shape of the phase shift profile also explains halo-like image artifacts that surround the imaged objects.
Keywords: Transmission electron microscopy, Phase contrast imaging, Phase plate, Thin film, Hole-free phase plate, Volta phase plate, Phase shift profile, Carbon nanotubes
© The Author(s) 2019. This article is distributed under the terms of the Creative Commons Attribution 4.0 International License (http://creat iveco mmons .org/licen ses/by/4.0/), which permits unrestricted use, distribution, and reproduction in any medium, provided you give appropriate credit to the original author(s) and the source, provide a link to the Creative Commons license, and indicate if changes were made.
Introduction
Organic materials are highly transparent for high-energy electrons in transmission electron microscopy (TEM), which leads to weak or even vanishing contrast in con-ventional in-focus TEM images. Such objects cause a negligible modulation of the amplitude of the exit wave function and only weakly influence the phase of the incoming electron wave. For a long time, defocusing of the objective lens has been commonly used to visual-ize the structure of weakly scattering samples by means of phase contrast [1]. However, defocusing comes
along with a contrast delocalization and impedes image interpretability.
Different concepts for generating in-focus phase con-trast by physical phase plates (PPs) were suggested already many years ago [2, 3]. A PP is a device installed in the back focal plane (BFP) of the objective lens, where it introduces a phase shift difference �ϕPP between the
unscattered and the scattered electrons. In this work, we use the convention that a negative phase shift of the unscattered electrons corresponds to an advancing phase plate [4]. The transfer of the object wave by the imag-ing system is described by the coherent contrast transfer function (CTF), which is given by
The wave aberration function (1)
CTF(q)=exp(−i·χPP(q)).
(2) χPP(q)=π �fe·q2+
π 2Cs
3
e·q4+�ϕPP
Open Access
*Correspondence: [email protected]
1 Laboratory for Electron Microscopy, Karlsruhe Institute of Technology
(KIT), Engesserstr. 7, 76131 Karlsruhe, Germany
includes phase shift contributions by the defocus f and the spherical aberration with the spherical aber-ration constant Cs as well as the phase shift �ϕPP of the PP. The electron wavelength is denoted by e . For
weak phase objects, the CTF reduces to the phase con-trast transfer function (PCTF), which is proportional to sinχPP . In the power spectrum of a TEM image of a thin amorphous sample, dark and bright rings appear due to the PCTF, which are denoted as Thon rings. Without PP (i.e., �ϕPP=0 ), the wave aberration function and thus the PCTF are close to zero for low spatial frequencies. A phase shift �ϕPP= ±π/2 converts the sine-shaped PCTF into a cosine function resulting in strong phase contrast.
During the last two decades, substantial progress has been made in the experimental realization of PPs due to a general improvement in the fabrication of microstruc-tured devices. Numerous different PP concepts have been proposed [5] with the thin-film Zernike PP being the first successful realization [6]. It consists of a thin amorphous carbon (aC) film with a small hole in the center and relies on the principle that scattered electrons passing through the film obtain an additional phase shift due to the mean inner potential of the film material. An optimal phase shift of −π/2 is achieved by adjusting the thickness of the film. Thin-film PPs are comparatively easy to fabricate, but show an ageing effect leading to charging-induced image artifacts [7]. In addition, the hole diameter deter-mines the cut-on frequency below which phase con-trast is not enhanced as scattered electrons transmitted through the hole do not gain a phase shift. Moreover, the sharp edge of the central hole causes intensity oscilla-tions at abrupt changes of the scattering potential in the specimen, which are denoted as fringing artifacts [6, 8].
To avoid fringing, the hole-free phase plate (HFPP) was introduced recently [9, 10], with the Volta PP being the most common realization [10], and several impres-sive applications have been published in the recent past [11–17]. The HFPP consists of a continuous and homo-geneously thin aC film without a hole and relies on the formation of a phase-shifting patch on the film induced by the high intensity of the zero-order beam (ZOB). Both positive [9] and negative [10] phase shifts have been reported. A positive phase shift can arise from positive charging due to the emission of secondary electrons from the aC film or contamination growth at the position of the ZOB [9, 18]. In the case of contamination growth, the phase shift is given by ϕ=σVMIPt with the interaction constant σ , the mean inner potential VMIP , and the local thickness t of the deposited contamination patch [19]. A negative phase shift can be explained by a change of the local work function in the region of the ZOB. With adsorbed (water) molecules acting as a dipole layer, the work function is modified if some adsorbed molecules
are desorbed by the intense ZOB [20]. The induced phase shift strongly depends on ambient conditions such as the temperature of the HFPP, the electron dose, the size of the ZOB on the film, and residual gases in the vacuum [9, 10, 20, 21]. However, a clear understanding of the influ-ence of these parameters and their control has not been achieved yet and requires further investigation.
In this work, we have analyzed the phase-shifting behavior of an HFPP by systematic phase shift meas-urements for different experimental conditions. Phase shift measurements were conducted for two differ-ent ZOB diameters on the HFPP film and for unheated and heated HFPPs to examine the sign and strength of the induced phase shift. The measurements show that a proper choice of the considered parameters is crucial to obtain the desired phase shift. In addition, a dependence of the phase shift on the spatial frequency q is observed. Therefore, the phase-shifting behavior of HFPPs will be described in the following by �ϕPP(q)=ϕPP(0)−ϕPP(q) , including the q-dependence in the wave aberration function:
The phase shift of the unscattered electrons is denoted by ϕPP(0) and we assume ϕPP(q)→0 for sufficiently high
spatial frequencies q . Phase contrast imaging was con-ducted for a single-walled carbon nanotube (CNT) sam-ple. Image simulations of CNT bundles are quantitatively compared with experimental HFPP images, which allows for the reconstruction of ϕPP(q) at low spatial frequencies and explains halo image artifacts that surround objects in HFPP TEM images. The simulations also show that the shape of ϕPP(q) at low spatial frequencies is crucial for the performance of an HFPP as a suitable phase contrast imaging tool.
Methods
HFPP implementation
The HFPP was prepared by depositing a thin aC layer by electron-beam evaporation (PVD75, Kurt J. Lesker Company, Hastings, UK) on a freshly cleaved mica sheet (Plano, Wetzlar, Germany, Product No. 54) and sub-sequent floating of the film on a TEM gold grid (Plano, Product No. G2200A). The film thickness was meas-ured to be 12 nm by imaging of a cross-sectional TEM lamella that was prepared by focused ion beam milling from a simultaneously coated silicon wafer. The HFPP was mounted onto a customized HFPP holder equipped with a heating device and a temperature sensor in the vicinity of the film. The holder was attached to a Klein-diek MM3A-EM micromanipulator system (Kleindiek, Reutlingen, Germany) and implemented into the BFP of (3) χPP(q)=π �fe·q2+
π 2Cs
3
a 200 kV Philips CM 200 FEG/ST transmission electron microscope (Thermo Fisher Company, Waltham, USA). With this setup, we achieved HFPP temperatures up to 200 °C. The experiments were carried out at an accelera-tion voltage of 200 kV. The spherical aberraaccelera-tion constant of the microscope is 1.2 mm. A liquid nitrogen-cooled anticontamination device was used to improve vacuum conditions in the sample region.
During alignment, the condenser astigmatism must be well corrected to obtain a round shape of the ZOB on the HFPP film. Particular attention has to be paid to the vertical position of the HFPP film which must coincide with the BFP of the objective lens. The position of the BFP is aligned by adjusting the C2 lens current [22]. If the HFPP is not in the BFP, the granularity of the HFPP film becomes visible in the image at intermediate magnifica-tion. By varying the C2 lens current, the vertical position of the BFP is adjusted until the image of the film disap-pears. For each measurement, a fresh position on the HFPP film was used after performing the vertical adjust-ment close to the new HFPP film position.
Phase shift determination and HFPP TEM imaging
We present phase shift measurements conducted at room temperature with a small and a large condenser aperture (50 µm and 150 µm) resulting in a small (~ 100 nm) and large (~ 250 nm) diameter of the ZOB on the HFPP film and in addition at an HFPP film temperature of 200 °C with a small ZOB diameter. Time series of images were recorded with a 4 k charge-coupled device camera (TVIPS, Gauting, Germany). After each series, the HFPP film was imaged in defocused diffraction mode to reveal the imprint of the ZOB on the HFPP film. Since this mode is not a calibrated imaging mode, the size of the patches was subsequently measured in a scanning elec-tron microscope.
An aC film with 50 nm thickness was used as test spec-imen to determine the phase shift induced by the HFPP by analyzing the power spectrum of the image intensity, which represents the square of the PCTF, being propor-tional to sin2χPP . Imaging was performed at relatively large underfocus values to obtain a sufficient number of Thon rings in the power spectrum. After background subtraction and envelope correction [23], the azimuth-ally averaged intensity profile is determined. The phase shift profile ϕPP(q) can be extended and might cause an additional q-dependent shift of the inner Thon rings. For the outer rings (i.e., high q ), where we assume that the phase shift no longer depends on q , the experimental power spectrum can be fitted by sin2χPP with a constant phase shift �ϕPP(q)=ϕPP(0) . This procedure yields the defocus f and ϕPP(0) . For the inner rings, the deviation between the measured power spectrum and the fit yields
a first estimate of the phase shift profile ϕPP(q) . For sim-plicity, only minima and maxima of the measured power spectrum are evaluated in this case. The phase shift pro-file ϕPP(q) is determined in more detail by comparison of experimental and simulated HFPP TEM images of CNT bundles, as outlined in “Comparison between experi-mental and simulated HFPP images”.
Phase contrast images were acquired for a CNT sam-ple. The sample was fabricated by laser evaporation of a composite carbon/nickel catalyst target (Tōyō Tanso, Osaka, Japan) and deposited on a holey carbon film (Plano, Product No. S147-2). The CNTs appear in bun-dles of parallel single CNTs and partially protrude into vacuum regions.
Results and discussion
The following chapter is divided into three subsections. The first subsection contains the analysis of the phase shift of HFPPs under different operation conditions. The results of HFPP TEM imaging of a CNT sample are described in the second subsection. The third subsection is devoted to the comparison of experimental and simu-lated image intensity profiles of CNT bundles, which yields detailed information on the phase shift profile for low spatial frequencies.
Phase shift measurements
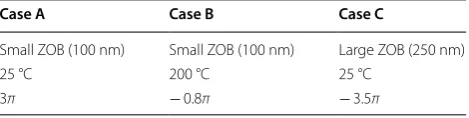
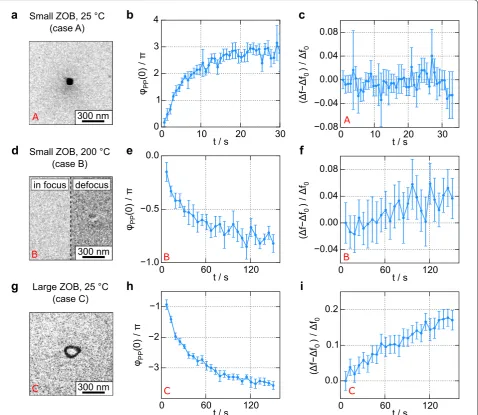
Time series of images of the aC test specimen were acquired and the corresponding Thon ring patterns were evaluated to examine the phase-shifting behavior of HFPPs under different conditions (cases A–C, see Table 1 for an overview). For cases A (small ZOB, ~ 100 nm) and C (large ZOB, ~ 250 nm), the HFPP was kept at room temperature (25 °C). For case B (small ZOB), the HFPP temperature was raised to 200 °C. For case A, the phase shift evolution was so fast that image acquisition had to be performed in video mode of the camera at 13 kX magnification. For cases B and C, an acquisition time of 2 s at 97 kX magnification with a waiting time of 4 s between each image was used. For each case, results of a representative time series are depicted in Fig. 1, show-ing the evolution of the phase shift ϕPP(0) of the ZOB and
Table 1 Overview of the different experimental conditions: diameter of the ZOB on the HFPP film, HFPP film temperature, and phase shift ϕPP(0) after 30 s (case A) and 150 s (cases B and C)
Case A Case B Case C
Small ZOB (100 nm) Small ZOB (100 nm) Large ZOB (250 nm)
25 °C 200 °C 25 °C
the defocus change as a function of time as well as TEM images of the ZOB imprint on the HFPP film.
For an unheated HFPP, we expect positive phase shift according to the literature [9], which can be attributed to contamination growth and the positive mean inner potential VMIP of the contamination patch [18]. This is in agreement with the experimental findings for case A, where the induced phase shift is positive and builds up to ϕPP(0)=3π within ~ 20 s (Fig. 1b). The dark spot on
the HFPP film at the position of the ZOB indicates a strong thickness increase of the aC film by contamination (Fig. 1a). A measurement over longer time scales was not reasonable, because the signal became very weak due to strong electron scattering in the contamination patch.
For a heated HFPP with small ZOB diameter (case B), contamination is suppressed and a negative phase shift is measured as expected [10]. The phase shift evolution starts close to ϕPP(0)=0 and reaches ϕPP(0)= −0.8π 300 nm
g
a
d
Large ZOB, 25 °C (case C) Small ZOB, 25 °C
(case A)
Small ZOB, 200 °C (case B)
300 nm
300 nm in focus defocus
h
i
b
c
e
f
A A
B
C C C
B B
after approximately 150 s (Fig. 1e), yielding the best phase-shifting conditions in our experiments. Con-tamination is not visible in the focused TEM image of the ZOB imprint (Fig. 1d). However, the dark shadow in the defocused TEM image indicates that a phase-shifting patch is formed at the position of the ZOB. It was already demonstrated that increasing temperatures lead to a reduction of the absolute value of ϕPP(0) [10]. The operation temperature was limited to 200 °C in this work, which prevented further optimization of ϕPP(0) towards – 0.5π. The sign change of ϕPP(0) indicates that a completely different mechanism is responsible for the phase shift compared to case A. Hettler et al. [20] sug-gested that the negative phase shift can be explained by a change of the local work function after desorption of adsorbed (water) molecules on the HFPP surface by the intense ZOB.
For the unheated HFPP with large ZOB (case C), we measured a negative phase shift with ϕPP(0)= −3.5π after 150 s (Fig. 1h), even though contamination was pre-sent. The origin of the negative ϕPP(0) can be understood
by considering the TEM image of the contamination patch (Fig. 1g), which clearly differs from case A (Fig. 1a), where the ZOB was smaller. For case C, contamination only builds up at the edge of the ZOB, because weakly bound hydrocarbon molecules on the surface diffuse towards the ZOB and are deposited at its rim [24], which prevents contamination in the central region. Thus, the unscattered electrons do not experience any positive phase shift but a negative phase shift instead due to elec-tron stimulated desorption of the water dipole layer on the film surface. Although a positive phase shift should have been imposed on electrons passing through the con-tamination ring, the effect was not distinct enough to be resolved in the Thon ring pattern. However, the experi-mental results for case C show that the effect evoking a negative phase shift can also occur at room temperature leading to even higher negative values of ϕPP(0).
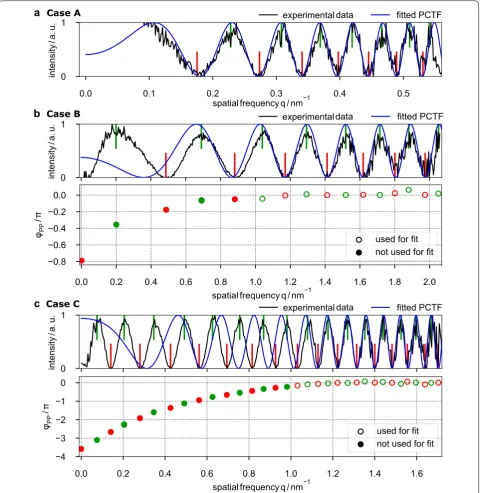
For an analysis of the phase shift profile, the Thon ring patterns obtained from the last image of each time series will be discussed in the following. An azimuth-ally averaged intensity profile of the experimental Thon ring pattern (black line) and the fitted PCTF (blue line) are shown in Fig. 2a for case A (small ZOB, unheated HFPP) after 30 s of illumination. The complete Thon ring pattern can be well fitted with ϕPP(0)=(2.76±0.06)π
and �f =(−9.63±0.12) µm indicating a vanishing extension of the phase-shifting patch.
Figure 2b shows the Thon ring pattern for case B (small ZOB, HFPP temperature 200 °C) after 150 s of illumina-tion. A q-dependence of the phase shift causes an addi-tional unknown shift of the inner Thon rings. Therefore, only spatial frequencies with q>1 nm−1 were considered
for the fit, which yields ϕPP(0)=(−0.82±0.05)π and �f =(−0.65±0.13) µm. The difference between the experimental data and the fit (cf. “Phase shift determina-tion and HFPP TEM imaging”) yields the phase shift pro-file ϕPP(q) , which is shown in the lower graph of Fig. 2b.
The outer radius of the phase-shifting patch on the HFPP in the BFP is given by r≈1 nm−1
·e·L=4µm (focal
length L=1.7 mm , e=2.51 pm ), which clearly exceeds
the ZOB radius of 100 nm.
A discrepancy between the PCTF fit and the experi-mental Thon ring pattern is also found for case C (large ZOB, no HFPP heating) after 150 s of HFPP illumina-tion, as shown in Fig. 2c. The fit of the Thon ring pattern for q>1 nm−1 yields ϕ
PP(0)=(−3.55±0.11)π and
�f =(−1.73±0.03) µm. The resulting ϕPP(q) is plot-ted in the lower graph of Fig. 2c. The measurements for case C are qualitatively equivalent to the results for case B, but the phase shift is more pronounced. This can be explained by two effects. It was suggested that the nega-tive ϕPP(0) increases with the diameter of the charged patch [20]. In addition, the concentration of adsorbed molecules should be higher at low temperature, leading to a higher work function. At this point, it is not possible to identify the dominant effect and additional measure-ments are required for clarification.
An indication that the ϕPP profile may extend to even higher q can be seen in Fig. 1f (case B) and i (case C), where the fitted defocus values increase in magnitude over time by about 5% or 18%, respectively. The variation of the fitted defocus values suggests that ϕPP(q) has still
not completely dropped to zero for the fitted Thon rings, which leads to an error in the determination of f and
ϕPP . For a more precise determination of ϕPP(0) , damping by partial coherence of the electron wave at high q values could be reduced using a smaller defocus. On the other hand, this would yield a smaller number of Thon rings and thus less information on the ϕPP profile. Either way, the HFPP performance depends strongly on the phase shift profile at low spatial frequencies.
We add that for case A (positive phase shift), it might be possible that a negative phase shift builds up simultane-ously, but is not visible in the measurement, because only the first 30 s of HFPP illumination could be analyzed. In fact, additional measurements at HFPP film temperatures of 100 °C (not shown here), where contamination builds up more slowly, showed both positive and negative phase shifts. This is in agreement with the findings from [4, 20] and indicates that contamination and negative charging can occur simultaneously.
HFPP TEM imaging of CNT bundles
experimental
experimental
experimental
b
Case Ba
Case Ac
Case CFig. 2 Thon ring patterns of images of an amorphous carbon sample taken with an HFPP operated under case A, B, C conditions and corresponding phase shift profiles ϕPP(q) . a Case A (small ZOB diameter ~ 100 nm, unheated HFPP) with experimental Thon ring pattern
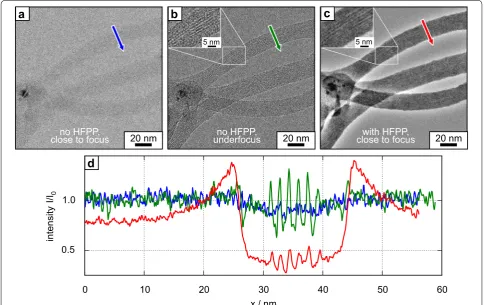
CNT sample. Application of the HFPP under case B conditions (small ZOB, HFPP temperature 200 °C) is illustrated in Fig. 3. Conventional bright-field TEM images of CNT bundles in focus and at an underfo-cus of − 330 nm are shown in Fig. 3a, b. CNT bun-dles are barely visible in Fig. 3a as expected for phase objects. Defocusing leads to contrast enhancement and the appearance of Fresnel fringes at the bundle edges (Fig. 3b). Inserting the HFPP with ϕPP(0)= −0.8π
close to focus (Fig. 3c) strongly enhances the contrast, whereby CNT bundles and CNTs within the bundles (inset in Fig. 3c) become visible. Intensity line profiles from the same sample position (arrows in Fig. 3a–c), normalized with respect to the vacuum intensity I0 , are shown in Fig. 3d and reveal contrast enhancement of the HFPP image (red line) compared to the conven-tional in-focus TEM image (blue line). In contrast to a Zernike PP [6, 25], fringing artifacts due to the abrupt onset of �ϕPP(q) do not emerge. However, a bright halo occurs at the edge of the CNT bundles, which can be
attributed to the extended phase shift profile (cf. Fig. 2) and will be verified by simulations in the next section.
Figure 4 illustrates the phase-shifting behavior under case A conditions (small ZOB, unheated HFPP). Fig-ure 4a–c presents HFPP TEM images of CNT bundles during build-up of an increasingly positive phase shift after 2, 6, and 12 s which results from contamination growth. A smaller magnification was used here, because the fast build-up of contamination required shorter expo-sure times. CNT bundles and some catalyst agglomerates are clearly visible. The images show contrast reversals, which are particularly well visible for the CNT bundles in the central part of the images. The CNT contrast is reversed from bright (Fig. 4a) to dark (Fig. 4b) and bright again (Fig. 4c). Contrast reversals are also observed for the broad halos that surround the CNT bundles. Inten-sity line profiles across a CNT bundle (arrows in Fig. 4a– c) are shown in Fig. 4d. The complete image sequence is provided as Additional file 1. The contrast inversions in Fig. 4 are consistent with the measurement of the phase shift evolution over time (Fig. 1b). After 2, 6, and 12 s,
5 nm 5 nm
no HFPP,
close to focus underfocusno HFPP, close to focuswith HFPP,
a
20 nm
b
c
d
20 nm 20 nm
the phase shift is approximately ϕPP(0)= 0.5π , 1.5π and 2.5π , which leads to the observed contrast inversions. After 12 s, the background signal is reduced by 60% due to the increase of electron scattering in the contamina-tion deposited at the phase-shifting patch. Even though the small extension of the phase shift profile for positive phase shifts (see Fig. 2a) is advantageous, the strong sig-nal decrease makes this operation mode unsuitable for phase contrast imaging as long as contamination growth cannot be controlled.
Comparison between experimental and simulated HFPP images
We simulated HFPP TEM images of CNT bundles taking into account the extended phase shift profile of the HFPP and compared simulated and experimental images. The simulations provide instructive information on the shape
of ϕPP(q) and allow a quantitative understanding of arti-facts in HFPP TEM images.
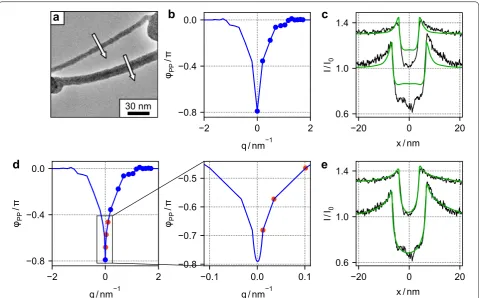
Figure 5a depicts an HFPP TEM image acquired under case B conditions, which is analyzed by simulations in this section. The black lines in Fig. 5c, e show inten-sity profiles across the small and the large CNT bundle in Fig. 5a. The intensity values of the small bundle are vertically shifted by 0.3 for better visualization. For the simulations, the bundles are approximated as homogene-ous cylinders with radius r yielding the object exit wave function exp(iφ(x)) , where φ(x)=2α√r2
−x2 is the projected phase of the cylinder and α is the phase shift
per unit length. The image intensity is simulated by a convolution of the exit wave and the point spread func-tion given by the inverse Fourier transform of the CTF e−i�ϕPP(q) (cf. Eqs. 1 and 3 without influence of defocus and spherical aberration). To reconstruct the phase shift profile, the results of the Thon ring analysis for case B
a
b
c
100 nm 100 nm 100 nm
t = 2 s t = 6 s t = 12 s
d
(lower graph in Fig. 2b) are used as a first approximation, because HFPP imaging and Thon ring analysis cannot be performed at the same time. Since only few data points are available for low q values, they have to be interpolated to obtain a smooth phase shift profile for the simulation. As an example, Fig. 5b shows the phase shift profile with a linear interpolation between the measured values (blue dots). The corresponding simulation (Fig. 5c) does not agree well with the experimental intensity profiles, even though a simultaneous fit of the small and the large bun-dle with respect to α is performed. To compensate for the lack of data points at low spatial frequencies, additional points (red dots) are added artificially between the first two blue points (Fig. 5d, e). The phase shift between the red data points is again interpolated linearly, except for the values around q=0 , where a parabola is used. The points are placed equidistantly along the ordinate axis, whereas their position along the abscissa is optimized by a fit routine. Furthermore, the experimental image shows
asymmetric halo intensities around the CNT bundles, which can be explained by a drift of the HFPP. For this, the right branch of the phase shift profile has to be elon-gated by 0.002 nm−1 , corresponding to a drift of 8.5 nm.
Taking all these modifications into account, the result-ing simulated image intensities for the small and the large CNT bundle are shown in Fig. 5e with the correspond-ing phase shift profile in Fig. 5d. The small elongation of the phase profile is hardly visible in the plots. The fitted value α= 0.033 rad/nm is in reasonable agreement with the literature value for a single CNT of α≈ 0.042 rad/nm [26] and corresponds to half of the phase shift caused by amorphous carbon, where α=CEVMIP=0.066 rad/nm [27]. The simulated image intensities in Fig. 5e agree well with the measured intensities for both CNT bun-dles. This demonstrates that the observed halo occurs due to the extended phase shift profile of the HFPP, hav-ing a sharp peak in the center with an extension similar to the size of the ZOB and long flat tails at higher spatial
d
e
30 nm
c
b
a
Fig. 5 Comparison of experimental and simulated image intensities of CNT bundles for an HFPP operated under case B conditions
frequencies, which qualitatively confirms the previous suggestions [20].
Conclusions
The phase-shifting behavior of HFPPs was studied under different operation conditions, namely, for two different ZOB diameters on the HFPP film (100 nm and 250 nm) and HFPP temperatures of 25 °C and 200 °C. A positive phase shift results from contamination at the region of the ZOB (small ZOB diameter, 25 °C). Negative phase shifts occur if contamination is prevented (small ZOB diameter, 200 °C and large ZOB, 25 °C) and are attrib-uted to a work function change in the region of the ZOB resulting from electron-beam-induced desorption of adsorbed molecules. The amount of phase shift is sug-gested to depend on the thickness of the adsorbed layer and thus on the HFPP film temperature as well as on the size of the area in which the molecules are desorbed. In addition, a gradual change of the phase shift ϕPP(q) as a
function of the spatial frequency is found for negative phase shifts, which largely exceeds the spatial frequencies that correspond to the ZOB diameter.
Strong contrast enhancement was observed for CNT bundles by in-focus HFPP TEM imaging for negative and positive ϕPP . The agreement of experimental and simu-lated image intensities of CNT bundles under negative phase-shifting conditions yields details on the shape of ϕPP(q) . It is characterized by a sharp peak at very low q values and a flat tail extending up to q≈1 nm−1 , which explains the observed halo-like image artifact. The simu-lations show that the shape of ϕPP(q) at low spatial fre-quencies is crucial for the HFPP performance. They also demonstrate that fitting to experimental image intensities is well suited to obtain additional information on ϕPP(q) of an HFPP at low spatial frequencies, which cannot be accessed by Thon ring analysis. This is on one hand important for a better understanding of the underlying physics and could on the other hand be used for object wave reconstruction by a deconvolution of the image with the point spread function.
Supplementary information
Supplementary information accompanies this paper at https ://doi. org/10.1186/s4067 9-019-0067-z.
Additional file 1: Video S1. Movie of a CNT sample acquired with an HFPP under case A operation conditions (positive phase shift) showing contrast inversions due to rapid contamination growth at the position of the intense ZOB on the HFPP film. Scale bar corresponds to 100 nm.
Abbreviations
aC: amorphous carbon; BFP: back focal plane; CNT: carbon nanotube; CTF: contrast transfer function; HFPP: hole-free phase plate; PCTF: phase contrast transfer function; PP: phase plate; TEM: transmission electron microscopy; ZOB: zero-order beam.
Acknowledgements
The authors are grateful to Patrice Brenner (Nanostructure Service Laboratory, Center for Functional Nanostructures, Karlsruhe Institute of Technology) for help with imaging the ZOB imprint in a scanning electron microscope and to Dr. Erich Müller (Laboratory for Electron Microscopy, Karlsruhe Institute of Technology) for fabrication of a TEM lamella of the HFPP film. We also thank Frank Landhäuser and Mario Nusche (Mechanical Workshop of the Physics Department, Karlsruhe Institute of Technology) for help with the construction of the HFPP heating device and Prof. Erdmann Spiecker (Friedrich-Alexander-Universität Erlangen-Nürnberg) for insightful discussions. We gratefully acknowledge funding of the project by the Deutsche Forschungsgemein-schaft (DFG) and by the Open Access Publishing Fund of the Karlsruhe Institute of Technology (KIT).
Authors’ contributions
MD and DG proposed the investigation. RP and MD performed the experi-ments and data analysis. MO contributed to the implementation and manipu-lation of the PP. MS and RP implemented the simumanipu-lations. SH contributed to the interpretation of the results. RP prepared the manuscript with contri-butions from SH, MS, MD and DG. All authors read and approved the final manuscript.
Funding
Funding was provided by the Deutsche Forschungsgemeinschaft (DFG) under Contract Number GE 841/26.
Availability of data and materials
Requests for materials should be addressed to DG (email: dagmar.gerthsen@ kit.edu).
Competing interests
The authors declare that they have no competing interests.
Author details
1 Laboratory for Electron Microscopy, Karlsruhe Institute of Technology (KIT),
Engesserstr. 7, 76131 Karlsruhe, Germany. 2 Physikalisches Institut, Karlsruhe
Institute of Technology (KIT), Wolfgang-Gaede-Str. 1, 76131 Karlsruhe, Germany.
Received: 9 April 2019 Accepted: 12 September 2019
References
1. Scherzer, O.: The theoretical resolution limit of the electron microscope. J. Appl. Phys. 20(1), 20–29 (1949). https ://doi.org/10.1063/1.16982 33 2. Zernike, F.: Phase contrast, a new method for the microscopic
observa-tion of transparent objects. Physica 9(7), 686–698 (1942). https ://doi. org/10.1016/S0031 -8914(42)80035 -X
3. Boersch, H.: Über die Kontraste von Atomen im Elektronenmikroskop. Z. Naturforsch. A 2(a), 615–633 (1947). https ://doi.org/10.1515/ zna-1947-11-1204
4. Malac, M., Hettler, S., Hayashida, M., Kawasaki, M., Konyuba, Y., Okura, Y., Iijima, H., Ishikawa, I., Beleggia, M.: Computer simulations analysis for determining the polarity of charge generated by high energy elec-tron irradiation of a thin film. Micron 100, 10–22 (2017). https ://doi. org/10.1016/j.micro n.2017.03.015
5. Glaeser, R.M.: Methods for imaging weak-phase objects in electron microscopy. Rev. Sci. Instrum. 84(11), 111101 (2013). https ://doi. org/10.1063/1.48303 55
6. Danev, R., Nagayama, K.: Transmission electron microscopy with Zernike phase plate. Ultramicroscopy 88(4), 243–252 (2001). https ://doi. org/10.1016/S0304 -3991(01)00088 -2
7. Danev, R., Glaeser, R.M., Nagayama, K.: Practical factors affecting the per-formance of a thin-film phase plate for transmission electron microscopy. Ultramicroscopy 109(4), 312–325 (2009). https ://doi.org/10.1016/j.ultra mic.2008.12.006
9. Malac, M., Beleggia, M., Kawasaki, M., Li, P., Egerton, R.F.: Convenient contrast enhancement by a hole-free phase plate. Ultramicroscopy 118, 77–89 (2012). https ://doi.org/10.1016/j.ultra mic.2012.02.004
10. Danev, R., Buijsse, B., Khoshouei, M., Plitzko, J.M., Baumeister, W.: Volta potential phase plate for in-focus phase contrast transmission electron microscopy. PNAS 111(44), 15635–15640 (2014). https ://doi.org/10.1073/ pnas.14183 77111
11. Asano, S., Fukuda, Y., Beck, F., Aufderheide, A., Förster, F., Danev, R., Baumeister, W.: A molecular census of 26S proteasomes in intact neurons. Science 347(6220), 439–442 (2015). https ://doi.org/10.1126/scien ce.12611 97
12. Mahamid, J., Pfeffer, S., Schaffer, M., Villa, E., Danev, R., Kuhn Cuellar, L., Förster, F., Hyman, A.A., Plitzko, J.M., Baumeister, W.: Visualizing the molec-ular sociology at the HeLa cell nuclear periphery. Science 351(6276), 969–972 (2016). https ://doi.org/10.1126/scien ce.aad88 57
13. Khoshouei, M., Radjainia, M., Baumeister, W., Danev, R.: Cryo-EM structure of haemoglobin at 3.2 Å determined with the Volta phase plate. Nat. Commun. 8, 16099 (2017). https ://doi.org/10.1038/ncomm s1609 9 14. Liang, Y.L., Khoshouei, M., Radjainia, M., Zhang, Y., Glukhova, A., Tarrasch,
J., Thal, D.M., Furness, S.G.B., Christopoulos, G., Coudrat, T., Danev, R., Baumeister, W., Miller, L.J., Christopoulos, A., Kobilka, B.K., Wootten, D., Skiniotis, G., Sexton, P.M.: Phase-plate cryo-EM structure of a class B GPCR-G-protein complex. Nature 546(7656), 118–123 (2017). https ://doi. org/10.1038/natur e2232 7
15. Danev, R., Tegunov, D., Baumeister, W.: Using the Volta phase plate with defocus for cryo-EM single particle analysis. eLife 6, e23006 (2017). https ://doi.org/10.7554/elife .23006
16. Kotani, A., Harada, K., Malac, M., Salomons, M., Hayashida, M., Mori, S.: Observation of FeGe skyrmions by electron phase microscopy with hole-free phase plate. AIP Adv. 8(5), 055216 (2018). https ://doi. org/10.1063/1.50283 98
17. Fukuda, Y., Laugks, U., Lučić, V., Baumeister, W., Danev, R.: Electron cryoto-mography of vitrified cells with a Volta phase plate. J. Struct. Biol. 190(2), 143–154 (2015). https ://doi.org/10.1016/j.jsb.2015.03.004
18. Hettler, S., Dries, M., Hermann, P., Obermair, M., Gerthsen, D., Malac, M.: Carbon contamination in scanning transmission electron microscopy and its impact on phase-plate applications. Micron 96, 38–47 (2017). https ://doi.org/10.1016/j.micro n.2017.02.002
19. Willasch, D.: High resolution electron microscopy with profiled phase plates. Optik 44, 17–36 (1975)
20. Hettler, S., Kano, E., Dries, M., Gerthsen, D., Pfaffmann, L., Bruns, M., Beleggia, M., Malac, M.: Charging of carbon thin films in scanning and phase-plate transmission electron microscopy. Ultramicroscopy 184(A), 252–266 (2018). https ://doi.org/10.1016/j.ultra mic.2017.09.009 21. Hettler, S., Onoda, J., Wolkow, R., Pitters, J., Malac, M.: Charging of electron
beam irradiated amorphous carbon thin films at liquid nitrogen tempera-ture. Ultramicroscopy 196, 161–166 (2019). https ://doi.org/10.1016/j.ultra mic.2018.10.010
22. Marko, M., Hsieh, C., Leith, E., Mastronarde, D., Motoki, S.: Practical experi-ence with hole-free phase plates for cryo electron microscopy. Microsc. Microanal. 22(6), 1316–1328 (2016). https ://doi.org/10.1017/S1431 92761 60119 6X
23. Barthel, J., Thust, A.: Aberration measurement in HRTEM: implementation and diagnostic use of numerical procedures for the highly precise recog-nition of diffractogram patterns. Ultramicroscopy 111(1), 27–46 (2010). https ://doi.org/10.1016/j.ultra mic.2010.09.007
24. Hren, J.: Specimen contamination in analytical electron microscopy: sources and solutions. Ultramicroscopy 3, 375–380 (1978). https ://doi. org/10.1016/S0304 -3991(78)80057 -6
25. Dries, M., Obermair, M., Hettler, S., Hermann, P., Seemann, K., Seifried, F., Ulrich, S., Fischer, R., Gerthsen, D.: Oxide-free aC/Zr0.65Al0.075Cu0.275/aC phase plates for transmission electron microscopy. Ultramicroscopy 189, 39–45 (2018). https ://doi.org/10.1016/j.ultra mic.2018.03.003
26. Tonomura, A.: Electron holography, 2nd edn. Springer-Verlag, Berlin (1999). https ://doi.org/10.1007/978-3-540-37204 -2
27. Wanner, M., Bach, D., Gerthsen, D., Werner, R., Tesche, B.: Electron holog-raphy of thin amorphous carbon films: measurement of the mean inner potential and a thickness-independent phase shift. Ultramicroscopy 106(4–5), 341–345 (2006). https ://doi.org/10.1016/j.ultra mic.2005.10.004
Publisher’s Note