2987 DOI:10.21276/ijprhs.2019.03.07
Mastiholimathet al. CODEN (USA)-IJPRUR, e-ISSN: 2348-6465
Original Article
Formulation and Evaluation of Ketoprofen Gel
Containing Solid Lipid Nanoparticles for Topical
Application and its Suitable Analytical Method
Development and Validation
V S Mastiholimath
1,*, D’souza J
F
1, V S Mannur
1, P M Dandagi
2, A P Gadad
2Department of Pharmaceutical Quality Assurance, KLE College of Pharmacy, KAHER, Belagavi, Karnataka, India-590010. Department of Pharmaceutics, KLE College of Pharmacy, KAHER, Belagavi, Karnataka, India-590010.
A R T I C L E I N F O A B S T R A C T
______
1. INTRODUCTION
Nanoparticles are colloidal particles having particle size between 10-1000nm 1. The drug may be dissolved, encapsulated, entrapped or attached to a nanoparticle matrix. The various types of nanoparticles include inorganic nanoparticles, polymeric nanoparticles, solid lipid nanoparticles, liposomes, nanocrystals, nanotubes and dendrimers 2. Solid Lipid Nanoparticles (SLNs) are
International Journal of Pharma Research and Health Sciences
Available online at
www.pharmahealthsciences.net
Received: 04 Jun 2019 Accepted: 28 Jun 2019
The study was aimed to formulate Ketoprofen loaded solid lipid nanoparticles which are later incorporated into a 1% carbopol gel. Four formulations were formulated with different concentrations of tween 80 and GMS. Hot homogenization method followed by ultra-sonication was used for the preparation of solid lipid nanoparticles. The optimized formulation F3 showed particle size of 90.70 nm, PDI 0.2931, % drug content 89.73%, drug entrapment 79.03%. The in vitrodrug release (F1-F4) ranged from 74.438-94.087%. Shape and surface morphology of F3 showed that the nanoparticles had irregular rod shaped structure. The gel was evaluated for its pH, spreadability, and viscosity. The gel FG3 showed drug content of 100.5% when analyzed by HPTLC. The in vitro drug release of the formulations FG1-FG4 varied from 68.14-88.07%. A simple, precise, accurate and specific high performance thin layer chromatographic (HPTLC) method was developed for the estimation of Ketoprofen in the pharmaceutical dosage form. Merck HPTLC aluminium plates pre-coated with silica gel G 60 F - 254 (20×10cm) with a thickness of 250 µm were used for separation. The optimized mobile phase developed was Chloroform: acetone : methanol : glacial acetic acid (9:0.5: 0.5:0.2 v/v/v/v). Densitometric scanning was done at 263 nm. The drug was resolved with Rfvalue of 0.396
Keywords: Ketoprofen, NSAID, solid lipid nanoparticles, hot homogenization, HPTLC
Corresponding author *
V.S. Mastiholimath
KLE College of Pharmacy, KAHER, Belagavi, Karnataka, India-590010.
submicron sized lipid emulsions containing solid lipid carrier, usually for lipophilic pharmaceuticals3.
Ketoprofen (KP) is an NSAID taken for the cure of acute and chronic rheumatoid arthritis. Ketoprofen is less soluble in water and thus has a poor dissolution rate, decreasing the gastrointestinal absorption. It has a short half-life, and causes gastrointestinal irritation and has an ulcerogenic effect and thus developed as transdermal formulations to reduce these adverse effects4.
Solid Lipid Nanoparticles and its dermal delivery of drugs 5: Targeted drug molecule transport to the skin is a
challenging area of research in the pharmaceutical development due to the structure of the skin. The dermis has a complex structure due to the presence of sweat glands, hair follicles and blood vessels. Drug molecules can penetrate the skin through three routes: Intra cellular transport, inter cellular transport and skin appendageal transport.
High Performance Thin Layer Chromatography (HPTLC) Method Development and Validation: HPTLC
method can be used for qualitative and quantitative analysis tasks such as identification and quantitation of components, active constituents, impurities and also for process development and optimization, and process monitoring. HPTLC has been well established to provide exceptional separation, qualitative and quantitative analysis of variety of compounds, such as botanical and herbal nutritional supplements, nutraceuticals, traditional and foreign medicines, determination of radiolabelled substances in chemical, biochemical, biological and pharmaceutical samples6, 7, 8.
2. MATERIALS AND METHODS
Ketoprofen was obtained as gift sample from Cadila Healthcare Ltd, Ahmedabad, glycerol monostearate was obtained from Ozone International, Mumbai. Tween 80 was obtained from M/s HiMedia Laboratories Pvt. Ltd, Mumbai. Glycerin was procured from M/s Hi-media Pvt Limited, Mumbai. Carbopol 934 was obtained from Himedia Pvt Ltd India and Triethanolamine was obtained from Merck Pvt Ltd Mumbai, India.
Preformulation study:
The primary procedure in rational development of dosage forms of a drug substance is Preformulation testing. Preformulation testing or study is method of optimization of drug delivery and determining physicochemical properties of the new compound which affects drug performance and development of a proper safe; stable dosage form.9, 10
A) Identification: FTIR Spectroscopy
1. Solid samples: IR spectral analysis of Ketoprofen was carried out. The physical mixture of ketoprofen with
excipients was also analyzed and the spectra’s were
matched to reference std IR spectrum of KP.
2. Liquid sample: The nanosuspension containing ketoprofen encapsulated solid lipid nanoparticles were
centrifuged at 12000rpm for 30 mins and the solid residue was dried at 65⁰C. This residue was analyzed by diluting with KBr and was recorded on a Thermo Scientific FT-IR Spectrometer to 4000-400cm-1 at a resolution of 4cm-1.
Determination of melting point: Thiele’s tube apparatus
was used to determine the melting point of Ketoprofen. Melting point of a drug sample is an indication of purity of a sample. The occurrence of even a small quantity of impurity can be identified by lowering as well as widening in the melting point range.
Solubility: Solubility analysis was done to detect a suitable
solvent system to dissolve the drug, lipid and various excipients for the formulation of nanoparticles.
Determination of absorbance maximum of Ketoprofen:
100 mg of Ketoprofen was accurately weighed and was dissolved in 10 ml of phosphate buffer pH 7.4 and volume adjusted to 100ml. 10 ml of this solution was diluted to 100 ml with phosphate buffer pH 7.4 (100 µ g/ml) and examined in the range 400-200 nm on UV-Visible Spectrophotometer
against blank. λmax for Ketoprofen is the maximum
absorbance obtained. The absorption maximum was found to be 253 nm. This stock solution was used for the preparation of standard calibration curve.
B) Compatibility studies
FTIR spectroscopy: Drug lipid interaction was carried out
by IR spectroscopy. IR spectra of Ketoprofen and its physical mixture with lipid GLYCEROL MONOSTEARATE and also with the lipid GLYCEROL MONOSTEARATE and gelling agent CARBOPOL were studied over a frequency range of 4000-400cm-1 at a resolution of 4cm-1.
Differential Scanning Calorimetry: DSC was carried out
by using Shimadzu-DSC-TA 60. The aluminum pans were crimped after the sampled was placed in it. The reference consisted of an empty pan. The pans were heated under the flow of nitrogen gas at a rate of 5⁰C/min from 30⁰C-250⁰C.
C) Standard calibration curve of Ketoprofen: 100 mg of Ketoprofen was accurately weighed and was dissolved in 10 ml of phosphate buffer pH 7.4 and volume adjusted to 100ml. 10 ml of this solution was diluted to 100 ml with phosphate buffer pH 7.4 (100 µ g/ml). From this stock solution, aliquots of 0.5, 1.0, 1.5, 2.0, 2.5, 3.0, 3.5 ml were withdrawn and the volume was made up to 25 ml with phosphate buffer pH 7.4 to obtain a concentration of 2-14 µ g/ml respectively. The absorbance was measured at 253 nm by UV-Visible spectrophotometer. The standard curve was plotted for the entire range from 2-14µ g/ml11.
Preparation of Ketoprofen solid lipid nanoparticles
2989
glycerol monostearate were melted and mixed on a magnetic stirrer maintained at 80⁰C while on a separate magnetic stirrer at the same temperature; millipore water and surfactant were mixed. The drug-lipid mixture was added dropwise to the surfactant solution and allowed to homogenize for 15mins on a magnetic stirrer. A white milky solution was formed containing ketoprofen encapsulated solid lipid nanoparticles. Prepared solid lipid nanoparticles were stored in amber coloured bottle for further analysis. Table 1: Formulation table of Ketoprofen loaded solid lipid nanoparticles
Sr. No.
Formulation code
Drug (Ketoprofen) mg
Lipid (Glycerol monostearate) mg
Surfactant (tween 80) %
1. F1 250 500 0.5
2. F2 250 750 1.0
3. F3 250 500 0.5
4. F4 250 750 1.0
Evaluation parameters for Ketoprofen solid lipid nanoparticles:
1. Particle size: The particle size and polydispersity index
of the prepared solid lipid nanoparticles was measured using nanotrac where solid lipid nanoparticle suspensions were diluted appropriately with millipore water and analysed.
2. Polydispersity index: Polydispersity index can be
measured from dynamic light scattering instrument. Polydispersity index is an index of width or spread within the particle size distribution. Low PDI value indicates that the samples contained monodispersed particles, while a higher PDI indicates a varied particle size distribution and the polydisperse nature of the formulation.
3. Entrapment efficiency: Percentage Entrapment efficiency of solid lipid nanoparticle formulations was carried out by using ultracentrifugation method. 1ml of solid lipid nanoparticle suspension was taken and ultra-centrifuged at 14,000rpm, 4oC for 1hr (Sorval MX 150, Thermo scientific Ultracentrifuge, US). The supernatant liquid was separated and was analysed for un-entrapped
drugat λ max of 253 nm by UV spectrophotometry.
4. Drug content: The nanosuspension containing 50mg
equivalent drug was put in a 50 ml volumetric flask whose volume was made up using methanol. This concentration is 1000 µ g/ml. After a few minutes the solution was filtered and the first few ml of the filtrate was rejected. 5ml of this filtrate was further diluted to 50ml with pH 7.4 in a volumetric flask. 10 µ g/ml solution was obtained by further diluting 1 ml to 10 ml with phosphate buffer pH 7.4 in a 10 ml volumetric flask. Absorbance was measured spectrophotometrically at 253nm.
5. TEM and SEM Analysis: The morphology of solid
lipid nanoparticle was analyzed by transmission electron microscopy (JEM-2100, JEOL. Japan). Solid lipid nanoparticle Suspension was diluted with water; a drop of the diluted suspension was then directly deposited on a carbon coated grid for 2 min, negatively stained with 1% aqueous solution of phosphotungestic acid. Then air dried sample was visualized under Transmission electron microscope. The surface morphology of ketoprofen solid lipid nanoparticle was analysed by scanning electron microscopy. The dried SLNs were mounted on metal stubs and coated with Platinum using a Sputter Coater JFC-1600 (JEOL, Japan) and were then observed under JSM-6360LV Scanning Electron Microscope (JEOL, Japan) .
6. In-vitro drug release: In-vitro release studies were
performed using modified Franz diffusion cell12. Dialysis membrane (Himedia laboratories Pvt Ltd) having pore size 2.4 nm, molecular weight cut off 12,000–14,000 was used. 50 ml of Phosphate Buffer pH 7.4 was taken in receptor compartment. 2 ml equivalent to 5 mg of solid lipid nanoparticle suspension was taken in donor compartment. The temperature was set at 37oC with continuous stirring. Aliquots were collected at predetermined interval and replaced with equal amounts of fresh buffer. Aliquots were diluted with phosphate buffer pH 7.4 and analyzed at 253 nm by UV-1800 (Shimadzu, Japan).
Preparation of gel
The gel containing KP-SLNs was developed by using the required quantity of carbopol 934 which is a gelling agent. To the nanosuspension containing SLNs the required quantity of glycerin was added which acts as a humectant. Carbopol was added to double distilled water to get hydrated for 4-5hours. To this the SLNs equivalent to 0.25% of ketoprofen was added. Triethanolamine was added to the carbopol dispersion under stirring at 1200rpm. The gel was kept overnight to remove the entrapped air. The gel was then assessed for physical appearance, pH, drug content, viscosity, spreadability and in vitro drug release studies. Table 2: Formulation of a gel containing KP-SLNs
Ingredients Composition (%w/w)
Carbopol 934 1
SLN eq. to 0.25% KP 1
Glycerin 10
Triethanolamine q.s
Distilled water q.s
Evaluation of gel:
1.
pH and viscosity of gel: The pH of the gel was
2.
Drug content: A specific quantity of prepared gel wastaken and dissolved in 100ml of methanol and it was set aside for sonication for 30mins. The solution of 1ml was diluted to 10ml with phosphate buffer pH 7.4. After suitable dilution drug absorbance was recorded by uv-spectrophotometer at 253 nm.
3.
Spreadability: It was estimated by taking 2 slides of10x10cm each. One slide is kept fixed which contains 25mg of the gel. The other slide is placed over this on which 5 grams of the weight is placed on top. This slide is kept in the unchanged position for 5mins & the weight is then removed & the time to move the upper slide was checked Less the time for the separation of the two slides, better the spreadability of the gel. This is calculated by using the formula
S = M . L / T
Where, M = weight tied to the upper slide, L = length of the glass slide, T = time taken to separate the slides
4.
In-vitro drug release studies: The study was done in amodified Franz Diffusion cell using dialysis membrane-150 (cut off molecular weight 12000-14000 Dalton). The membrane was saturated in PBS pH 7.4 for 24 hrs. The membrane was clamped within the donor and the receptor compartment. 1 gram of the gel was evenly spread on the DM. 50ml of PBS pH 7.4 was used as the dissolution medium, which was added to the receptor. The entire assembly was paced on a magnetic stirrer and the solution was stirred continuously with the aid of a magnetic bead and the temperature was maintained at 37±0.5⁰C. 2ml of the sample was withdrawn at 0, 0.5, 1, 2, 3, 4, 5, 6, 7, 8, 9, 10, 11 and 12hrs intervals and was replaced with 2ml of fresh PBS pH 7.4 ( dilution medium). Dilutions were made and the sample was examined by UV-VIS spectrophotometer at 253nm and the %CDR was calculated. The graph of %CDR v/s time was plotted.
HPTLC METHOD DEVELOPMENT AND
VALIDATION
1. Selection of detection Wavelength:
Solutions of Ketoprofen (10μg/ml) was prepared in methanol
and the λmax was determined by scanning within 400–200
nm.The λmaxof “ketoprofen” was found to be 263 nm.
2. Mobile Phase Selection
Preparation of mobile phase: The mobile phase comprising of Chloroform: Acetone : Methanol: Glacial acetic acid in the ratio of 9: 0.5: 0.5: 0.2 v/ v/ v/ v was prepared for the elution.
Diluent preparation: The diluent chosen was methanol Standard preparation: 10mg of Ketoprofen in10 ml with methanol. Standard solution of concentration of 0.1mg/ml was made from the stock by diluting 1 ml of the stock to 10ml with methanol and this standard solution was used for further analysis.
3. Application of developed method to pharmaceutical dosage form (assay of gel containing KP-SLNs) Test preparation (Gel loaded with KP-SLNs)
5 grams of the gel was accurately weighed and extracted with 8 ml of n-hexane. The resultant test solution contains 12.5 mg of Ketoprofen in it. Therefore each ml of the solution contains 1.56mg of the drug. The resultant concentration of the test solution is 1.56mg/ml which is further used to carry out assay of the gel.
Chromatographic conditions: HPTLC plates pre-coated
with silica gel mixture on aluminum sheets were used as fixed phase. The detection was carried out using a TLC scanner at 263 nm.
VALIDATIONPARAMETERS
1. Linearity: To estimate linearity, a conc. of 0.05 to 0.6
µ g/ ml for Ketoprofen, was applied to the plates from stock solutions of 0.1mg/ ml by diluting with the diluent. The calibration curve was developed by plotting the mean peak area (Y-axis) against the conc. (X-axis). 2. Precision: The precision of the analytical method was
calculated by analysis of several sampling of homogeneous sample. Standard deviation or RSD is used to express the precision. Intra-day and inter-day variation studies are used to express the precision of this method. Intra-day precision was examined in nine replicates of the standard solutions at concentration level of 0.2µ g/ spot for Ketoprofen carried out two times on the same day. The results of repeatability were
reported in terms of “relative standard deviation
(%RSD).Inter-day precision was done by repeating the same procedure on two different days.
3. Accuracy: Accuracy was determined in triplicate by
spiking the pure drugs of the standard concentrations of Ketoprofen (0.1mg/ml) with the formulation (gel loaded with KP-SLN) at 3 different levels (80, 100 and 120%)
and comparing the area’s attained with those of the
formulation an d standards applied independently at the same level (80, 100 & 120%) . The recovery study outcomes were depicted in Table No 14 and Fig. 21. 4. Specificity: Specificity was carried out by using
standard Ketoprofen, formulation, mobile phase and the diluents on the plates. Peaks from all were observed to determine if there is any interference from the mobile phase and diluents.
3. RESULTS AND DISCUSSION
A. Identification of pure drug
FT-IR spectroscopy: The FT-IR spectrum of Ketoprofen
2991
Table 3: Frequencies and respective functional groups of pure KP Frequency (cm-1
) Functional Group
2845.39 C-H str
2727.3 O-H str
1560.8 C=O str
715.02 Ar-OH
Fig. 1: FTIR spectrum of Ketoprofen
Melting point determination: The melting point of
Ketoprofen was observed as 92⁰C, which is in reported value of 91⁰C-95⁰C. It complies with USP standards thus; it indicates the pureness of drug sample
Solubility analysis: Ketoprofen is poorly in water (0.051mg/ml). It was observed to be freely soluble in methanol and chloroform.
Lipid screening: Prior to formulation of Ketoprofen loaded solid lipid nanoparticles, screening of lipids was carried out to identify the most suitable lipid for the active ingredient to be incorporated in the solid lipid nanoparticles. Ketoprofen showed maximum solubility in glycerol monostearate. The solubility is in the order of glycerol monostearate> stearic acid> beeswax.
Determination of absorbance maximum of Ketoprofen:
The absorption spectrum of pure Ketoprofen was scanned within 400 to 200 nm on UV-VIS Spectrophotometer with conc. of 100 µ g/ml in phosphate buffer pH 7.4. The maximum absorption was obtained at 253 nm.
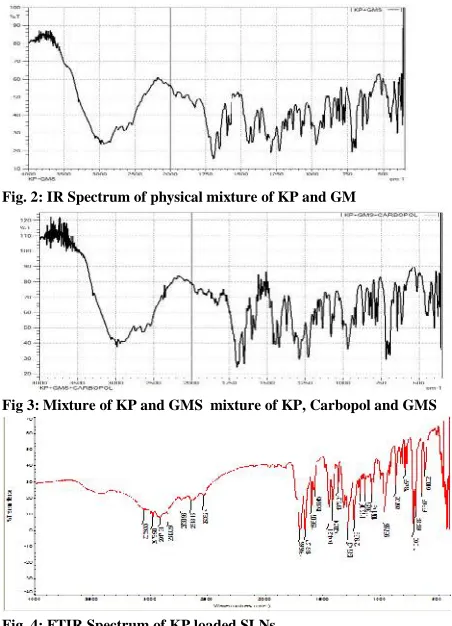
B) Compatibility study
FTIR Spectroscopy: For studying the probable drug-lipid
interaction, the IR (4000-400cm-1) spectroscopy was done. Similar peaks were seen in physical mixture drug- lipid and drug, lipid and carbopol. The IR spectrum of the pure drug and drug with the lipid and carbopol are shown in Fig4-7. The spectrum of Ketoprofen and the physical mixtures of Ketoprofen with the excipients are listed in table with their functional groups at their frequencies in table 6.
Table 4: FTIR Spectral data of pure Ketoprofen, physical mixtures and optimized formulation F3
Functional group
Frequency (cm-1 )
KP KP+GMS KP+GMS+
Carbopol
Optimised formulation F3
C-H str 2845.39 2917.34 2976.50 2843.39
O-H str 2727.3 2843.39 2730.98 2730.98
C=O str 1560.8 1550.7 1560.3 1596.07
Ar-OH 715.02 790.20 710.06 710.60
Fig. 2: IR Spectrum of physical mixture of KP and GM
Fig 3: Mixture of KP and GMS mixture of KP, Carbopol and GMS
Fig. 4: FTIR Spectrum of KP loaded SLNs
Table 5: FTIR Spectral data of pure Ketoprofen, physical mixtures and optimized formulation F3
Functional group
Frequency (cm-1 )
KP KP+GMS KP+GMS+ Carbopol
Optimised formulation F3
C-H str 2845.39 2917.34 2976.50 2843.39 O-H str 2727.3 2843.39 2730.98 2730.98 C=O str 1560.8 1550.7 1560.3 1596.07
Ar-OH 715.02 790.20 710.06 710.60
Differential Scanning Calorimetry: The thermograms of
the physical mixtures of KP and GMS, and KP and the excipients showed characteristic peaks at 88.46 and 60.37 for KP and GMS respectively. Thus signifying no physical interaction between the drug and the lipid, and the drug with the excipients. Therefore we can conclude that the drug is compatible with the lipid and the other
excipients.
Fig 6: Thermogram of Physical mixture of KP and GMS mixture of KP and excipients
Calibration Curve of Ketoprofen: The absorbance of
standard solution of Ketoprofen from 2-14 µ g/ml in pH 7.4
PBS was measured at λmax 253 nm (Table 7) and standard
calibration curve was plotted. It was noted that the drug
follows Beer Lambert’s law in concentration range 2-14 µ g/
ml in the medium.
Table 6: Standard calibration curve of Ketoprofen Concentration (µg/ml) Absorbance
0 0
2 0.113
4 0.211
6 0.341
8 0.424
10 0.532
12 0.645
14 0.748
Fig. 7: Calibration curve for KP
Preparation of Ketoprofen solid lipid nanoparticles: The present study was focused on the preparation of Solid Lipid Nanoparticles. Preliminary studies were performed to optimize the concentrations glycerol monostearate and surfactant. Solid lipid nanoparticle formulations F1-F4 were successfully prepared and subjected to various evaluation parameters. Based on the best obtained results one formulation was optimized and subjected for the preparation of gel.
Evaluation of Ketoprofen Solid lipid nanoparticles
Particle size: Particle size measurement was required to confirm the production of the particles in required range. Particle size data for the solid lipid nanoparticles by using different ratios of glycerol monostearate and surfactant are shown in Table 2. The mean particle size of Ketoprofen solid lipid nanoparticle formulations were found in the range of 90.7 nm to 156.7 nm. The solid lipid nanoparticle formulation F4 showed largest mean particle size whereas the formulation F3 showed smallest mean particle size.
Polydispersity index: The mean polydispersity index values for KP loaded SLN formulations varied from 0.2338 to 0.623
Entrapment efficiency: The entrapment efficiency percentage of solid lipid formulations range obtained from 72.62% to 83.89%. the highest drug entrapment efficiency was shown by formulation F4. The drug encapsulation efficiency of all formulations is shown in table 2.
Table 7: %EE, %yield, drug content, particle size and PDI of F1 to F4
Formulation % EE %yield %Drug content
Particle size (nm)
PDI
F1 72.62 80.35 91.95 100.6 0.359
F2 81.57 85.56 88.27 156.7 0.623
F3 79.03 89.73 94.32 90.7 0.2931
F4 83.89 83.91 82.41 136.3 0.2336
TEM and SEM: The TEM study suggested that the particles had an irregular rod shaped structure and were in required range of 100 nm as shown in Figure 1.
SEM study suggested that the particles were round in shape and there was no aggregations of particles were seen due to the presence of surfactant. As shown in Figure 2.
Fig 8: TEM image of optimized
Fig 9: SEM image of optimized
Formulation F3 at 100nm
Formulatiom F3 at 200nm In-vitro drug release
2993
Fig 10: in vitro drug release of KP-SLNs
Evaluation of Gel containing Ketoprofen solid lipid nanoparticles:
pH and viscosity of gel : The pH of all the FG3 gel formulation was found to be of 6.89 that suit the skin pH indicating the skin compatibility. The viscosity of the FG3 gel was found to be 10374 cps. The percentage drug content of optimized FG3 gel was found to be 100.5%. Which stated that drug was uniformly distributed in the gel.
Spreadability: The spreadability of the gel was found to be in the range of 3.64-4.32 gm.cm/s
Table 8: Physical appearance, pH, viscosity, and spreadability of the formulated gel
Formulation Physical appearance
pH Viscosity (cPs)
Spreadability (gm.cm/s)
FG1 White in colour, smooth texture
6.76 11245 3.95
FG2 White in colour, smooth texture
6.81 12059 3.64
FG3 White in colour, smooth texture
6.89 10374 4.32
FG4 White in colour, smooth texture
6.76 10952 4.09
In-vitro drug release : The In vitro drug diffusion study of the formulated solid lipid nanoparticle gels was found to be in the range of 68.14% to 88.07% at the end of 12 hrs and higher percentage cumulative drug release was found in FG3 formulation prepared with tween 80: glycerol monostearate ratio (1.:1) solid lipid nanoparticle suspension in carbopol 934(1%) i.e 88.07% and the lowest percentage cumulative drug release was found in the FG2 formulation with tween 80: ratio (1:0.75) with 1% carbopol 934 gel base shown release of 68.14%.
Fig 11: In vitro drug release studies of Ketoprofen solid lipid nanoparticle gel
Analytical method development and validation
Selection and optimization of mobile phase: It is of crucial in the development of a chromatographic technique for proper
separation, spot definition, resolution, symmetrical peak shapes and Rfreproducibility of the analytes.
Early trials of mobile phase were carried out with solvents such as chloroform, methanol, ethyl acetate, toluene and glacial acetic acid. It was noted that resolution of the drug was good but the Rfvalue was not sufficiently reproducible. The final mobile phase chosen was chloroform–acetone–
methanol–glacial CH3COOH (9: 0.5: 0.5: 0.2 v/v/v/v) as it showed best elution as well as reproducibility of the Rf value.
Thus, mobile phase optimized for separation was Chloroform: Acetone: Methanol: Glacial acetic acid in the ratio (9 : 0.5 : 0.5 : 0.2 v/ v/ v/ v).
Table 9: Optimized Chromatographic Conditions for HPTLC Analysis
Parameters Chromatographic Conditions Development chamber CAMAG Twin Trough Chamber
Stationary phase Silica gel G 60 F-254 precoated on aluminum sheet
Mobile phase Chloroform:acetone:methanol:glacial acetic acid (9:0.5:0.5:0.2 v/v/v/v)
Chamber saturation 20 minutes
Sample applicator CAMAG AUTOMATIC TLC SAMPLER 4
Band 8mm
Scanning speed 20mm/s
Development distance 80% of plate Drying of plate Room temperature Densitometric scanner CAMAG TLC SCANNER 4
Lamp Deuterium
Wavelength 263 nm
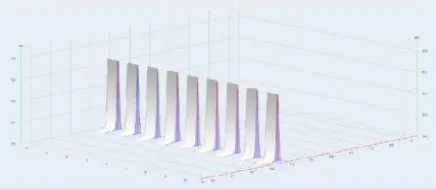
Fig 12: Chromatogram of method development of KP
Track I to VII: Ketoprofen ; Track VIII and IX: Formulation (Gel containing KP-SLNs)
Application of the developed formulation to a pharmaceutical dosage form (Assay of gel containing KP-SLNs)
Table 10: Assay of gel containing KP-SLNs
Drug Theoretical concentration (µg/spot)
Observed concentration (µg/spot)*
% Assay
KP 0.156 0.1568 100.5
* Average of two determinations
Fig. 13: Chromatogram for Assay of gel containing KP-SLNs I
Fig 14: Chromatogram for Assay of gel containing KP-SLNs II
Validation parameters
Linearity: Calibration graphs were constructed using peak areas of standard drug v/s. concentration of standard drug solutions. The data for linear regression presented a relationship over a conc. of0.5 to 6.0μg/ml with an equation
of Y= -1.492×10⁻¹⁴X+2.201×10⁻⁸X +1.073×10⁻³and R value
of 0.9991 for Ketoprofen. The ‘R’ values was above 0.995
Acceptance criteria: The correlation coefficient value
shouldn’t be less than 0.995 over the working range.
Table 11: Calibration data for Linearity KP by HPTLC
Sr no. Concentration Peak Area
1 0.05 µg/ml 0.00202
2 0.1 µg/ml 0.0029
3 0.2 µg/ml 0.00504
4 0.3 µg/ml 0.00635
5 0.4 µg/ml 0.00737
6 0.5 µg/ml 0.00827
7 0.6 µg/ml 0.00899
Concentration range 0.05-0.6 µg/ml Correlation coefficient 0.9991
Equation Y= -1.492×10 -14
X+2.201×10⁻⁸ X +1.073×10⁻³
Fig 15: Calibration Curve of KP by HPTLC
Fig 16: Chromatogram for linearity of Ketoprofen (0.05µg/ml-0.6µg/ml)
Precision: Data from precision experiments are tabulated in Table 15 for intra-day and Table 16 for Inter-day precision study for KP. On the same day, intra-day precision was carried out twice (replicate of 9 times).The %RSD values for intra-day precision study was found to be 0.001. Inter-day precision study was carried out on 2 different days (replicate of 9 times). The %RSD value for inter-day precision was observed to be 0.025. The %RSD values for intra-day and inter-day precision were found to be < 5.0 % for Ketoprofen which confirmed that the method was precise.
Acceptance criteria: %RSD of the 9 replicates shouldn’t be
more than5.0 %.
Table 12: Intra-day Precision data for KP
Sr.No. Concentration Mean area of peaks (n=9)
% RSD
1. 0.2 µg/ml 0.00467 0.00525
2. 0.2 µg/ml 0.00465 0.00403
Average 0.00466
%RSD 0.001
Table 13: Inter-day Precision data for KP.
Day Concentration Mean peak area ( n=9)
%RSD
1 0.2 µg/ml 0.00465 0.00403
2 0.2 µg/ml 0.00415 0.00574
Average 0.00440
%RSD 0.025
Fig 17: Chromatogram for Intra-day precision for KP I
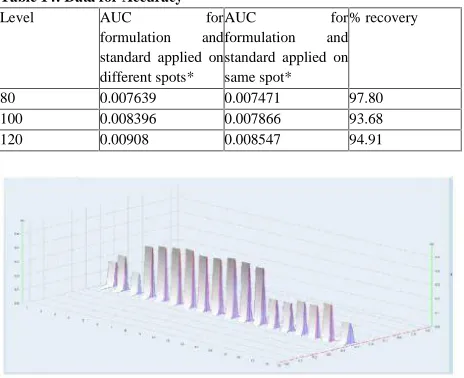
2995 Accuracy: It was conducted in triplicate by comparing the
areas of spiking the pure drug of KP with the formulation (gel containing KP-SLN) at 3 different levels (80%, 100% and 120%) with the area attained by spot application of the formulation and pure drugs. The % recovery of 97.80%, 93.68% and 94.91% for 80, 100 and 120% respectively. The mean recovery for KP was 95.47%. The method was found to be accurate as the % recovery was within the acceptance limits.
Acceptance criteria: % recovery should be in the range of 85-115%.
* corresponds the average of three determents Table 14: Data for Accuracy
Level AUC for
formulation and standard applied on different spots*
AUC for
formulation and standard applied on same spot*
% recovery
80 0.007639 0.007471 97.80
100 0.008396 0.007866 93.68
120 0.00908 0.008547 94.91
Fig 21: Chromatogram for KP (gel containing KP-SLN)
Track 1–3: Formulation (gel containing KP-SLN) at 100%; Track 4–
6: KP at 80% spiked with formulation at 100%; Track 7–9: KP at 100% spiked with formulation at 100%; Track 10 –12: KP 120% spiked with formulation at 100%; Track 13–14: KPat 80%; Track 15
–16: KP at 100%; Track 17–18: KP at 120%
Specificity: Specificity was carried out by application of the
standards, formulation, mobile phase and diluent. The Rf value of Ketoprofen was found to be 0.398. The Rfvalue of KP was found to be 0.396 which was similar to that of the standards further the mobile phase and diluents did not show any peaks at the Rf of the standards confirming the method is specific.
Table 15: Rf values of KP and Formulation
Standard Formulation
Rf 0.398 0.396
Fig 22: Chromatogram for specificity of the method
Track I: Mobile Phase; Track II: Diluent; Track III: Ketoprofen Standard; Track IV: Ketoprofen Formulation
4. CONCLUSION
In the present study, Ketoprofen loaded SLNs were prepared by hot homogenization method followed by ultra-sonication. These nanoparticles were examined for their particle size, PDI, shape and surface morphology, %drug entrapment efficiency, percentage yield, drug content and in vitro drug release. These SLNs were then loaded into a gel where Carbopol 934 was used as a gelling agent. The gels were later examined for their physical appearance, pH, viscosity, spreadability and in vitro drug release. The drug content was determined by HPTLC analysis.
From the results obtained of the Formulation studies it can be concluded that
1 The drug was found to be pure from its melting point determination and the IR spectrum analysis.
2 FTIR studies of pure Ketoprofen, the physical mixtures (KP+GMS, KP+GMS+Carbopol) and the formulation showed that the drug is compatible with all the excipients as there were no significant interactions seen. 3 The particle size decreased with the increase in the
surfactant concentration and decrease in the lipid concentration. The mean particle size varied from 90.70 to 156.7nm. The formulated optimized SLNs when subjected to SEM and TEM analysis showed that the nanoparticles were within the nano range and had an irregular rod shaped structure.
4 Drug entrapment efficiency was found to be higher in formulations containing a higher lipid concentration. The highest being showed by F4 (83.89%). The highest % yield was found to be 89.91%. It was noted that the % yield increased with the increase in the lipid concentration.
5 The optimized formulation F3 showed the highest in vitro drug release of 94.08% and the lowest was observed in formulation F2 (74.43%)
6 The gels were white in colour and had a smooth texture. The pH varied from 6.76 to 6.89. The viscosity varied from 10374 to 12095 cPs and the spreadability varied from 3.64 to 4.32 gm.cm/s.
7 The optimized formulation F3 showed the highest in vitro drug release of 88.7%% t:
8 In the present work the mobile phase selected was Cloroform:Methanol:Acetone:Glacial acetic acid in the ratio (9:0.5:0.5:0.2 v/v/v/v) and the chromatographic conditions were optimized.
9 Linearity was found over a concentration range of 0.05
to 0.6 μg/ml with an equation of Y= 1.492×10
-14X+2.201×10⁻⁸X +1.073×10⁻³and r value 0.9991 for Ketoprofen.
10 Intra-day and inter-day precision was found to be <5.0% which confirms that the developed method was precise. 11 The mean recovery for Ketoprofen was found to be
12 The Rf value of Ketoprofen from the formulation was found to be similar to that of the standard. The mobile phase and the diluent did not show any peaks at the Rf of the standard confirming that the method is specific.
5. REFERENCES
1. Khatra DS, Harikumar SL, Nirmala N. Nanoparticles: An Overview. J Drug Deliv Ther. 2016;3(2):1121–7. 2. Ekambaram P, Sathali a AH, Priyanka K. Solid Lipid
Nanoparticles : a Review. Sci Rev Chem Commun. 2012;2(1):80–102.
3. Bhatia S. Natural Polymer Drug Delivery Systems [Internet]. 2016. Available from: http://link.springer.com/10.1007/978-3-319-41129-3 4. Gauri N, Aditi L, Shikha A, Dubey PK. Solubility
enhancement of a poorly aqueous soluble drug ketoprofen using solid dispersion technique. Der Pharm Sin. 2011;2:67–73.
5. G. Kakadia P, R. Conway B. Solid Lipid Nanoparticles: A Potential Approach for Dermal Drug Delivery. Am J Pharmacol Sci. 2014;2(5A):1–7.
6. Patel R, Patel M, Dubey Nitin, Dubey N, Patel B. HPTLC Method Development and Validation: Strategy to Minimize Methodological Failures. Journal of Food and Drug Analysis 2012; 20:794-804.
7. Sherma J.Modern thin layer Chromatography. J AOAC Int. 2008; 91: 1142-4.
8. Chandra Andola D, Kant Purohit D. High Performance Thin Layer Chromatography (HPTLC): A Modern Analytical tool for Biological Analysis . Sciencepub.net.
2010. Available from:
http://www.sciencepub.net/nature/ns0810/09_3136ns08 10_58_61.pdf
9. Ghasemian E., Reszaeian B., Alaei S., et al. Optimization of Cefixime Nanosuspension to Improve Drug Dissolution. Pharmaceutical Sciences. 2015; 21(Suppl 1); 136-144.
10. Thadkala K., Nanam P. K., Rambabu B., et al. Preparation and characterization of amorphous ezetimibe nanosuspensions intended for enhancement of oral bioavailability. International Journal of Pharmaceutical Investigation 2014;4:3.
11. Near R, Bungalow B, Church RCM, Pradesh- a. Liquisolid compact technology : a novel approach for enhancement of dissolution and bioavailability of ketoprofen. 2016;3:794–80.