An Exploration Of Prediction Of Heart Disease
Using Machine Learning Classification
Pingali V Sai Naga Sravanthi, Dr. P. Rajesh
Abstract: Coronary illness shows the kind of condition which prompts heart glitch. Numerous remote correspondence advancements have been created for coronary illness prediction. Not all individuals with coronary vein ailment have chest torment as a side effect. Coronary illness causes many demises around the world. There are different factors, for example, Pressure Level, Serum - Cholesterin, Fasting - Blood Glucose, ECG, and many of significant Vessels or tubes Closed, Smoking, and Alcohol drinking which additionally results in coronary illness. In an underlying phase, expectation of coronary illness will spare human Existence. Machine Learning (ML) reports are truly important in the acknowledgment and examination of coronary disease. ML procedures such as; K Neighbors Classifier, Decision Tree Classifiers, Random Forest, Naïve Bayes and so on. are used in the Coronary illness prediction based on certain features. Main objective of this paper is to explore the distinctive parameters and its vitality in recognizing coronary ailment. Further, it additionally investigates the current methods and models utilized for the forecast so as to distinguish the calculation that best suits the coronary illness forecast with an abnormal state of precision. By applying the algorithms like Random Forest, Decision Tree, Naïve Bayes, ANN, SVM, KNN, the better Performance is given by Random Forest out of all the remaining Algorithms and Least Performance is shown by KNN.
Index Terms: Coronary Illness, Ailment, Machine Learning, Decision Tree, Naïve Bayes, K-Closest neighbor.
————————————————————
1
INTRODUCTION
Heart is the key part in the humane or animal governing body. Heart is an organ which pumps blood through vessels. It provides oxygen and other nutrients by removing metabolic wastes. There are many diseases which may attack the heart. Coronary sickness is a term covering any disorder of the heart. There is a miniature difference between cardiovascular disease and heart disease. Cardiovascular disease describes problems with diseased vessels, structural problems, and blood clots whereas heart disease refers to issues and malformation of Cardiac Valve. Goings from heart-related disease among provincial Indians has beaten those among urbane Indians, as demonstrated by a foreseen report in the lancet. The examination additionally demonstrates that heart illnesses caused in excess of 201 million deaths in India. Adults brought into the world after the 1970s are altogether more vulnerable to such going's than that born earlier. Few symptoms regarding heart disease are shortness of breath, sweating, nausea, dizziness and a faster heartbeat. Only in Few Cases, the Indications in the Humane are shown in most of the cases humane die by lack of Indications. As “Prevention is better than cure”, so it will be easy and best for the patient to take action before the disease attacks. There are varieties of ML algorithms which provide a better result for the prevention of the disease. ML algorithms include classification, regression, and so on. These ML algorithms construct a scientific model of test information. These ML methods/algorithms are utilized in a variety of Applications. Then again, ml additionally uses some Unsupervised and Supervised learning ventures to improve learns exactness.
Ml and data mining regularly utilize similar strategies and cover altogether, yet while ml Centers around a forecast dependent on known properties, while information mining centers around discovery dependent on obscure properties. In section II, we discuss all the key factors that predict heart disease occurrence. This section also contains a survey of research works regarding those works and comparison between different attributes is done over here. In section III, we have presented briefly about our experiment, results and analysis. In section IV, we have presented discussion and conclusion of the paper.
1.1 HEART DISEASE PREDICTION SURVEY BASED ON RELATED WORKS
An overview is done on various machine learning methods and the distinctive parameters utilized for the forecast of coronary illness are talked about. The precision got with these models are likewise referenced in below and illustrated in Table 1. Aditi gavhane Et al. [1] used NN (Neural Networks). Out of all neural networks is the best and evolving branch. The count of attributes used here is 6 in number. The yield of the framework will give an expected result if the individual shows at least a bit of kindness malady, regarding correct or not correct. The framework gives a thought regarding the coronary illness status prompting heretofore. In the event that the individual is inclined to have the coronary illness, at that point the outcome acquired will be yes and the other way around. The average precision is 0.90 and the average recall is 0.89 and average support is 165. Prediction in this paper is done by using mainly 7 Factors. Still indirectly Effects parameters like fasting blood sugar, smoking, induced angina, the cardio graphic effect is not considered for prediction. Sowmiya Et al. [2] used the Apriori Algorithm and Support Vector has been used. Utilizing restorative profiles, for example, an age, sex, blood weight, chest torment type, fasting glucose. It can foresee like of Sick Person getting coronary illness Based on this, therapeutic culture checks out identifying, what's more, keeping the coronary illness. From the investigation, it has demonstrated that grouping based procedures contribute to high viability and acquire high exactness think about than the past techniques. Analyzed several classification techniques that are very useful in data mining for detecting heart disease. Prof. Dhomse Kanchan B. Et al. [3] used few attribute like __________________________________
Pingali V Sai Naga Sravanthi, Dr. P. Rajesh
1Student, Computer Science and Engineering, Koneru
Lakshmaiah Education Foundation (KLEF), Vaddesswaram,
Guntur District, Andhra Pradesh-522002, India
2Associate Prof., Computer Science and Engineering, Koneru Lakshmaiah Education Foundation (KLEF), Vaddesswaram,
Guntur District, Andhra Pradesh-522002, India
6818 gender, age, type of chest pain, blood sugar level, resting
sugar level. The algorithms like Naïve Bayes, SVM, and PCA has been used. The tool call WEKA is used. The comparison of heart disease and Diabetic Disease is done with the help of Graph. For the heart disease, the data set is divided into the figure of intervals of size 50. The dataset is then divided into training and testing data set. The comparison of Naïve Bayes before and after is calculated. M. Deepika Et al. [4] gave an outlook on all the kinds of disease and implemented them by the artificial neural network, naïve Bayes, decision tree, SVM and the comparison of the different disease like Heart Disease, Thyroid Disease, Diabetes, and Breast Cancer are shown in a Graph. Few challenges involve using a lot of parameters, the absolute probability is Unanswered. The important challenge is to develop a highly accurate and Efficient Model. It helps in finding examples and connections in the dataset. The client needs to think about the activities of the devices and the calculations -with the goal that they can investigate as an ideal technique from the delivered outcomes. The choice of information mining apparatus and the enhancement calculation will demonstrate an effect on speed and precision. I Ketut Agung Enriko Et al. [5] used Nearest neighbor search, naïve Bayes, and support vector machine by 14 attributes which include id, sex, age, symptoms, additional symptoms, blood pressure, heart rate, ECG, cholesterol, trop t, ckmb, GDP, GDS, diagnosis. The data set used in the research is collected from Harapan Kita hospital (HKH) which was located in Jakarta. It consists of 450 records and 36 types of diseases in which 29 of them are related to heart and 7 of them are not related to heart disease. Here the data preprocessing is done, it removes unwanted or unused data from the given data and thus gives the accurate results. The consequences of the investigations are as per the following: KNN is the best calculation with 75.11% exactness (without parameter weighting) and 74.89%, 74.44%, and 73.11% precision (with parameter weighting with OneR Attribute Evaluator, SVM Attribute Evaluator, and ReliefF Attribute Evaluator, individually). In the interim, Naïve Bayes just yields 50.44% and SVM has 45.11% precision. In the following examination, this finding framework will be implanted in a machine- to-machine (M2M) framework to help Sick Person in rustic facilities that don't have a cardiovascular specialist. The framework will be managed by a cardiovascular specialist in a greater city. Dinesh Kumar Et al. [6] used 14 attributes and different ML algorithms like SVM, Logistic Regression, random Forest, Gradient boosting are used. The data is visualized with the help of box plots, scatter plots. The accuracies of logistic regression, random forest, naïve Bayes, gradient boosting, SVM are 0.86, 0.80, 0.84, 0.84 and 0.79. The comparison of the algorithms is also done and represented in a graphical form. The precision emerges from the traits gathered from the datasets. This exactness’s can likewise be expanded by better datasets. In view of the precision delivered by the calculations, the best calculation which give exactness. S.P. Rajamhoana Et al. [7] used artificial neural networks (ANN), machine and deep learning to predict the Heart Disease. The input factors include 15 attributes like age, sex, obesity, smoking, blood pressure, blood sugar, cholesterol, Thalach and so on and with the key attribute as patient ID and Predictable attribute as Diagnosis. The data set which is referred is from Cleveland Repository and stat log heart disease database. This Consists of 303 records and 270 records respectively. In this work, we have collected a dataset from Kaggle [8] and applied different
machine learning algorithms to train and test the dataset. We have also presented a comparison of their accuracies. Real-time applications which use such prediction systems need to maintain some privacy preserving methods to protect such sensitive data from being stolen or misused by unauthorized users. Therefore, privacy of the system can also be preserved by implementing this prediction system in conjunction with privacy preserving methods [9-11].
2. CORONARY ILLNESS PREDICTION FACTORS
Based on the investigation, it is discovered that few properties has been used for an improved forecast. Coming up next are the variables talked about by the different scientists. It is ordered into Basic Parameters and Medical Parameters and dataset description is given in Table 2.2.1 Common factors
Basic Parameters are the components in which the qualities can't be altered and acquired with no restorative verification. Patient
i) Age: Coronary infection may happen at any period in life. In particular, if there should be an occurrence of men heart assault may happen after the age of 45 and for ladies, it may occur after the age of 50. The general population in the '20s and 30 likewise experience the sick effects of heart assault. (Values: patient age<25 = Young, patient age <50 and >26 = adult and patient age>51= old).
ii) Gender: it portrays the Sex of the Patient (M/F) 1: male; 0: female.
2.2 Medical Parameters
The Input for these factors will be acquired from the test results of the patients. Those Test results will be taken and be utilized as the factors for the attributes.
iii) PainLoc: Whether Patient is having Heart Agony or not. (Values Yes: 1 and No: 0)
iv) PainExer: it is Muscle discomfort. (Values Yes: 1 and No: 0)
v) RelRest: Relative Resting Pain (Values Yes: 1 and No: 0)
vi) Systolic Blood Pressure: It is the pressure of circulating blood on the walls of blood vessels. (Values: Where ordinary is 100-125 mg/dl; high glucose level in blood is 130 or more.)
vii) Smoke: it is the action of taking of tobacco or a drug it is either exhaling or inhaling. (Values Yes: 1 and No: 0).
viii) FamHist: If any person in the family is having heart disease, there might be a chance of hereditary. (Values Yes: 1 and No: 0).
ix) Max. Heart Rate Achieved: The maximum heart rate is 220 subtracted to your age. If for example, if age is 25, then 220-25 then 195 is the maximum heart rate achieved.
2.3 Heart Disease:
Table 1: Literature Survey of Different Research papers
Penman Algorithms Used Results Pros and Cons
Number of Attributes
Used
Aditi gavhane [1] Multi-layer perceptron
Average precision is 0.91, average recall is
0.89
Here It uses Multilayer Perceptron For better Accuracy
Sometime Multilayer Perceptron becomes Unpredictable.
7
C.Sowmiya [2] Apriori Algorithm 70%
Comparison of all classification
techniques is done and detecting of the disease is done and results are very effective. Relies on
independence assumption 14 Prof. Dhomse Kanchan B.[3] Naïve Bayes, Decision tree, SVM, PCA
80%(max) for Decision Tree
Reduction of attributes is done by using PCA Data Standardization is
must before PCA.
8
M. Deepika [4]
Artificial Neural Networks, Logistic Regression, Decision Tree 77.87%(max) Decision Tree
Here comparison of different Diseases is done.
ANN has greater Computational Burden out of all.
11
I Ketut Agung Enriko[5]
Naïve Bayes, SVM, K nearest Neighbor
50%(NB) 45%(SVM) 75%(KNN)
The Main Pros of this is it is taken from a real dataset from a hospital from Jakarta.
14 attributes are used.
14 Dinesh Kumar[6] Logistic Regression, Naïve Bayes, Random Forest SVM, Gradient Boosting 86%(max)for Logistic Regression
It gives immediate mechanism as it is written in R software. Data Handling is
difficult in R programming.
14
S.P. Rajamhoana[7] Overall prediction Overall prediction
More number of attributes is taken in this.
Testing is low.
17
Table 2: Dataset description
Sno Attributes Description
1. Age Period of sick person( in Years)
2. Gender Gender of Sick Persons
3. PainLoc
Is Pain Present or not Yes : 1
No : 0
4. PainExer
Is Muscle discomfort present or not Yes : 1
No : 0
5. RelRest
Resting Pressure Level on admittance to the emergency clinic
Yes : 1 No : 0
6. Systolic Blood
Pressure Fasting Pressure Level >100 mg/dl
7. Smoke
Whether the patient smokes or not Yes : 1
6820 8. FamHist Whether the patient family anyone having Heart Disease or not Yes : 1
No : 0
9.
Max. He art Rat e Ach
iev ed
It the Maximum rate of heart rate achieved.
10. Reaction
Coronary Illness Active :Healthy worn :Unhealthy
The Dataset consists of 202 rows and 15 attributes as As columns. Out of those 15 attributes, 10 attributes areMost important. The remaining are supporting attributes For the remaining attributes. The figure of dataset is shown In fig1. The Dataset consists of 202 rows and 10 attributes As columns. For the 10 attributes the count, mean, standardDeviation, minimum score, Maximum score, 25%, 50%, 75% Is calculated and it is illustrated in table3. The dataset’s top 5 records are shown in table4Which is illustrated below It consists of all the 10 attributes Values.
Fig 1: Color bar of dataset.
Table 3: Table illustrating the dataset.
Age Sex Painloc Painex
er Relrest
Systolic Blood Pressure
Smok e
FamHi st
Max. Heart rate
Heart Disease
Count 200.0 200.0 200.0 200.0 200.0 200.0 200.0 200.0 200.0 200.0
Mean 0.0 0.97 0.92 0.67 0.63 93.70 0.27 0.100 48.47 1.52
Std 7.811 0.171 0.26 0.46 1.42 66.80 1.56 1.92 36.49 1.21
Min 35.00 0.00 0.00 0.00 -9.00 -9.00 -9.00 -9.00 -9.00 0.00
25% 55.00 0.00 1.00 0.00 1.00 -9.00 0.00 0.00 -9.00 0.00
50% 60.00 1.00 1.00 1.00 1.00 123.00 0.00 0.00 64.00 1.00
75% 64.00 1.00 1.00 1.00 1.00 140.00 1.00 1.00 73.00 3.00
max 77.00 1.00 1.00 1.00 1.00 190.00 1.00 1.00 139.00 4.00
Table 4: Table illustrating the top values in the dataset
Age Sex Pain loc
Pain exer
Rel rest
Sys BP
Smok e
FamH ist
Max. Heart rate
Heart Disease
0 63 1 1 1 1 140 0 0 112 2
1 44 1 1 1 1 130 0 0 127 0
3 55 1 1 1 1 142 1 0 149 1
4 66 1 1 0 0 110 0 1 99 0
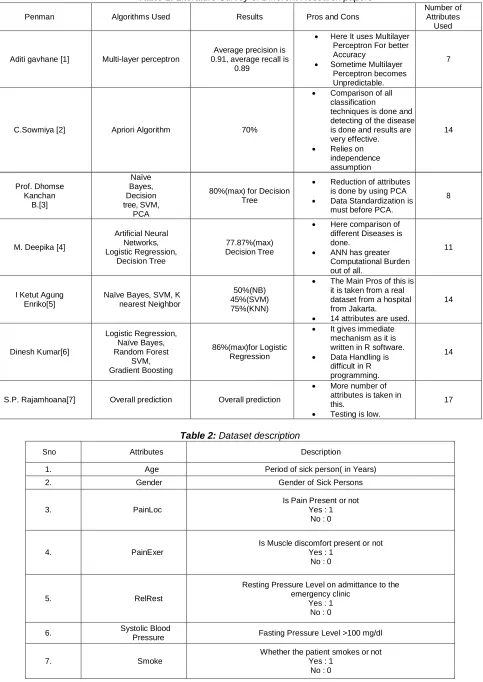
The Count of Each Heart Disease is shown in the below graph Fig2 where 0 represents the patients does not having Heart Disease and 1 represents the patients having heart Disease.
Fig 2: Bar graph of Count of Each Heart Disease
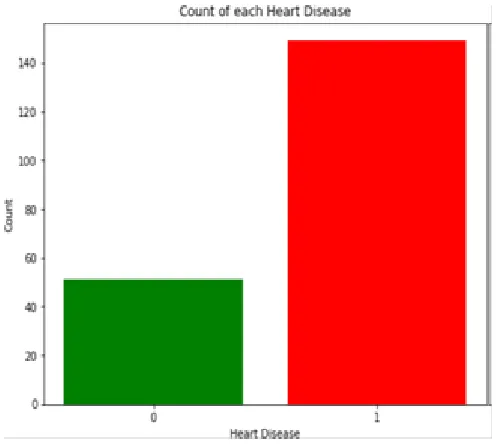
3. RESULTS AND ANALYSIS
The output of the Paper illustrates the accuracy of Different algorithms. Comparing the machine learning techniques, such as K Neighbors Classifiers, Support Vectors Classifiers, Decision Tree Classifier, random Forest, naïve Bayes and Artificial Neural Networks. Out of all Random Forest got the highest accuracy of 88.31% and next highest is Decision Tree
with 87.17%, ANN with 86.84%, SVM with 83.78%, Naive Bayes with 81.57%, KNN with 77.33%. The Accuracies, Test Score, Train Score, Precision Score, Recall Score, F1 Scores are represented in the following Figure Fig 3.
Fig 3: Different score of the Algorithms
The Train Score, Test Score, Precision Score, Recall Score, f1 Score, Accuracy score of each algorithm is shown below in a table 5.According to the descending order; the accuracies column is sorted and represented. The below Line graph fig 4 shows the different scores like; Test and Train Scores, Precision, Recall and F1 scores.
Table 5: Detailed Score of each Algorithm
Algorithm Values
Random Forest
Test Score 1.0 Train Score 0.82 Precision Score 0.87 Recall Score 0.89 F1 Score 0.82 Accuracy 0.88
Decision Tree
Test Score 1.0 Train Score 0.82 Precision Score 0.85 Recall Score 0.89 F1 Score 0.8 Accuracy 0.87
ANN
Test Score 1.0 Train Score 0.82 Precision Score 0.86 Recall Score 0.86 F1 Score 0.8 Accuracy 0.86
SVM
Test Score 0.88 Train Score 0.76 Precision Score 0.86 Recall Score 0.81 F1 Score 0.76 Accuracy 0.83
6822 Train Score 0.72
Precision Score 0.81 Recall Score 0.81 F1 Score 0.72 Accuracy 0.81
KNN
Test Score 0.86 Train Score 0.66 Precision Score 0.78 Recall Score 0.76 F1 Score 0.66 Accuracy 0.77
Fig 4: Line Graph Showing Different Scores
The Comparison of these six algorithms (random forest, decision tree, artificial neural network, support vector
Machine, naïve Bayes, and k nearest Neighbors) is shown below in fig 5.
If User wants to enter the details, the prediction of the disease can also be done. User must enter age, sex, pain loc, pain exer, rel rest, systolic blood pressure, smoke, famhist, heart rate. Based on the values given by user the machine predicts whether the person is having disease or not which was shown in fig 6 and fig 7. If user wants to enter the details, the
prediction of the disease can also be done. User must enter age, sex, pain loc, pain exer, rel rest, systolic blood pressure, smoke, famhist, heart rate. Based on the values given by user the machine predicts whether the person is having disease or not which was shown in fig 6 and fig 7.
Fig 6: shows the person does not have a Heart disease
Fig 7: Shows the person is having Heart Disease
4. DISCUSSIONS AND CONCLUSION
The different coronary illness prediction systems are examined and discussed in this paper. The machine learning systems utilized to anticipate heart sicknesses are examined here. Coronary illness is a mortal infection by its inclination. This illness makes a few issues, for example, heart assault and
6824
REFERENCES
[1]. Aditi Gavhane ; Gouthami Kokkula ; Isha Pandya ; Prof. Kailas Devadkar, “Prediction of Heart Disease Using Machine Learning” Proceedings of the 2nd International conference on Electronics, Communication and Aerospace Technology 29-30 March 2018 pages (1275-1278)
[2]. Sowmiya, C. & Sumitra, P.. (2017). Analytical study of heart disease diagnosis using classification techniques. 1-5. 10.1109/ITCOSP.2017.8303115. [3]. Kanchan, B. & Mahale, Kishor. (2016). Study of
machine learning algorithms for special disease prediction using principal of component analysis. 5-10. 5-10.1109/ICGTSPICC.2016.7955260.
[4]. M. Deepika and K. Kalaiselvi, "A Empirical study on Disease Diagnosis using Data Mining Techniques," 2018 Second International Conference on Inventive Communication and Computational Technologies (ICICCT), Coimbatore, 2018, pp. 615-620. doi: 10.1109/ICICCT.2018.8473185
[5]. Enriko, I Ketut & Suryanegara, Muhammad & Gunawan, Dadag. (2018). Heart Disease Diagnosis System with k-Nearest Neighbors Method Using Real
Clinical Medical Records. 127-131.
10.1145/3233347.3233386
[6]. K. G. Dinesh, K. Arumugaraj, K. D. Santhosh and V. Mareeswari, "Prediction of Cardiovascular Disease Using Machine Learning Algorithms," 2018 International Conference on Current Trends towards Converging Technologies (ICCTCT), Coimbatore, 2018, pp. 1-7. doi: 10.1109/ICCTCT.2018.8550857 [7]. S. Rajamhoana, C. A. Devi, K. Umamaheswari, R.
Kiruba, K. Karunya and R. Deepika, "Analysis of Neural Networks Based Heart Disease Prediction System," 2018 11th International Conference on Human System Interaction (HSI), Gdansk, 2018, pp. 233-239. doi: 10.1109/HSI.2018.8431153
[8]. https://www.kaggle.com/ronitf/heart-disease- uci#heart.csv
[9]. P.Rajesh, Dr.G.Narsimha, " Cerebration Of Privacy Preserving Data Mining Algorithms" in International conference on machine learning and data analysis ICMLDA_ 2014, USA in association with springer, IEEE Explore, DBLP.
[10]. P.Rajesh, Dr.G.Narsimha, "Fuzzy based privacy preserving classification of data streams." in ACM conference (CUBE), Pune, PP: 784-788, 2012, DBLP, ISBN: 978-1-4503-1185-4.