O R I G I N A L R E S E A R C H
Comprehensive Transcriptomic Analysis and
Experimental Validation Identify lncRNA
HOXA-AS2/miR-184/COL6A2 as the Critical ceRNA
Regulation Involved in Low-Grade Glioma
Recurrence
This article was published in the following Dove Press journal: OncoTargets and Therapy
Peng-Yu Chen Xiao-Dong Li Wei-Ning Ma Han Li Miao-Miao Li Xin-Yu Yang Shao-Yi Li
Department of Neurosurgery, Shengjing Hospital Affiliated to China Medical University, Shenyang, People’s Republic of China
Purpose:The recurrence and metastasis of glioma are closely related to complex regulatory networks among protein-coding genes, lncRNAs and microRNAs. The aim of this study was to investigate core genes, lncRNAs, miRNAs and critical ceRNA regulatory mechanisms, which are involved in lower-grade glioma (LGG) recurrence.
Materials and Methods:We employed multiple datasets from Chinese Glioma Genome Atlas (CGGA) database and The Cancer Genome Atlas (TCGA) to perform comprehensive transcriptomic analysis. Further in vitro experiments including cell proliferation assay, luciferase reporter assay, and Western blot were performed to validate our results.
Results:Recurrent LGG and glioblastoma (GBM) showed different transcriptome charac-teristics with less overlap of differentially expressed protein-coding genes (DEPs), lncRNAs (DELs) and miRNAs (DEMs) compared with primary samples. There were no overlapping gene in ontology (GO) terms related to GBM recurrence in the TCGA and CGGA databases, but there were overlaps associated with LGG recurrence. GO analysis and protein–protein interaction (PPI) network analysis identified three core genes: TIMP1, COL1A1 and COL6A2. By hierarchical cluster analysis of them, LGGs could be clustered as Low_risk and High_risk group. The High_risk group with high expression of TIMP1, COL1A1, and COL6A2 showed worse prognosis. By coexpression networks analysis, competing endogen-ous RNA (ceRNA) network analysis, cell proliferation assay and luciferase reporter assay, we confirmed that lncRNA HOXA-AS2 functioned as a ceRNA for miR-184 to regulate expression of COL6A2, which induced cell proliferation of low-grade glioma.
Conclusion: In this study, we revealed a 3-hub protein-coding gene signature to improve prognostic prediction in LGG, and identified a critical ceRNA regulation involved in LGG recurrence.
Keywords:lower-grade glioma, lncRNA, miRNA, HOXA-AS2, miR-184, COL6A2
Introduction
Glioma is the most common malignant brain tumor in human adults, with a low
5-year overall survival (OS) rate (35%).1According to the World Health Organization
(WHO) grading system, gliomas are classified from grade I–IV. Grade II and III
gliomas are grouped as LGGs, and GBM is regarded as grade IV. GBM, as the most
Correspondence: Shao-Yi Li
Department of Neurosurgery, Shengjing Hospital Affiliated to China Medical University, 39 Hua Xiang Road, Shenyang 110022, People’s Republic of China Email [email protected]
OncoTargets and Therapy
Dove
press
open access to scientific and medical research
Open Access Full Text Article
OncoTargets and Therapy downloaded from https://www.dovepress.com/ by 118.70.13.36 on 25-Aug-2020
invasive and aggressive glioma, shows the highest
mortal-ity despite aggressive treatment.2,3 Although LGGs have
identical morphological phenotypes, the range of patient
outcomes is wide.4 Because of the aggressive nature of
gliomas, a residual tumor after excision is the leading cause of recurrence and disease progression, which is a
major reason for the poor prognosis in glioma patients.5
Therefore, it is necessary to explore the tumor progression mechanisms and identify potential therapeutic targets in glioma.
Recently, many studies have revealed the distinctions between GBM and LGG by integrating and analyzing multilevel molecular data, including mutation, methyla-tion, and gene expressions. Previous studies have reported that somatic intronic microsatellite loci can differentiate
between GBM and LGG.6–8Zhang et al revealed
distinc-tions between LGG and GBM by establishing a differen-tial mRNA-lncRNA network using mRNAs and lncRNAs
differentially expressed between GBM and LGG.9
Therefore, a separate exploration of the mechanisms of LGG and GBM progression will be more appropriate.
Long noncoding RNAs (lncRNAs) and microRNAs are classic noncoding RNAs and have been reported to
reg-ulate the development of glioma.10–12For example, Li et al
found that lncRNA SNHG1 could upregulate FOXP2 and KDM5B by regulating the expression of miR-154-5p and miR-376b-3p, which contributed to the malignant behavior
of glioma cells.13 Wu et al reported that lncRNA
lnc-TALC increased the expression of O6
-methylguanine-DNA methyltransferase by regulating the c-Met pathway by competitively binding with miR-20b-3p, and this bio-logical process is required for temozolomide resistance
and GBM recurrence.14 To date, a number of public
open-access databases have helped uncover more complex protein-coding gene-lncRNA-microRNA regulatory net-works. By informatics analysis using TCGA and GEO data, reciprocal regulatory networks among protein-coding genes, lncRNAs and microRNAs have been revealed to
participate in cancer progression.15,16Lou et al described a
miRNA-mRNA regulatory network by using DEPs between GBM samples and normal samples that was involved in tumorigenesis and the development of
GBM.17Deng et al also revealed hub DEPs by
construct-ing PPI networks of DEPs between primary and recurrent
LGG tumor tissues in the TCGA database.18 Besides,
lncRNAs, microRNAs and mRNAs could form complex
ceRNA network to promote GBM growth and
progression.19,20 Long et al revealed a complex lncRNA
mediated ceRNA network associated with GBM
progres-sion by analyzing TCGA and GEO data.21 However, the
complex regulatory networks and ceRNA networks among protein-coding genes, lncRNAs and microRNAs are still unclear in the recurrence of glioma.
In this study, DEPs, DELs and DEMs were identified, and
GO analysis was performed to explore transcriptome variation in the process of LGG or GBM recurrence by cross-database analysis using CGGA and TCGA data. By intersecting the results from analyses of the CGGA and TCGA databases and constructing a PPI network, three hub genes (TIMP1, COL1A1 and COL6A2) were revealed to participate in LGG recurrence. Using the three genes, primary LGGs were clustered into two groups (High_risk and Low_risk), and the High_risk group showed poorer prognosis. Finally, protein-coding gene-lncRNA-microRNA regulatory network analysis and ceRNA network analysis were conducted to reveal hub protein-coding genes, lncRNAs and microRNAs associated with LGG recurrence.
Materials and Methods
Data Collection
We obtained transcriptomic data of GBM and LGG
samples from the TCGA (https://portal.gdc.cancer.gov/)
and CGGA (http://www.cgga.org.cn/) databases. The
details are illustrated in Table 1. We normalized raw
counts data from TCGA database by TMM using GDCRNATools package in R software. In the TCGA database, 14 LGG patients had both recurrent and pri-mary samples, and RNA-Seq and miRNA-Seq data were available for a total of 32 samples. In addition, 6 GBM patients had both recurrent and primary samples, and RNA-Seq data were available for a total of 13 samples. RNA-Seq data of grade III glioma cell lines (SW1783, SW1088, HS683 and GOS3) were downloaded from
CCLE database (https://portals.broadinstitute.org/ccle).
RNA levels of COL6A2, HOXA-AS2 and miR-184 were extracted and log2-transformed.
Differentially Expressed Protein-Coding
Genes, lncRNAs and microRNAs
Differentially expressed RNAs (including DEPs, DELs, and DEMs) were analyzed between primary and recurrent
samples of LGG or GBM by using the“limma”package in
R software. Because some cases had both primary and
recurrent samples in the TCGA database, we identified
DEPs, DELs, and DEMs between primary and recurrent
OncoTargets and Therapy downloaded from https://www.dovepress.com/ by 118.70.13.36 on 25-Aug-2020
tumors in these patients. The DEPs, DELs, and DEMs that met the criteria of P value < 0.05 and |log2 (fold change)| > 1 were selected for further analysis. Volcano plot and heatmap were plotted to show DEPs, DELs, and DEMs by
using the “ggplot2” and “pheatmap” package in R
soft-ware. Venn diagrams were drawn tofind overlap using the
Bioinformatics & Evolutionary Genomics website (http://
bioinformatics.psb.ugent.be/webtools/Venn/).
GO Enrichment Analysis
GO analysis was performed using DEPs with the
“clusterProfiler” package in R software. Dotplots were
generated to display the most significant GO terms
involved in LGG or GBM recurrence (P<0.001). Using
the “enrichplot” package in R, circular diagrams were
plotted to show the 5 most related GO terms (P<0.001).
Protein
–
Protein Interaction (PPI)
Network Analysis
To better understand the interactive relationships among these enriched genes in GO terms, a PPI network was
estab-lished by using the STRING database.22 According to the
degree calculated using Cytoscape software (version 3.6.1),
the top 10 hub genes were identified from the PPI network.
Protein Coding Gene-lncRNA-miRNA
Coexpression Network Analysis
The R package“corrplot”was utilized to calculate the
corre-lation coefficients among prognostic DEPs, DELs and
DEMs. Then, node pairs with a correlation coefficient > 0.1
were selected for further analysis. A coexpression network containing protein-coding genes, lncRNAs and miRNAs was constructed, and further analysis was conducted to identify a
subnetwork by using Cytoscape software (https://cytoscape.
org/).
Construction of ceRNA Network
Interactions of lncRNAs with microRNAs and mRNAs were predicted by using the miRcode database. Finally, the lncRNA-miRNA-mRNA ceRNA network analysis was conducted by using Cytoscape software.
Cell Lines and Cell Culture
Two grade III glioma cell line HS683 and SW1088 were purchased from American Type Tissue Culture Collection. The cell lines were maintained in DMEM supplemented
with 10% fetal bovine serum at 37°C under a humidified
atmosphere of 5% CO2.
Cell Transfection
miR-184 mimics, miR-184 inhibitor, or negative control were transfected by Lipofectamine3000 (Invitrogen Inc., Carlsbad, CA, USA), which were synthesized by GenePharma
(Shanghai, China). The sequences were listed as follows:23
miR-184 mimic, 5′-UGGACGGAGAACUGAUAAGGGU
CCUUAUCAGUUCUCCGUCCAUU-3′; the negative
con-trol for miR-184 mimic, 5′-UUCUCCGAACGUGUCACG
UTTACGUGACACGUUCGGAGAATT-3′; miR-184
inhibi-tor, 5′-ACCCUUAUCAGUUCUCCGUCCA-3, negative
control for miR-184 inhibitor, 5′-CAGUACUUUUGUGU
AGUACAA-3′. siRNAs targeting COL6A2 and
HOXA-AS2 were synthesized by GenePharma, and eukaryotic vec-tors expressing HOXA-AS2 were obtained from Genechem (Shanghai, China). The siRNAs and vectors were used to transfected to glioma cells by Lipofectamine3000. The
siRNA sequences were listed as follows:24,25siHOXA-AS2,
si1: 5′-AAACCUUGUAGAUAGCUUGAGCUGG-3′, si2:
Table 1Datasets Used in This Study
Database Dataset Data Type Sample (n) Patient (n) Sample Type (n)
GBM_P GBM_R LGG_P LGG_R
TCGA – mRNA-Seq 529 512 511 18
– mRNA-Seq 174 166 6 168 – –
– miRNA-Seq 530 512 – – 512 18
CGGA Dataset 2 mRNA-Seq 692 692 140 109 282 161
Dataset 3 mRNA-Seq 291 291 85 24 144 38
Dataset 6 miRNA-array 287 287 156 18 108 5
Dataset 4 mRNA-array 192 192 81 4 99 8
Abbreviations:TCGA, The Cancer Genome Atlas; CGGA, Chinese Glioma Genome Atlas; GBM, glioblastoma; LGG, lower-grade glioma.
OncoTargets and Therapy downloaded from https://www.dovepress.com/ by 118.70.13.36 on 25-Aug-2020
5′-CAAGCUUGACAAGUUCAGCUCAA-3′; siCOL6A2:
si1: 5′-GGGCCUCCUUCAUCAAGAATT-3′; si2: 5′-GCAG
GCCUGGAUUCAGCUATT-3′.
Western Blotting
Total protein was gathered by RIPA Lysis Buffer. The protein samples were separated by 8% SDS-polyacrylamide gels and transferred to PVDF membranes. After blocking with 5% BSA for 2 h, the membranes were incubated overnight with primary antibodies including mouse anti-GAPDH monoclo-nal antibody (Catalog number: 60,004-1-Ig, proteintech, Wuhan, China) and rabbit COL6A2 monoclonal anti-body (Catalog number: ab180855, Abcam, Cambridge, UK) at 4°C. After being washed in TBST for three times, mem-branes were incubated with HRP-conjugated anti-rabbit (Catalog number: SA00001-2, proteintech, Wuhan, China) or HRP-conjugated anti-mouse (Catalog number: SA00001-1, proteintech, Wuhan, China) secondary antibodies at a 1:5000 dilution at room temperature for 1h. Then, the bind-ing secondary antibody was detected and recorded usbind-ing the enhanced ECL Western blotting detection system.
Quantitative Real-Time PCR (qPCR)
The total RNA of glioma cells were extracted with Trizolreagent (Invitrogen, USA) according to the manufacturer’s
instruction. Total RNA (1 μg) was used for cDNA
synth-esis using Reverse Transcription kit (TOYOBO, Osaka,
Japan). The primers were: GAPDH, forward: 5′-AACGG
ATTTGGTCGTATTG-3′, reverse: 5′-GGAAGATGGT
GATGGGATT-3′; HOXA-AS2, forward: 5′-GTTCAGC
TCAAGTTGAACATA-3′, reverse: 5′-AAACCTTGTAG
ATAGCTTGAG-3′; COL6A2, forward: 5′- TGCTCCGT
GCTCCTGCTCTG-3′, reverse: 5′- ATGGTGACGCTCT
CCGAGGTG −3′. The qRT-PCR assays were carried out
using SYBR Select Master Mix (Applied Biosystems, Foster City, CA, USA) on ABI 7500 Real-Time PCR system (Applied Biosystems). The PCR conditions were as follows: step 1: 95°C for 5 min; step 2: 40 cycles consisting of 95°C for 10 s, 60°C for 30 s, and 72°C for30 s; step 3: 72°C for 5 min. Relative RNA level of
each gene was calculated as 2−ΔΔCt. Each sample was
performed in triplicate.
Cell Counting Kit-8 (CCK-8)
Proliferation Assay
The transfected HS683 and SW1088 cells were seeded into 96-well plates at a density of 5000 cells/well. After
incubated at 37 °C for 2 h, the absorbance of each well was measured at a wavelength of 450 nm.
Luciferase Assay
Glioma cells were seeded in 24-well plate, and allowed to
grow for 24 h. To test the binding specificity of miR-184 in
COL6A2, we constructed the wild type reporter vector
(COL6A2-3′UTR_WT: 5′-CCCGUCCA-3′) and the
corre-sponding mutant (COL6A2-3′UTR_MUT: 5′-CUUAG
UUA-3′). To test the binding specificity of miR-184 in
HOXA-AS2, we constructed the wild type reporter vector
(HOXA-AS2_WT: 5′-UCCGUCC-3′) and the corresponding
mutant (HOXA-AS2_MUT: 5′- GUUAGUU −3′). Then,
100ng pGL3-COL6A2-3′UTR-luciferase plasmid (or MUT)
and pGL3-HOXA-AS2-luciferase plasmid (or MUT) was transfected into glioma cells using the Lipofectamine3000 reagent. Subsequently, the cells were transfected with miR-184 mimics, miR-miR-184 inhibitor, or negative control. The luciferase activities in cell lysates were measured at 48 h after transfection by the Dual Luciferase Reporter Assay Kit
(Promega, Madison, WI, USA) according the manufacturer’s
protocol. Three independent experiments were performed.
Immunohistochemistry (IHC) and
Evaluation
Four primary LGG tissues and four recurrent LGG tissues were obtained from Department of Neurosurgery of
Shengjing Hospital affiliated to China Medical University
and histologically diagnosed with grade II or III glioma in 2017. These experiments were approved by Human Ethics Committee of China Medical University and all patients
signed the informed consent. Tissues werefixed by formalin,
embedded by paraffin, andfinally cut into 4μm sections. The
sections were deparaffinized by three 10-min washes in
xylene, and then rehydrated by 100%, 95%, 85% and 75% ethanol solutions (5min/time). Antigen retrieval was per-formed in 0.01 M citrate buffer (pH 6.0) at 120°C for 5 min.
Endogenous peroxidase was blocked by 3% H2O2in PBS for
15 min and washed for 2×5 min in PBS. Then, non-specific
binding were blocked by 10% bovine serum albumin (BSA) for 45 min. Subsequently, sections were incubated with the primary antibody against COL6A2 (1:100) at 4 °C for over-night. After washed using PBS, the sections were incubated with HRP-conjugated goat anti-rabbit secondary antibody (1:1000) for 45 min. Finally, the sections were stained using 3,3-diaminobenzidine (DAB) for 5 min, counterstained with hematoxylin, mounted and captured representative images
OncoTargets and Therapy downloaded from https://www.dovepress.com/ by 118.70.13.36 on 25-Aug-2020
using an optical microscope (Olympus, Tokyo, Japan). As for the IHC scoring, protein expression was calculated by multi-ply the staining intensity scores and the positive cell rate scores. Staining intensity scores: 0, negative; 1, weak; 2, intense; and 3, strongly intense. Positive cell rate scores: 0,
0%; 1, 1–10%; 2, 11–25%; 3, 26–50%; 4, 51–75%; and 5,
76–100%.
Statistical Analysis
The main statistical analysis in this study is stated above. Using a 3-gene expression value, hierarchical cluster analyses
were conducted with the“pheatmap”package in R. To explore
the prognostic significance of DEMs, ROC curves were
plotted, and optimal cutoff values were set to divide all LGG samples as low and high expression groups. The survival curves were plotted using GraphPad Prism 6.0 (La Jolla, CA, United States). When we performed differential expres-sion analysis, only protein-coding genes, lncRNAs or miRNAs with |log2FC| > 1 and P<0.05 were considered
statistically significant. Univariate Cox regression analyses
were conducted using the “survival” package in R, The
Student’st-test, or the chi-squared test, was used to evaluate
significant differences between groups of data. All data are
represented as the means ± SD. Student’s t-test using
GraphPad Prism 6.0 was used to determine significant
differ-ences between two groups. All data are represented as the means and 95% CI. A P value < 0.05 was considered statis-tically significant.
Results
Recurrence-Related RNA Expression
Patterns Vary in GBM and LGG
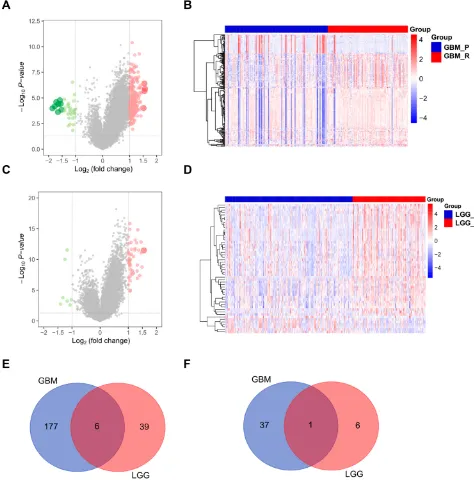
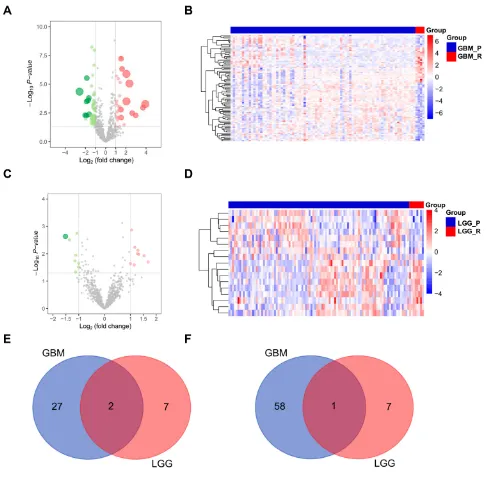
To explore whether GBM and LGG recurrences contribute to distinct mechanisms, we compared the differentially expressed RNAs between recurrent and primary samples of GBM or LGG, including protein-coding genes, pseudogenes, and long noncoding and short noncoding RNAs. In the CGGA database, there were 183 upregulated and 38 down-regulated RNAs in recurrent GBM samples (|log2 (fold change)| > 1, P<0.05, Figure 1A andB,Table S1). A total of 45 upregulated and 7 downregulated RNAs were observed in recurrent LGG samples (|log2 (fold change)| > 1, P<0.05,
Figure 1C and D, Table S2). Venn diagrams showed that
there were only 6 overlapping RNAs among the upregulated RNAs and 1 overlapping RNA among the downregulated
RNAs in recurrent LGG and GBM (Figure 1EandF). These
results revealed distinct recurrence mechanisms between GBM and LGG at the transcriptional level.
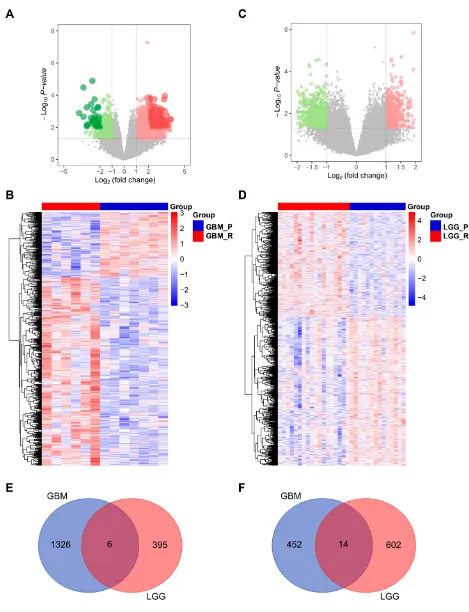
To validate the above results, the same analyses were conducted in the TCGA database. There were 1332 upregu-lated and 466 downreguupregu-lated RNAs in recurrent GBM samples (|log2 (fold change)| > 1, P<0.05,Figure 2AandB,Table S3). A total of 401 upregulated and 616 downregulated RNAs were observed in recurrent LGG samples (|log2 (fold change)| > 1,
P<0.05,Figure 2CandD,Table S4). Venn diagrams showed
that there were only 6 overlapping RNAs among the upregu-lated RNAs and 14 overlapping RNAs among the
downregu-lated RNAs in recurrent LGG and GBM (Figure 2EandF).
Recurrent Mechanisms of GBM and LGG
are Different
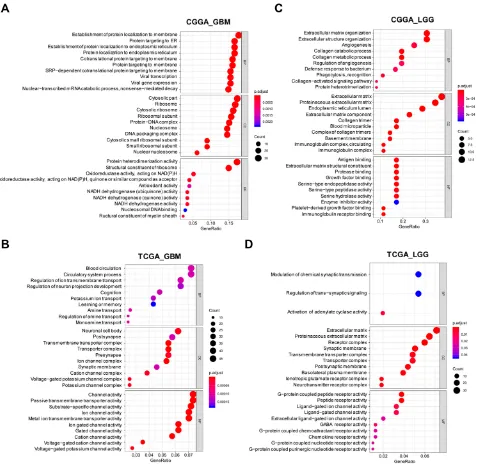
GO analysis was performed using DEPs. The dotplot of the top 10 enriched GO terms is displayed. In recurrent GBM, there were no identical enriched GO terms between
the TCGA and CGGA databases (Figure 3A and B).
However, we observed the same enriched GO terms
involved in LGG recurrence (Figure 3C and D). The
results showed that LGG recurrence was positively asso-ciated with GO terms involved in the extracellular matrix (such as collagens, P<0.001).
GO and PPI Network Analysis Revealed
Three Core Genes Involved in LGG
Recurrence
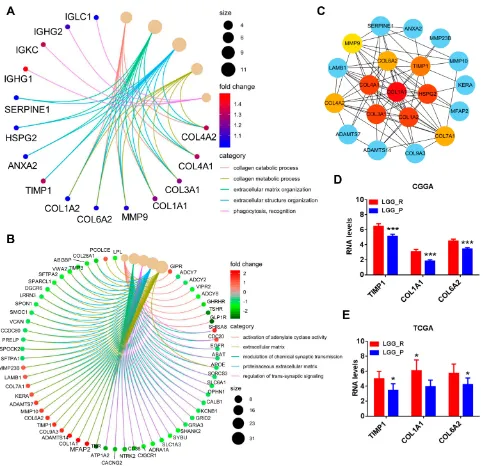
To screen critical genes that mediate LGG recurrence, we generated a circular diagram to show the top 5 related GO terms with the enriched genes. Referencing the analysis results from the CGGA and TCGA databases, a total of 20 genes were enriched in GO terms associated with the
extracellular matrix (Figure 4A and B). Using these 20
genes to construct a PPI network, the top 10 hub genes
were identified (Figure 4C). Among them, three genes
were also intersected in both TCGA and CGGA analysis results: TIMP1, COL1A1 and COL6A2. Expression of the three genes was increased more than double in recurrent
LGGs in the CGGA (Figure 4D, all P<0.001) and TCGA
databases (Figure 4E, all P<0.05).
To explore the prognostic significance of the 3 genes in
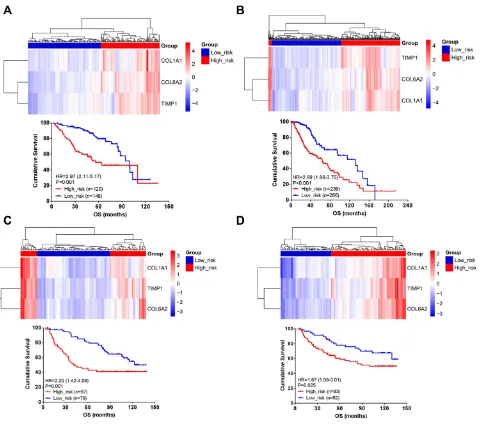
primary LGGs, we performed hierarchical cluster analysis. In the TCGA project and CGGA dataset (dataset 2), all primary LGG samples were clustered into two groups: High_risk and Low_risk. The High_risk group showed poorer prognosis than the Low_risk group in the CGGA (dataset 2, HR=2.97
OncoTargets and Therapy downloaded from https://www.dovepress.com/ by 118.70.13.36 on 25-Aug-2020
(2.11–5.17), P<0.001, Figure 5A) and TCGA (HR=2.69
(1.86–3.75), P<0.001, Figure 5B) databases. Another two
CGGA datasets (dataset 3 and dataset 4) were used as exter-nal validation, and the same results were observed (dataset 3,
HR=2.20 (1.42–4.09), P=0.001, Figure 5C; dataset 4,
HR=1.87 (1.08–3.01), P=0.025,Figure 5D).
Recurrence-Related miRNAs are Distinct
Between LGG and GBM
To further explore the roles of miRNAs in LGG and GBM recurrence, we used CGGA microRNA array data for the next analysis. In the CGGA dataset (dataset 6), 29 increased and 59 decreased miRNAs were observed in recurrent GBM
Figure 1Recurrent GBM and LGG showed distinct transcriptomic characteristics in the CGGA database.
Notes:Volcano plot (A) and heatmap (B) showing differentially expressed RNAs (|log2 (fold change)| > 1, P<0.05) between recurrent and primary GBM samples in the CGGA database (dataset 2). Volcano plot (C) and heatmap (D) showing differentially expressed RNAs (|log2 (fold change)| > 1, P<0.05) between recurrent and primary LGG samples in the CGGA database. (E) Six overlapping genes were upregulated in recurrent GBM and LGG. (F) One overlapping gene was downregulated in recurrent GBM and LGG
Abbreviations:GBM_P, primary GBM; GBM_R, recurrent GBM; LGG_P, primary LGG; LGG_R, recurrent LGG.
OncoTargets and Therapy downloaded from https://www.dovepress.com/ by 118.70.13.36 on 25-Aug-2020
Figure 2Transcriptomic characteristics of recurrent GBMs and LGGs in the TCGA database.
Notes:Differentially expressed RNAs between primary and recurrent GBM samples are displayed by volcano plot (A, |log2 (fold change)| > 1, P<0.05) and heatmap (B, | log2 (fold change)| > 1, P<0.05). Differentially expressed RNAs between primary and recurrent LGG samples are displayed by volcano plot (C, |log2 (fold change)| > 1, P<0.05) and heatmap (D, |log2 (fold change)| > 1, P<0.05). (E) Six overlapping genes were upregulated in recurrent GBM and LGG. (F) Fourteen overlapping genes were downregulated in recurrent GBM and LGG.
Abbreviations:GBM_P, primary GBM; GBM_R, recurrent GBM; LGG_P, primary LGG; LGG_R, recurrent LGG.
OncoTargets and Therapy downloaded from https://www.dovepress.com/ by 118.70.13.36 on 25-Aug-2020
(|log2 (fold change)| > 1, P<0.05,Figure 6AandB,Table S5). In LGG, we found 9 upregulated and 8 downregulated miRNAs in recurrent samples (|log2 (fold change)| > 1,
P<0.05,Figure 6CandD,Table S6). Venn diagrams showed
only 2 overlapping miRNAs among the upregulated miRNAs and 1 overlapping miRNA among the downregulated
miRNAs in recurrent LGG and GBM (Figure 6EandF).
Prognostic miRNAs and lncRNAs in LGG
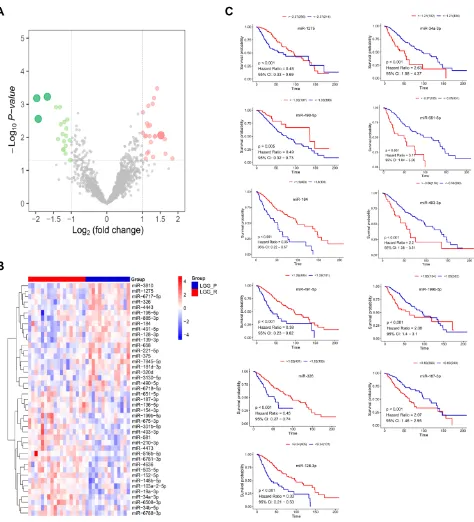
We further screened prognostic miRNAs in LGG patients by using TCGA miRNA-Seq data. First, we compared differen-tially expressed miRNAs between recurrent and primary LGG samples from 14 LGG patients. There were 23 upregulatedand 20 downregulated miRNAs in recurrent LGGs (Figure 7A
andB,Table S7). Among them, 8 of 23 upregulated miRNAs
Figure 3GO analysis of DEPs in the CGGA and TCGA databases.
Notes:GO analysis of DEPs (|log2 (fold change)| > 1, P<0.05) in recurrent GBM in the CGGA (A) and TCGA (B) databases (P<0.001). GO analysis of DEPs (|log2 (fold change)| > 1, P<0.05) in recurrent LGG in the CGGA (C) and TCGA (D) databases (P<0.001).
Abbreviations:GBM_P, primary GBM; GBM_R, recurrent GBM; LGG_P, primary LGG; LGG_R, recurrent LGG; BP, biological process; MF, molecular function; CC, cellular component.
OncoTargets and Therapy downloaded from https://www.dovepress.com/ by 118.70.13.36 on 25-Aug-2020
were significantly associated with inferior prognosis, and 11 of 20 downregulated miRNAs were positively associated with better prognosis (Figure 7CandFigure S1, P<0.01).
According to the above results on differentially expressed
RNAs, we identified 35 upregulated lncRNAs and 71
downregulated lncRNAs in recurrent LGGs. By Cox univari-ate regression analysis, 31 of 35 upregulunivari-ated lncRNAs were
significantly related to worse prognosis, and 60 of 71
down-regulated lncRNAs were positively associated with better prognosis (Table S8, P<0.01).
Figure 4Identification of TIMP1, COL1A1 and COL6A2 as the core genes involved LGG recurrence.
Notes:Circular diagram showed 5 most related GO terms involved in LGG recurrence in CGGA (A) and TCGA (B) database (P<0.001). (C) PPI network analysis showed top10 hub protein-coding genes among genes in GO term associated with extracellular matrix. The colors nodes of the network from light yellow, dark yellow to red indicated gradually crucial members in the network. Of the 10 hub protein-coding genes, TIMP1, COL1A1 and COL6A2 were upregulated in LGG recurrence comparing primary tumor in CGGA (D, all P<0.001) and TCGA (E, all P<0.05) database. *P<0.05, ***P<0.001.
Abbreviations:GBM_P, primary GBM; GBM_R, recurrent GBM; LGG_P, primary LGG; LGG_R, recurrent LGG.
OncoTargets and Therapy downloaded from https://www.dovepress.com/ by 118.70.13.36 on 25-Aug-2020
Identi
fi
cation and Validation of LncRNA
HOXA-AS2/miR-184/COL6A2 ceRNA
Regulation Associated with LGG
Recurrence
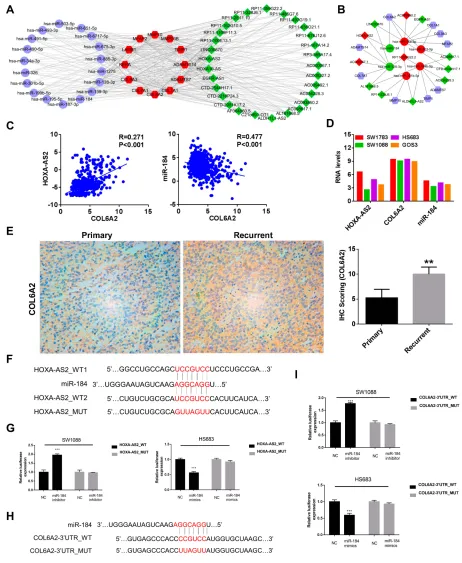
The TCGA database supplies multidimensional data, which includes somatic mutations, copy number variants (CNVs), gene expression, lncRNA expression, and miRNA expression. Therefore, we could establish a protein-coding gene-lncRNA-miRNA coexpression network using these data. There were 12 protein-coding gens enriched in the GO terms involved in the extracellular matrix, 19 prognostic miRNAs and 91 prognostic lncRNAs in the TCGA database. Using the protein-coding
genes and prognostic lncRNAs and miRNAs, the node pairs with correlation coefficients > 0.1 and P value < 0.05 were selected for further analysis. Accordingly, we constituted a complex co-expression network containing 12 protein coding
genes, 18 miRNAs and 29 lncRNAs (Figure 8A). To better
understand whether the above 29 hub lncRNAs regulated 12 protein coding genes via ceRNA regulatory mechanism, we performed ceRNA network analysis by using miRcode data-base. Finally, we constructed a ceRNA network including 9 protein coding genes, 6 miRNAs and 12 lncRNAs. As shown
inFigure 8B, HOXA-AS2 may act as a competing endogenous
RNA (ceRNA) for miR-184 to regulate the hub gene COL6A2 expression. COL6A2 expression was positively related to
Figure 5A 3-gene signature for overall survival prediction in LGG.
Notes:Hierarchical cluster analysis of 3 genes by heatmap showed two clusters: Low_risk and High_risk group. High_risk group with high 3-gene signature showed poorer prognosis than Low_risk group in primary LGGs in CGGA (A, dataset 2) and TCGA (B) database. Using another two datasets in CGGA database, two clusters (Low_risk and High_risk group) were also identified. High_risk group showed poorer prognosis than Low_risk group of primary LGGs (C, dataset 3;D, dataset 4).
OncoTargets and Therapy downloaded from https://www.dovepress.com/ by 118.70.13.36 on 25-Aug-2020
LncRNA HOXA-AS2 expression, and negatively related to
miR-184 expression in glioma in TCGA database (Figure 8C).
In CCLE database, the four grade III glioma cell lines showed different levels of expression of LncRNA HOXA-AS2,
COL6A2 and miR-184 (Figure 8D). Because HS683 showed
high expression of them and SW-1088 showed low levels of them, we further selected these two cell lines for the next experiments. We also detected the COL6A2 protein expression
by IHC, and COL6A2 expression was significantly higher in
recurrent LGG tissues (n=4) than in primary LGG tissues
(n=4) (P<0.01,Figure 8E). By referencing to miRcode
data-base, we obtained two potential binding site of miR-184 in
LncRNA HOXA-AS2 mRNA (Figure 8F). In order to further
validate the interaction, luciferase reporter assays were per-formed. The miR-184 inhibitors enhanced the luciferase activ-ity of HOXA-AS2_WT reporter systems in SW1088, but not
Figure 6Recurrent GBMs and LGGs showed different changed microRNAs in CGGA database.
Notes:Volcano plot (A, |log2 (fold change)| > 1, P<0.05) and heatmap (B, |log2 (fold change)| > 1, P<0.05) showing DEMs between recurrent and primary GBM samples in CGGA database (dataset 6). Volcano plot (C, |log2 (fold change)| > 1, P<0.05) and heatmap (D, |log2 (fold change)| > 1, P<0.05) showing DEMs between recurrent and primary LGG samples in CGGA database (dataset 6). (E) Two overlapped microRNAs were up-regulated in recurrent GBM and LGG. (F) One overlapped microRNAs was down-regulated in recurrent GBM and LGG.
Abbreviations:GBM_P, primary GBM; GBM_R, recurrent GBM; LGG_P, primary LGG; LGG_R, recurrent LGG.
OncoTargets and Therapy downloaded from https://www.dovepress.com/ by 118.70.13.36 on 25-Aug-2020
HOXA-AS2_MUT (Figure 8G). The miR-184 mimics inhib-ited the luciferase activity of HOXA-AS2_WT reporter
sys-tems in HS683, but not HOXA-AS2_MUT (Figure 8G).
Furthermore, we also obtained the binding site of miR-184 in
3′UTR of COL6A2 mRNA (Figure 8H). Similarly, the
miR-184 inhibitors enhanced the luciferase activity of COL6A2-3′
UTR_WT reporter systems in SW1088, but not COL6A2-3′
UTR_MUT (Figure 8I). The miR-184 mimics inhibited the
luciferase activity of COL6A2-3′UTR_WT reporter systems in
HS683, but not COL6A2-3′UTR_MUT (Figure 8I).
Figure 7Identification of recurrence-related microRNAs in LGGs in TCGA database.
Notes:Volcano plot (A, |log2 (fold change)| > 1, P<0.05) and heatmap (B, |log2 (fold change)| > 1, P<0.05) showing DEMs between recurrent and primary GBM samples in TGGA database. (C) Among DEMs, prognosis analysis showed that 6 downregulated miRNAs were positively associated with better prognosis (HR <0.5, P<0.01) and 5 upregulated miRNAs were significantly associated with inferior prognosis (HR >2, P<0.01).
Abbreviations:GBM_P, primary GBM; GBM_R, recurrent GBM; LGG_P, primary LGG; LGG_R, recurrent LGG.
OncoTargets and Therapy downloaded from https://www.dovepress.com/ by 118.70.13.36 on 25-Aug-2020
Figure 8Identification and validation of HOXA-AS2/miR-184/COL6A2 ceRNA regulation in LGGs.
Notes:(A) Construction of co-expression networks analysis using 12 protein-coding genes, 18 miRNAs and 29 lncRNAs. The node pairs with correlation coefficients > 0.1 and P value < 0.05. Blue circle: miRNA; Red sexangle: genes coding protein; Green diamond: LncRNA. (B) ceRNA network analysis among protein-coding genes, lncRNAs and miRNAs in the above co-expression network. Green circle: miRNA related to good prognosis; Red circle: miRNA related to poor prognosis; Blue sexangle: genes coding protein; Green diamond: LncRNA involved in good prognosis; Red diamond: LncRNA involved in poor prognosis. (C) Correlation analysis between COL6A2 and HOXA-AS2 or miR-184 using TCGA data (n=525). (D) The mRNA levels of COL6A2, HOXA-AS2 and miR-184 in grade III glioma cell lines in CCLE database (SW1783, SW1088, HS683 and GOS3). (E) COL6A2 protein level was significantly higher in recurrent LGG tissues (n=4) than in primary LGG tissues (n=4) by IHC (200×, P<0.01). (F) The putative binding sites by miRcode and corresponding mutant site for HOXA-AS2 within miR-184. (G) The 184 inhibitors enhanced the luciferase activity of HOXA-AS2_WT in SW-1088 cells by luciferase reporter assay, but not HOXA-AS2_MUT. The miR-184 mimics reduced the luciferase activity of HOXA-AS2_WT in HS683 cells by luciferase reporter assay, but not HOXA-AS2_MUT. (H) Schematic representation of the mature miR-184 targeting site in the 3′-UTR predicted by miRcode and mutant site of COL6A2 mRNA. (I) The miR-184 inhibitors enhanced the luciferase activity of COL6A2-3′UTR_WT in SW1088 cells by luciferase reporter assay, but not COL6A2-3′UTR_MUT. The miR-184 mimics reduced the luciferase activity of COL6A2-3′UTR_WT in HS683 cells by luciferase reporter assay, but not COL6A2-3′UTR_MUT. **P < 0.01, ***P < 0.001.
OncoTargets and Therapy downloaded from https://www.dovepress.com/ by 118.70.13.36 on 25-Aug-2020
LncRNA HOXA-AS2/miR-184/COL6A2
ceRNA Regulation Promoted Glioma Cell
Proliferation
In order to explore whether LncRNA HOXA-AS2/miR-184/ COL6A2 ceRNA regulation involved in glioma cell
prolif-eration, rescue experiments were performed. We first
knocked down (Figure S2A) or overexpressed HOXA-AS2
(Figure S2B), and knocked down COL6A2 (Figure S2C) in
glioma cells. The more effective siRNA sequence was selected for the further experiments. HOXA-AS2 upregula-tion increased COL6A2 expression in SW1088 cells, which
was partly reversed by miR-184 mimics (Figure 9A).
HOXA-AS2 downregulation suppressed COL6A2 expres-sion in HS683, which was restored by miR-184 inhibitors
to some extent (Figure 9A). Forcing expression of
HOXA-AS2 enhanced cell proliferation ability of SW1088 cells, and
the effect was attenuated by miR-184 mimics (Figure 9B). In
HS683 cells, HOXA-AS2 knockdown mediated cell prolif-eration inhibition was reversed by miR-184 inhibitors
(Figure 9B). HOXA-AS2-mediated COL6A2 upregulation
could be partly blocked by COL6A2 knockdown in SW1088
cells (Figure 9C). Double knockdown of HOXA-AS2 and
COL12A1 more apparently suppressed expression of COL6A2 in HS683 cells than single knockdown of
HOXA-AS2 and COL6A2 (Figure 9C). Cell proliferation
ability of SW1088 was enhanced by HOXA-AS2, which
was attenuated by COL6A2 downregulation (Figure 9D).
Double knockdown of HOXA-AS2 and COL6A2 more apparently inhibited cell proliferation in HS683 than single
knockdown of them (Figure 9D).
Discussion
Although glioma patients receive aggressive treatment including surgery, chemotherapy and radiotherapy, some
patients suffer tumor recurrence.26,27 Therefore, exploring
the recurrence mechanisms of glioma will be conducive to improving the diagnosis and treatment of glioma. An increas-ing number of studies have inferred the distinctions between
GBM and LGG.6–9 Hence, we explored the recurrence
mechanisms of GBM and LGG separately. By comparing them to primary samples, we found that recurrent samples of GBM and LGG showed distinct changes in transcriptomic characteristics due to less overlapping DEPs, DELs and DEMs. Further GO analysis using DEPs also indicated that the recurrent mechanisms of GBM were different from those of LGG. However, in GBM, we did not obtain similar results of GO analysis from the CGGA and TCGA databases, which
may be due to the large heterogeneity of GBM.28For
exam-ple, the markedly enriched GO terms (MF) in recurrent GBMs were protein heterodimerization activity and struc-tural constituent of ribosome in CGGA database and channel activity and passive transmembrane transporter activity in the TCGA database, although these GO terms have been
reported to contribute to GBM progression.28–31 Glioma
stem cells play critical roles in glioblastoma multiforme chemotherapy resistance and recurrence, such as CD133
cells.32 Glioma stem cells can self-renew and differentiate
into other specific GBM subpopulations, which is involved in
activation of Wnt/β-catenin pathway.33Maintenance of stem
cell characteristics may be involved in activation of the above
pathway related GBM recurrence.33,34Therefore, they have
been held responsible for malignant relapse after primary standard therapy and the poor prognosis of recurrent GBM. Nevertheless, the enriched GO terms in recurrent LGG in the CGGA database were similar to those in the TCGA database, which were involved in the extracellular matrix (mainly including collagens). The extracellular matrix plays pivotal roles in multiple biological processes in cancers, including
metastasis, immune evasion and drug resistance.35–37
Of the genes in the top 5 most relevant GO terms involved in LGG recurrence, TIMP1, COL1A1 and COL6A2 were upregulated in recurrent samples in both the CGGA and TCGA databases. In pancreatic cancer, high expression of TIMP1 can attenuate the gemcitabine therapy response and accelerate tumor growth and liver
metastasis.38 COL1A1 is a member of the collagen I
family and has been reported to be associated with tumor cell proliferation and invasion in many cancers, such as
breast, lung and renal cancers.39 As a member of the
Collagen VI family, COL6A2 is widely expressed in a
variety of cancers and favors cancer progression.40These
three core genes were found to interact with each other and with other genes involved in the extracellular matrix as demonstrated using the STRING database. Furthermore, hierarchical cluster analysis using the three genes indi-cated that there were two clusters of LGGs, and the High_risk group with high expression of these genes showed poor prognosis in primary LGGs. These results indicated the critical roles of these genes in LGG
recur-rence. These three genes have been reported to be signifi
-cantly associated with poor prognosis in other cancers,
such as bladder cancer and colorectal cancer.41,42 Many
previous studies have been designed to acquire prognostic signatures of microRNAs, pseudogenes and lncRNAs, and
the studies screened the genes by prognostic analyses.43–45
OncoTargets and Therapy downloaded from https://www.dovepress.com/ by 118.70.13.36 on 25-Aug-2020
However, in this study, we screened the hub genes by analyzing DEPs between recurrent and primary samples. Deng et al also screened DEPs between recurrent and
primary samples using TCGA data and identified hub
genes (APOA2, COL3A1, COL1A1, TYR, COL1A2, COL5A1, PAPOLB, IGF2BP1 and ANHX) by PPI
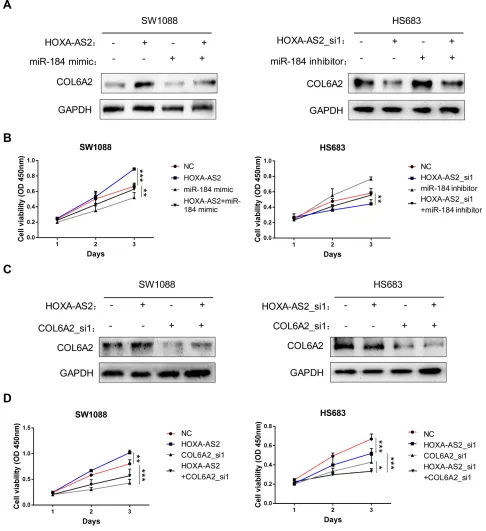
Figure 9HOXA-AS2/miR-184/COL6A2 ceRNA regulation promotes glioma cell proliferation.
Notes:(A) Overexpression of HOXA-AS2 increased COL6A2 protein level in SW1088 cells, which was blocked by miR-184 mimics. Knockdown of HOXA-AS2 decreased COL6A2 protein level in HS683 cells, which was partly reversed by miR-184 inhibitors. (B) HOXA-AS2-mediated cell proliferation was attenuated by miR-184 mimics in SW1088 cells. HOXA-AS2 knockdown inhibited cell proliferation in HS683 cells, which was partly reversed by miR-184 inhibitors. (C) Overexpression of HOXA-AS2 increased COL6A2 RNA and protein level in SW1088 cells, which was blocked by COL6A2 knockdown. Double knockdown of HOXA-AS2 and COL12A1 more apparently decreased COL6A2 RNA and protein level in HS683 cells than single knockdown of HOXA-AS2 and COL6A2. (D) HOXA-AS2-mediated cell proliferation was attenuated by COL6A2 downregulation in SW1088 cells. Double knockdown of HOXA-AS2 and COL12A1 more apparently inhibited cell proliferation of HS683 cells than single knockdown of HOXA-AS2 and COL6A2. *P < 0.05, **P < 0.01, ***P < 0.001.
OncoTargets and Therapy downloaded from https://www.dovepress.com/ by 118.70.13.36 on 25-Aug-2020
analysis, but did not intersect these data with those from
other databases.18Our screened hub genes were validated
in another dataset. Because some cases had both primary and recurrent lesions in the TCGA database, in order to obtain more reliable results, we analyzed DEPs, DELs and DEMs using mRNA-Seq and miRNA-Seq data from these cases. LGG patients were Chinese in CGGA and Westerners in TCGA. In this study, TIMP1, COL1A1 and COL6A2 were considered critical genes in the process of LGG recurrence and were identical in different geo-graphic locations.
It is well known that cancer progression is orchestrated
by a complex regulatory network.46,47Recently, many
stu-dies have reported that miRNAs and lncRNAs are involved in gene expression regulation. Song et al revealed a regula-tory network of CLDN4 in gastric cancer, which was mediated by miRNAs and lncRNAs, resulting in cancer
cell proliferation and invasion.48 In GBM, AGAP2-AS1
epigenetically decreases TFPI2 expression by binding to EZH2 and LSD1, and this biological process promotes
can-cer cell proliferation and invasion.49 Therefore, exploring
complex regulatory networks among protein-coding genes, lncRNAs and miRNAs will contribute to clarifying the recurrence mechanisms of cancer. In this study, we con-structed a coexpression networks among 12 protein coding genes, 12 miRNAs and 29 lncRNAs. Of the lncRNAs, HOXA10-AS was upregulated in LUAD tissues and corre-lated with poor prognosis in lung cancer patients, and HOXA-AS2 could promote cancer progression via compli-cated regulatory mechanisms, including induction of EMT,
direct inhibition of gene expression and methylation.50,51
For the screened miRNAs, miR-139-3p was identified as a
key miRNA related to hepatocellular carcinoma, and miR-326 could inhibit cell proliferation, migration, and invasion
by targeting oncogenic CCND1.52,53 In skin fibroblasts,
lncRNA AC067945.2 overexpression inhibited the
expres-sion of COL1A1, COL1A2, COL3A1.54Cao et al
demon-strated that lncRNA PVT1 promotes atrial fibrillation by
increasing collagen expression via the
miR-128-3p-SP1-TGF-β1-Smad axis in atrial fibroblasts.55 In this study, we
identified a complex regulatory network of extracellular
matrix-related genes, lncRNAs and miRNAs in the process of LGG recurrence.
The ceRNA network is also a critical regulatory
mechanism between lncRNAs and Mrna56,57We identified
a complex ceRNA network among 9 protein coding genes, 6 miRNAs and 12 lncRNAs. The results indicated that HOXA-AS2 could act as a competing endogenous RNA
(ceRNA) for miR-184 to regulate the hub gene COL6A2 expression. In osteosarcoma cells, LncRNA HOXA-AS2 could promote cancer cell migration and invasion by
act-ing as a ceRNA of miR-520c-3p.58Although the research
is not innovative enough, we confirmed that LncRNA
HOXA-AS2 sponge miR-184 with complementary bind-ing sites to increase expression of COL6A2, which resulted in LGG proliferation.
Conclusion
We demonstrated that the recurrence mechanisms of GBM and LGG are different at the transcriptional level, includ-ing protein codinclud-ing genes, lncRNAs and miRNAs. Further analysis revealed three critical genes, TIMP1, COL1A1
and COL6A2, and the 3-gene signature was identified to
improve prognosis prediction in LGG. Finally, LncRNA HOXA-AS2 acted as a ceRNA for miR-184 to regulate COL6A2 expression, and this ceRNA regulation induced cell proliferation in LGG.
Acknowledgments
Financial support from National Natural Science
Foundation of China (Number A344). We acknowledge the open databases of CCLE, CGGA and TCGA.
Disclosure
The authors report no conflicts of interest in this work.
References
1. Ostrom QT, Gittleman H, Truitt G, et al. CBTRUS statistical report: primary brain and other central nervous system tumors diagnosed in the United States in 2011–2015.Neuro Oncol.2018;20(suppl_4):iv1– iv86. doi:10.1093/neuonc/noy131
2. Lim M, Xia Y, Bettegowda C, et al. Current state of immunotherapy for glioblastoma. Nat Rev Clin Oncol. 2018;15(7):422–442. doi:10.1038/s41571-018-0003-5
3. Newman JP, Wang GY, Arima K, et al. Interleukin-13 receptor alpha 2 cooperates with EGFRvIII signaling to promote glioblastoma multi-forme.Nat Commun.2017;8:1913. doi:10.1038/s41467-017-01392-9 4. Broen MPG, Smits M, Wijnenga MMJ, et al. The T2-FLAIR
mis-match sign as an imaging marker for non-enhancing IDH-mutant, 1p/ 19q-intact lower-grade glioma: a validation study. Neuro Oncol.
2018;20:1393–1399. doi:10.1093/neuonc/noy048
5. Brat DJ, Verhaak RG, Aldape KD, et al. Comprehensive, integrative genomic analysis of diffuse lower-grade gliomas. N Engl J Med.
2015;372:2481–2498.
6. Karunasena E, McIver LJ, Rood BR, et al. Somatic intronic micro-satellite loci differentiate glioblastoma from lower-grade gliomas. Oncotarget.2014;5:6003–6014. doi:10.18632/oncotarget.2076 7. Reon BJ, Anaya J, Zhang Y, et al. Expression of lncRNAs in
low-grade gliomas and glioblastoma multiforme: an in silico analysis. PLoS Med.2016;13:e1002192. doi:10.1371/journal.pmed.1002192
OncoTargets and Therapy downloaded from https://www.dovepress.com/ by 118.70.13.36 on 25-Aug-2020
8. Paul Y, Mondal B, Patil V, et al. DNA methylation signatures for 2016 WHO classification subtypes of diffuse gliomas. Clin Epigenetics.2017;9(1):32. doi:10.1186/s13148-017-0331-9 9. Zhang X, Lu X, Liu Z, et al. Integrating multiple-level molecular data
to infer the distinctions between glioblastoma and lower-grade glioma.Int J Cancer.2019;145:952–961. doi:10.1002/ijc.32174 10. Teng H, Wang P, Xue Y, et al. Role of HCP5-miR-139-RUNX1
feedback loop in regulating malignant behavior of glioma cells.Mol Ther.2016;24:1806–1822. doi:10.1038/mt.2016.103
11. Cai H, Liu X, Zheng J, et al. Long non-coding RNA taurine upregu-lated 1 enhances tumor-induced angiogenesis through inhibiting microRNA-299 in human glioblastoma. Oncogene. 2017;36:318– 331. doi:10.1038/onc.2016.212
12. Zheng Y, Liu L, Shukla GC. A comprehensive review of web-based non-coding RNA resources for cancer research. Cancer Lett.
2017;407:1–8. doi:10.1016/j.canlet.2017.08.015
13. Li H, Xue Y, Ma J, et al. SNHG1 promotes malignant biological behaviors of glioma cells via microRNA-154-5p/miR-376b-3p-FOXP2- KDM5B participating positive feedback loop.J Exp Clin Cancer Res.2019;38:59. doi:10.1186/s13046-019-1063-9
14. Wu P, Cai J, Chen Q, et al. Lnc-TALC promotes O(6)-methylgua-nine-DNA methyltransferase expression via regulating the c-Met pathway by competitively binding with miR-20b-3p.Nat Commun.
2019;10:2045. doi:10.1038/s41467-019-10025-2
15. He K, Li WX, Guan D, et al. Regulatory network reconstruction of
five essential microRNAs for survival analysis in breast cancer by integrating miRNA and mRNA expression datasets. Funct Integr Genomics.2019;19:645–658. doi:10.1007/s10142-019-00670-7 16. Song J, Ye A, Jiang E, et al. Reconstruction and analysis of the
aberrant lncRNA-miRNA-mRNA network based on competitive endogenous RNA in CESC.J Cell Biochem.2018;119:6665–6673. doi:10.1002/jcb.26850
17. Lou W, Ding B, Xu L, et al. Construction of potential glioblastoma multiforme-related miRNA-mRNA regulatory network. Front Mol Neurosci.2019;12:66. doi:10.3389/fnmol.2019.00066
18. Deng T, Gong YZ, Wang XK, et al. Use of genome-scale integrated analysis to identify key genes and potential molecular mechanisms in recurrence of lower-grade brain glioma. Med Sci Monit.
2019;25:3716–3727. doi:10.12659/MSM.913602
19. Wu W, Yu T, Wu Y, et al. The miR155HG/miR-185/ANXA2 loop contributes to glioblastoma growth and progression. J Exp Clin Cancer Res.2019;38(1):133. doi:10.1186/s13046-019-1132-0 20. Wang Q, Cai J, Fang C, et al. Mesenchymal glioblastoma constitutes
a major ceRNA signature in the TGF-beta pathway. Theranostics.
2018;8:4733–4749. doi:10.7150/thno.26550
21. Long S, Li G. Comprehensive analysis of a long non-coding RNA-mediated competitive endogenous RNA network in glioblastoma multiforme. Exp Ther Med. 2019;18:1081–1090. doi:10.3892/ etm.2019.7647
22. Szklarczyk D, Morris JH, Cook H, et al. The STRING database in 2017: quality-controlled protein-protein association networks, made broadly accessible. Nucleic Acids Res. 2017;45:D362–D368. doi:10.1093/nar/gkw937
23. Cheng Z, Wang HZ, Li X, et al. MicroRNA-184 inhibits cell pro-liferation and invasion, and specifically targets TNFAIP2 in glioma.J Exp Clin Cancer Res.2015;34:27. doi:10.1186/s13046-015-0142-9 24. Xiang Z, Li J, Song S, et al. A positive feedback between IDO1
metabolite and COL12A1 via MAPK pathway to promote gastric cancer metastasis.J Exp Clin Cancer Res.2019;38:314. doi:10.1186/ s13046-019-1318-5
25. Lian Y, Li Z, Fan Y, et al. The lncRNA-HOXA-AS2/EZH2/LSD1 oncogene complex promotes cell proliferation in pancreatic cancer. Am J Transl Res.2017;9:5496–5506.
26. Pala A, Coburger J, Scherer M, et al. To treat or not to treat? A retrospective multicenter assessment of survival in patients with IDH-mutant low-grade glioma based on adjuvant treatment. J Neurosurg;2019. 1–8. doi:10.3171/2019.4.JNS183395
27. Shergalis A, Bankhead A 3rd, Luesakul U, et al. Current challenges and opportunities in treating glioblastoma. Pharmacol Rev.
2018;70:412–445. doi:10.1124/pr.117.014944
28. Dirkse A, Golebiewska A, Buder T, et al. Stem cell-associated heterogeneity in glioblastoma results from intrinsic tumor plasticity shaped by the microenvironment. Nat Commun. 2019;10:1787. doi:10.1038/s41467-019-09853-z
29. Morelli MB, Amantini C, Tomassoni D, et al. Transient receptor potential mucolipin-1 channels in glioblastoma: role in patient’s survival. Cancers (Basel). 2019;11:525. doi:10.3390/ cancers11040525
30. Chakravarty D, Pedraza AM, Cotari J, et al. EGFR and PDGFRA co-expression and heterodimerization in glioblastoma tumor sphere lines.Sci Rep.2017;7:9043. doi:10.1038/s41598-017-08940-9 31. Ruan M, Liu J, Ren X, et al. Whole transcriptome sequencing
analyses of DHA treated glioblastoma cells. J Neurol Sci.
2019;396:247–253. doi:10.1016/j.jns.2018.11.027
32. Auffinger B, Spencer D, Pytel P, et al. The role of glioma stem cells in chemotherapy resistance and glioblastoma multiforme recurrence. Expert Rev Neurother. 2015;15(7):741–752. doi:10.1586/ 14737175.2015.1051968
33. Janda CY, Dang LT, You C, et al. Surrogate Wnt agonists that phenocopy canonical Wnt and beta-catenin signalling. Nature.
2017;545:234–237. doi:10.1038/nature22306
34. Klumpp L, Sezgin EC, Skardelly M, et al. KCa3.1 channels and glioblastoma: in vitro studies. Curr Neuropharmacol. 2018;16 (5):627–635. doi:10.2174/1570159X15666170808115821
35. Hanker AB, Estrada MV, Bianchini G, et al. Extracellular matrix/ integrin signaling promotes resistance to combined inhibition of HER2 and PI3K in HER2(+) breast cancer. Cancer Res.
2017;77:3280–3292. doi:10.1158/0008-5472.CAN-16-2808 36. Chakravarthy A, Khan L, Bensler NP, et al. TGF-beta-associated
extracellular matrix genes link cancer-associated fibroblasts to immune evasion and immunotherapy failure. Nat Commun.
2018;9:4692. doi:10.1038/s41467-018-06654-8
37. Yuzhalin AE, Gordon-Weeks AN, Tognoli ML, et al. Colorectal cancer liver metastatic growth depends on PAD4-driven citrullination of the extracellular matrix.Nat Commun.2018;9:4783. doi:10.1038/ s41467-018-07306-7
38. D’Costa Z, Jones K, Azad A, et al. Gemcitabine-induced TIMP1 attenuates therapy response and promotes tumor growth and liver metastasis in pancreatic cancer. Cancer Res. 2017;77:5952–5962. doi:10.1158/0008-5472.CAN-16-2833
39. Shi Y, Duan Z, Zhang X, et al. Down-regulation of the let-7i facil-itates gastric cancer invasion and metastasis by targeting COL1A1. Protein Cell.2019;10(2):143–148. doi:10.1007/s13238-018-0550-7 40. Chen P, Cescon M, Bonaldo P. Collagen VI in cancer and its
biolo-gical mechanisms. Trends Mol Med. 2013;19(7):410–417. doi:10.1016/j.molmed.2013.04.001
41. Chen L, Lu D, Sun K, et al. Identification of biomarkers associated with diagnosis and prognosis of colorectal cancer patients based on integrated bioinformatics analysis. Gene. 2019;692:119–125. doi:10.1016/j.gene.2019.01.001
42. Zhu H, Chen H, Wang J, et al. Collagen stiffness promoted non-muscle-invasive bladder cancer progression to non-muscle-invasive blad-der cancer. Onco Targets Ther. 2019;12:3441–3457. doi:10.2147/ OTT.S194568
43. Qian Z, Li Y, Fan X, et al. Prognostic value of a microRNA signature as a novel biomarker in patients with lower-grade gliomas. J Neurooncol.2018;137:127–137. doi:10.1007/s11060-017-2704-5
OncoTargets and Therapy downloaded from https://www.dovepress.com/ by 118.70.13.36 on 25-Aug-2020
44. Liu B, Liu J, Liu K, et al. A prognostic signature offive pseudogenes for predicting lower-grade gliomas. Biomed Pharmacother.
2019;117:109116. doi:10.1016/j.biopha.2019.109116
45. Kiran M, Chatrath A, Tang X, et al. A prognostic signature for lower grade gliomas based on expression of long non-coding RNAs.Mol Neurobiol.2019;56(7):4786–4798. doi:10.1007/s12035-018-1416-y 46. Syafruddin SE, Rodrigues P, Vojtasova E, et al. A KLF6-driven
transcriptional network links lipid homeostasis and tumour growth in renal carcinoma. Nat Commun. 2019;10:1152. doi:10.1038/ s41467-019-09116-x
47. Takaku M, Grimm SA, Roberts JD, et al. GATA3 zinc finger 2 mutations reprogram the breast cancer transcriptional network.Nat Commun.2018;9:1059. doi:10.1038/s41467-018-03478-4
48. Song YX, Sun JX, Zhao JH, et al. Non-coding RNAs participate in the regulatory network of CLDN4 via ceRNA mediated miRNA evasion.Nat Commun.2017;8:289. doi:10.1038/s41467-017-00304-1 49. Luo W, Li X, Song Z, et al. Long non-coding RNA AGAP2-AS1 exerts oncogenic properties in glioblastoma by epigenetically silen-cing TFPI2 through EZH2 and LSD1.Aging (Albany NY).2019;11 (11):3811–3823. doi:10.18632/aging.102018
50. Li L, Wang Y, Song G, et al. HOX cluster-embedded antisense long non-coding RNAs in lung cancer. Cancer Lett. 2019;450:14–21. doi:10.1016/j.canlet.2019.02.036
51. Wang J, Su Z, Lu S, et al. LncRNA HOXA-AS2 and its molecular mechanisms in human cancer.Clin Chim Acta.2018;485:229–233. doi:10.1016/j.cca.2018.07.004
52. Wang X, Gao J, Zhou B, et al. Identification of prognostic markers for hepatocellular carcinoma based on miRNA expression profiles. Life Sci.2019;232:116596. doi:10.1016/j.lfs.2019.116596
53. Sun C, Huang C, Li S, et al. Hsa-miR-326 targets CCND1 and inhibits non-small cell lung cancer development. Oncotarget.
2016;7:8341–8359. doi:10.18632/oncotarget.7071
54. Chen L, Li J, Li Q, et al. Overexpression of LncRNA AC067945.2 down-regulates collagen expression in skinfibroblasts and possibly correlates with the VEGF and Wnt signalling pathways.Cell Physiol Biochem.2018;45:761–771. doi:10.1159/000487167
55. Cao F, Li Z, Ding WM, et al. LncRNA PVT1 regulates atrialfibrosis via miR-128-3p-SP1-TGF-beta1-Smad axis in atrialfibrillation.Mol Med.2019;25:7. doi:10.1186/s10020-019-0074-5
56. Bai Y, Long J, Liu Z, et al. Comprehensive analysis of a ceRNA network reveals potential prognostic cytoplasmic lncRNAs involved in HCC progression. J Cell Physiol. 2019;234:18837–18848. doi:10.1002/jcp.28522
57. Li XY, Zhou LY, Luo H, et al. The long noncoding RNA MIR210HG promotes tumor metastasis by acting as a ceRNA of miR-1226-3p to regulate mucin-1c expression in invasive breast cancer. Aging (Albany NY).2019;11(15):5646.
58. Wang Y, Zhang R, Cheng G, et al. Long non-coding RNA HOXA-AS2 promotes migration and invasion by acting as a ceRNA of miR-520c-3p in osteosarcoma cells.Cell Cycle.2018;17(13):1637–1648. doi:10.1080/15384101.2018.1489174
OncoTargets and Therapy
Dove
press
Publish your work in this journal
OncoTargets and Therapy is an international, peer-reviewed, open access journal focusing on the pathological basis of all cancers, potential targets for therapy and treatment protocols employed to improve the management of cancer patients. The journal also focuses on the impact of management programs and new therapeutic
agents and protocols on patient perspectives such as quality of life, adherence and satisfaction. The manuscript management system is completely online and includes a very quick and fair peer-review system, which is all easy to use. Visit http://www.dovepress.com/ testimonials.php to read real quotes from published authors.
Submit your manuscript here:https://www.dovepress.com/oncotargets-and-therapy-journal
OncoTargets and Therapy downloaded from https://www.dovepress.com/ by 118.70.13.36 on 25-Aug-2020