IJIRT 144060
INTERNATIONAL JOURNAL OF INNOVATIVE RESEARCH IN TECHNOLOGY284
OPTIMIZATION OF PROCESS PARAMETERS IN
CNC TURNING USING RSM
Yakala Mani Ratnam
1, N Govindu
2, Vikas Ranjan
3 1M.Tech (Cad/Cam)
2
Asst.Professor, Mechanical Engineering Dept
3M.Tech, Asst.Professor
Abstract— Efficient turning of EN8 steel material can be achieved through proper selection of turning process parameters to maximize material removal rate and minimum surface roughness. For this achievement, design of experiments (DOE) has been used to study the effects of machining parameters such as cutting speed, feed, depth of cut on the surface roughness and material removal rate of EN8 steel. A mathematical prediction model of the surface roughness and material removal rate has been developed in terms of the above parameters and also the effect of these parameters on the surface roughness and material removal rate has been investigated by using response surface methodology (RSM). Prediction models are developed with the help of RSM using MINITAB-16 software and finally the optimal and predicated results are also verified with the help of confirmation experiments.
I. INTRODUCTION
Turning is one of the fundamental machining processes, especially for the finishing of machined parts. Usually, the selection of appropriate machining parameters is difficult and relies heavily on the operators’ experience and the machining parameters tables provided by the machine-tool builder for the target material. Hence, the optimization of operating parameters is of great importance where the economy and quality of a machined part play a key role [1]. Proper selection of cutting tools, parameters, and conditions for optimal surface quality (as well as tool life) requires a more methodical approach by using experimental methods and mathematical and statistical models. Not only does this require considerable knowledge and experience to design experiments and analyze data, but traditional design-of-experiment (DOE) technique require a large number of samples to be produced .
The optimization techniques of machining parameters through experimental methods and mathematical and statistical models have grown substantially over time to achieve a common goal of improving higher machining process efficiency [5]. To construct an approximation model that can capture interactions between design variables, a full factorial approach may be necessary to investigate all possible combinations [5]. A factorial experiment is an experimental strategy in which design variables are varied together, instead of one at a time. The lower and upper bounds of each of n design variables
in the optimization problem needs to be defined
.
The allowable range is then discredited at different levels. If each of the variables is defined at only the lower and upper bounds (two levels), the experimental design is called 2n full factorial [6]. Factorial designs can be used for fitting second-order models. A second-order model can significantly improve the optimization process when a first-order model suffers lack of fit due to interaction between variables and surface curvature. By careful design of experiments, the objective is to optimize a response (output variable) which is influenced by several independent variables (input variables)Cutting speed (also called surface speed or simply speed) is the speed difference (relative velocity) between the cutting tool and the surface of the workpiece it is operating on. It is expressed in units of distance along the workpiece surface per unit of time, typically surface feet per minute (sfm) or meters per minute (m/min).
IJIRT 144060
INTERNATIONAL JOURNAL OF INNOVATIVE RESEARCH IN TECHNOLOGY285
Feed rate units depend on the motion of the tool and workpiece; when the workpiece rotates (e.g., in turning and boring), the units are almost always distance per spindle revolution (inches per revolution [in/revipr] or millimeters per revolution [mm/rev]).
For a given material there will be an optimum cutting speed for a certain set of machining conditions, and from this speed the spindle speed (RPM) can be calculated. Factors affecting the calculation of cutting speed are:
1. The material being machined (steel, brass, tool steel, plastic, wood) (see table below)
2. The material the cutter is made from (Carbon steel, high speed steel (HSS), carbide, ceramics)
3. The economical life of the cutter (the cost to regrind or purchase new, compared to the quantity of parts produced)
4. Cutting speeds are calculated on the assumption that optimum cutting conditions exist, these include: 5. Metal removal rate (finishing cuts that remove a small amount of material may be run at increased speeds)
6. Full and constant flow of cutting fluid (adequate cooling and chip flushing)
7. Rigidity of the machine and tooling setup (reduction in vibration or chatter)
8. Continuity of cut (as compared to an interrupted cut, such as machining square section material in a lathe)
9. Condition of material (mill scale, hard spots due to white cast iron forming in castings)
Feed rate is the velocity at which the cutter is fed, that is, advanced against the workpiece. It is expressed in units of distance per revolution for turning and boring (typically inches per revolution [ipr] or millimeters per revolution). It can be expressed thus for milling also, but it is often expressed in units of distance per time for milling
(typically inches per minute [ipm] or millimeters per minute), with considerations of how many teeth (or flutes) the cutter has then determining what that means for each tooth.
Feed rate is dependent on the:
1. Type of tool (a small drill or a large drill, high speed or carbide, a box tool or recess, a thin form tool or wide form tool, a slide knurl or a turret straddle knurl).
2. Surface finish desired.
3. Power available at the spindle (to prevent stalling of the cutter or workpiece).Rigidity of the machine and tooling setup (ability to withstand vibration or chatter).
4. Strength of the workpiece (high feed rates will collapse thin wall tubing)
5. Characteristics of the material being cut, chip flow depends on material type and feed rate. The ideal chip shape is small and breaks free early, carrying heat away from the tool and work.
6. Threads per inch (TPI) for taps, die heads and threading tools.
Response surface methodology is a collection of mathematical and statistical techniques that are useful for the modeling and analysis of problems in which a response of interest is influenced by several variables and the objective is to optimize this response.
It explores the relationships between several explanatory variables and one or more response variables. The method was introduced by G. E. P. Box and K. B. Wilson in 1951. The main idea of RSM is to use a sequence of designed experiments to obtain an optimal response. Box and Wilson suggest using a second-degree polynomial model to do this.
II. LITERATURE REVIEW
IJIRT 144060
INTERNATIONAL JOURNAL OF INNOVATIVE RESEARCH IN TECHNOLOGY286
Pragnesh. R. Patel(2012): Investigate the effects of different cutting parameters (Cutting Speed, feed rate, Depth of cut) on surface roughness and Power Consumption in turning of 6063 AL alloy TiC (MMCs). PCD tool was used as wear resistive tool in order to achieve desire surface finish. Full factorial Design in design of experiment was adopted in order to planning the experimental runs. Analysis of Variance was used to investigate percentage Contribution of Each process parameters on output Response. Results show that feed rate is significant parameter, which affect on surface roughness; and Cutting Speed is effective parameter which affect on power consumption. [2]
R.A. Mahdavinejad et al. (2011) :Investigate paper the optimize turning parameters of AISI 304 stainless steel. Turning tests have been performed in three different feed rates, cutting speeds with and without cutting fluid. A design of experiments (DOE) and an analysis of variance (ANOVA) have been made to determine the effects of each parameter on the tool wear and the surface roughness. It is being inferred that cutting speed has the main influence on the flank wear and as it increases, the flank wear decreases. Sukumar et al. (2012): Investigate the effects ofmachining parameter on CNC turning of martensitic stainless steel using RSM(Response surface methodology) and GA(Genetic algorithm). The results obtained from RSM are R-Sq obtained was 99.9% which indicates that selected parameters (speed, feed, depth of cut) significantly affect the response (surface roughness). [4]
M. Kaladhar et al. (2011): Investigate the effects of process parameters on surface finish and material removal rate (MRR) to obtain the optimal setting of these process parameters on AISI 304 steel. The Analysis Of Variance (ANOVA) is also used to analyze the influence of cutting parameters during machining. The results revealed that the feed and nose radius is the most significant process parameters on work piece surface roughness. However, the depth of cut and feed are the significant factors on MRR.[5]
III. EXPERIMENTAL PROCEDURE
The main objective in using experimental design is to provide maximum and accurate information in the results, along with the most efficient use of existing data. Here experiments were designed on the basis of the experimental design
technique. A 2k factorial, where k is the number of variables, with central composite-second-order ratable design, was used to improve of reliability of results and to reduce the size of experimentation without loss of accuracy. The main objective of the factorial experiments consists of studying the relationship between the response as a dependent variable and the parameter levels. This approach helps to better understand how the change in the levels of application of a group of parameters affects the response.
3.1.1 Central composite design
Here we study the result of the effects of speed, feed and depth of cut on the Material Removal Rate (MRR). A 2K factorial with central
composite-second order rotatable design (CCRD) is used (in this case k = 3).
This consist of nc = 2k = 6 corner points at
+1 level, na = 2k = 6 axial points at γ = +1.414, and a
center point at zero level repeated five times (no) to estimate the pure error. The axial points are chosen such that they allow ratability which ensures that the variance of the model prediction is constant at all points equidistant from the design center.
Replicates of the test at the center are very important as they provide an independent estimate of the experimental error. The precision of the estimated surface does not depend on the orientation of design with respect to the true response surface or the direction of the search for optimum conditions.
The values of coded and actual value of each parameter used in this work are listed in the table (4.1). The experimental matrix that was adopted here in the coded form is shown in table. The coded number for variables used in table and table are obtained from the following transformation equation: Χi = (Chosen parametric values – Central rank value)
/ (Incremental parametric value)
IV. FABRICATION AND EXPERIMENTATION
4.1 Experimentation setup
IJIRT 144060
INTERNATIONAL JOURNAL OF INNOVATIVE RESEARCH IN TECHNOLOGY287
Fig: 4.1 CNC lathe
4.2 TOOL SPECIFICATIONS CNMG 09 03 08-PF 4325
insert seat size code - 09 Insert seat size code - 3/8 Operation type - Finishing Cutting edge length - 9.6719 mm Insert thickness - 3.175 mm
Inscribed circle diameter - 9.525 mm Corner radius - 0.8 mm
Fixing hole diameter - 3.81 mm hand - N
Tool style code CNMG-PF Grade - 4325
Insert shape code - C
Fig: 4.2 CNMG insert 4.3 Studies after CNC lathe Material removal rate (MRR):
This is to ascertain the amount of material transferred to the work piece. In turning operation material is removed due to shear force caused by the cutting tool.
Material removal rate
N f
L 4
2 2 1
2
r
)
D
-D
(
L
*
=
MRR
Where L is length cut
fr is machine feed rate
units/revolution
D1 is initial diameter
D2 is Finished Diameter
N = machine speed in
revolutions/minute (RPM) Surface Roughness(Ra):
After completed the turning operation we are finding the surface roughness Ra values by using the taly surf. Each experiment we take three values in three different places after that average of this three is the best value of surfeace roughness Ra value. 4.4. Planning for experimentation
Keeping in view of the present research objectives, experimental investigation and analysis were carried out in different parametric combinations, for deriving effective parametric combination. The experimental scheme has been designed in such a way that the objectives of the study can be fulfilled satisfactorily. The job material was EN8 also known as 080M40, unalloyed medium carbon steel. The size of workpiece is length-60mm x 32mm Ø. The length over which machining is done is 40mm.
Chemical Composition:
C - 0.35/0.45 %, Si - 0.05/0.35 %, Mn - 0.60/1.00 %, S - 0.06 % , P - 0.06%
4.5 Photographs of experimental setup, and work samples
Fig: 4.3 Machining on CNC
IJIRT 144060
INTERNATIONAL JOURNAL OF INNOVATIVE RESEARCH IN TECHNOLOGY288
Fig: 4.5 Tool holder
Fig: 4.6 Cutting of workpieces on power hacksaw
4.6 Effect of process parameters:
Effect of speed, feed and depth of cut on material removal rate (MRR)
The values of MRR (material removal rate) are calculated for each sample and given in table-4.5. The graphical representation of variation of MRR (material removal rate) with other controlling parameters is shown below.
FIG: 4.7
FIG: 4.8
FIG: 4.9
From the figure, it is obvious that increase in depth of cut and feed rate greatly increases the material removal rate at higher pace. There will be an enormous increase or decrease of MRR (material removal rate) with change in these parameters.
From the figure, it is obvious that increase in depth of cut and feed rate greatly increases the material removal rate at higher pace. There will be an enormous increase or decrease of MRR (material removal rate) with change in these parameters.
FIG: 4.10 0.259
0.225 0.175 0.125 0.090 150
140
130
120
110
100
90
80
70
60
FEED(MM/REV)
M
R
R
(M
M
^
3
/M
IN
)
MRR Vs FEED
1170 1000
750 500
330 150
125
100
75
50
CUTTING SPEED(R.P.M)
M
R
R
(M
M
^
3
/M
IN
)
MRR Vs CUTTING SPEED
1.238 1.000 0.650 0.300 0.061 200
175
150
125
100
75
50
DEPTH.OF.CUT(MM)
M
R
R
(M
M
^
3
/M
IN
)
MRR Vs DEPTH OF CUT
0.259 0.225
0.175 0.125
0.090 3.4
3.2
3.0
2.8
2.6
2.4
2.2
2.0
FEED(MM/REV)
R
a
(M
U
-M
)
IJIRT 144060
INTERNATIONAL JOURNAL OF INNOVATIVE RESEARCH IN TECHNOLOGY289
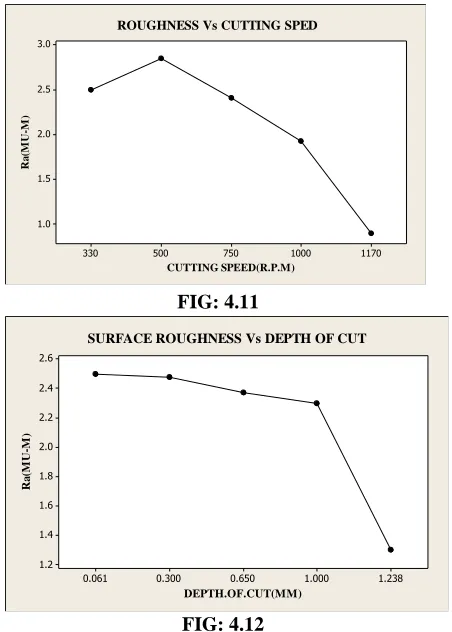
FIG: 4.11
FIG: 4.12
The material removal rate in turning process mainly depends on the parameters (speed, feed and depth of cut). A small change in one variable can abruptly change the output. So it is very difficult to establish models without mathematical analysis. In this chapter the process modeled response surface methodology (RSM)
V. DEVELOPMENT OF MODELS BASED
ON RSM
After knowing the values of the observed response, the values of the different regression coefficients of second order polynomial mathematical equation have been evaluated and the mathematical models based on the response surface methodology have been developed by utilizing test results of different responses obtained through the entire set of experiments by using a computer software, MINITAB.
5.1 Model for material removal rate (MRR)
The response surface methodology analysis has been done to establish the relationship between material removal rate (MRR) and the important process parameters, like cutting speed, feed rate and depth of cut. Based on the MRR test results obtained
from the planned experiments, as shown in table, the values of different constants of the Equation are obtained for material removal rate (MRR) model. The mathematical relationship for correlating the MRR and machining parameters has been established as follows:
Yu(MRR)=110.570+24.495X1+29.
408X2+45.246X3-4.734X12-
4.671X22+12.212X32+11.212X1X2+
18.3X1X3+20.929X2X3
This mathematical model has been obtained to reflect the independent, quadratic and interactive effects of the various machining parameters on the material removal rate (MRR) in machining.
Table 5.1
Response Surface Regression: MRR versus speed, feed and depth of cut
The analysis was done using coded units.
Estimated Regression Coefficients for C4
Term Coef SECoef T P Constant 110.570 5.921 18.673 0.000 C1 24.495 3.928 6.235 0.000 C2 29.408 3.928 7.486 0.000 C3 45.246 3.928 11.517 0.000 C1*C1 -4.734 3.824 -1.238 0.244 C2*C2 -4.671 3.824 -1.222 0.250 C3*C3 12.212 3.824 3.194 0.010 C1*C2 11.212 5.133 2.184 0.054 C1*C3 18.300 5.133 3.565 0.005 C2*C3 20.929 5.133 4.077 0.002
S = 14.5184 PRESS = 15611.3
R-Sq = 96.51% R-Sq(pred) = 74.13% R-Sq(adj) = 93.36%
Analysis of Variance for C4
Source DF Seq SS Adj SS Adj MS F P
Regression 9 58240.958240.9 6471.2 30.70 0.000
Linear 3 47967.247967.2 15989.1 75.85 0.000
C1 1 8194.7 8194.78194.738.88 0.000 C2 1 11811.711811.711811.7 56.04 0.000
C3 1 27960.827960.827960.8 132.65 0.000
1170 1000
750 500
330 3.0
2.5
2.0
1.5
1.0
CUTTING SPEED(R.P.M)
R
a
(M
U
-M
)
ROUGHNESS Vs CUTTING SPED
1.238 1.000
0.650 0.300
0.061 2.6
2.4
2.2
2.0
1.8
1.6
1.4
1.2
DEPTH.OF.CUT(MM)
R
a
(M
U
-M
)
IJIRT 144060
INTERNATIONAL JOURNAL OF INNOVATIVE RESEARCH IN TECHNOLOGY290
Square 3 3084.7 3084.7 1028.2 4.88 0.024
C1*C1 1 430.6 323.1 323.11.53 0.244 C2*C2 1 504.3 314.5 314.51.49 0.250 C3*C3 1 2149.9 2149.92149.910.20 0.010 Interaction 3 7189.0 7189.0 2396.3 11.37 0.001
C1*C2 1 1005.6 1005.61005.64.77 0.054 C1*C3 1 2679.2 2679.22679.212.71 0.005 C2*C3 1 3504.1 3504.13504.116.62 0.002 Residual Error 10 2107.9 2107.9 210.8
Lack-of-Fit 5 2034.9 2034.9 407.0 27.90 0.001
Pure Error 5 72.9 72.9 14.6 Total 19 60348.8
Unusual Observations for C8
Obs StdOrder C8 Fit SE Fit Residual St Resid
13 13 96.380 68.951 11.334 27.429 3.01 R
R denotes an observation with a large standardized residual.
Predicted Response for New Design Points Using Model for C8
Point Fit SE Fit 95% CI 95% PI 1 64.609 11.9022 ( 38.090, 91.129) ( 22.736, 106.483)
2 54.590 11.9022 ( 28.071, 81.110) ( 12.717, 96.464)
3 59.137 11.9022 ( 32.617, 85.657) ( 17.264, 101.010)
4 93.968 11.9022 ( 67.448, 120.488) ( 52.095, 135.841)
5 76.661 11.9022 ( 50.141, 103.180) ( 34.787, 118.534)
6 139.792 11.9022 (113.272, 166.312) ( 97.918, 181.665)
7 154.938 11.9022 (128.418, 181.458) (113.065, 196.811)
8 262.919 11.9022 (236.399, 289.439) (221.046, 304.793)
9 55.935 11.3336 ( 30.682, 81.188) ( 14.852, 97.017)
10 138.311 11.3336 (113.058, 163.564) ( 97.228, 179.393)
11 47.855 11.3336 ( 22.602, 73.108) ( 6.772, 88.937)
12 146.791 11.3336 (121.538, 172.044) (105.708, 187.873)
13 68.951 11.3336 ( 43.698, 94.204) ( 27.868, 110.033)
14 221.155 11.3336 (195.902, 246.408) (180.072, 262.238)
15 110.518 5.9315 ( 97.302, 123.734) ( 75.522, 145.514)
16 110.518 5.9315 ( 97.302, 123.734) ( 75.522, 145.514)
17 110.518 5.9315 ( 97.302, 123.734) ( 75.522, 145.514)
18 110.518 5.9315 ( 97.302, 123.734) ( 75.522, 145.514)
19 110.518 5.9315 ( 97.302, 123.734) ( 75.522, 145.514)
20 110.518 5.9315 ( 97.302, 123.734) ( 75.522, 145.514)
Table: 5.2
5.2 Model for Surface Roughness(Ra):
The response surface methodology analysis has been done to establish the relationship between surface roughness and the important process parameters, like cutting speed, feed rate and depth of cut. Based on the surface roughness test results obtained from the planned experiments, as shown in table, the values of different constants of the Equation are obtained for surface roughness model. The mathematical relationship for correlating the surface roughness and machining parameters has been established as follows:
IJIRT 144060
INTERNATIONAL JOURNAL OF INNOVATIVE RESEARCH IN TECHNOLOGY291
0.08X22-0.04X32+0.11X1X2
-0.11X1X3-0.21X2X3
This mathematical model has been obtained to reflect the independent, quadratic and interactive effects of the various machining parameters on the surface roughness in machining.
Table 5.3
Response Surface Regression: C8 versus C1, C2, C3
The analysis was done using uncoded units.
Estimated Regression Coefficients for C8
Term Coef SE Coef T P Constant 2.49940 0.007623 327.883 0.000 C1 -0.06124 0.005058 -12.109 0.000 C2 -0.31852 0.005058 -62.979 0.000 C3 -0.14212 0.005058 -28.100 0.000 C1*C1 0.03927 0.004923 7.977 0.000 C2*C2 -0.08447 0.004923 -17.157 0.000 C3*C3 -0.04912 0.004923 -9.976 0.000 C1*C2 0.11250 0.006608 17.025 0.000 C1*C3 -0.11250 0.006608 -17.025 0.000 C2*C3 -0.21250 0.006608 -32.158 0.000
S = 0.0186904 PRESS = 0.0284491
R-Sq = 99.86% R-Sq(pred) = 98.84% R-Sq(adj) = 99.73%
Analysis of Variance for C8
Source DF Seq SS Adj SS Adj MS F P
Regression 9 2.44201 2.44201 0.27133 776.73 0.000
Linear 3 1.71261 1.71261 0.57087 1634.18 0.000
C1 1 0.05122 0.05122 0.05122 146.62 0.000
C2 1 1.38555 1.38555 1.38555 3966.30 0.000
C3 1 0.27584 0.27584 0.27584 789.62 0.000
Square 3 0.16565 0.16565 0.05522 158.06 0.000
C1*C1 1 0.03868 0.02223 0.02223 63.63 0.000
C2*C2 1 0.09221 0.10283 0.10283 294.36 0.000
C3*C3 1 0.03476 0.03476 0.03476 99.52 0.000
Interaction 3 0.56375 0.56375 0.18792 537.93 0.000
C1*C2 1 0.10125 0.10125 0.10125 289.84 0.000
C1*C3 1 0.10125 0.10125 0.10125 289.84 0.000
C2*C3 1 0.36125 0.36125 0.36125 1034.12 0.000
Residual Error 10 0.00349 0.00349 0.00035 Lack-of-Fit 5 0.00349 0.00349 0.00070 * *
Pure Error 5 0.00000 0.00000 0.00000 Total 19 2.44550
Unusual Observations for C8
Obs StdOrder C8 Fit SE Fit Residual St Resid
3 3 2.300 2.277 0.015 0.023 2.10 R 8 8 1.700 1.671 0.015 0.029 2.73 R 12 12 1.700 1.725 0.015 -0.025 -2.12 R
R denotes an observation with a large standardized residual.
Predicted Response for New Design Points Using Model for C8
Point Fit SE Fit 95% CI 95% PI 1 2.71447 0.0152961 (2.68039, 2.74855) (2.66065, 2.76828)
2 2.59199 0.0152961 (2.55790, 2.62607) (2.53817, 2.64580)
3 2.27743 0.0152961 (2.24335, 2.31151) (2.22362, 2.33124)
4 2.60495 0.0152961 (2.57086, 2.63903) (2.55113, 2.65876)
5 3.08023 0.0152961 (3.04615, 3.11431) (3.02642, 3.13404)
6 2.50775 0.0152961 (2.47367, 2.54183) (2.45393, 2.56156)
7 1.79319 0.0152961 (1.75911, 1.82727) (1.73938, 1.84700)
IJIRT 144060
INTERNATIONAL JOURNAL OF INNOVATIVE RESEARCH IN TECHNOLOGY292
9 2.71348 0.0145653 (2.68102, 2.74593) (2.66068, 2.76627)
10 2.50749 0.0145653 (2.47503, 2.53994) (2.45469, 2.56028)
11 2.79617 0.0145653 (2.76371, 2.82862) (2.74337, 2.84896)
12 1.72480 0.0145653 (1.69234, 1.75725) (1.67200, 1.77760)
13 2.59950 0.0145653 (2.56704, 2.63195) (2.54670, 2.65229)
14 2.12147 0.0145653 (2.08901, 2.15392) (2.06867, 2.17426)
15 2.49940 0.0076228 (2.48242, 2.51639) (2.45443, 2.54438)
16 2.49940 0.0076228 (2.48242, 2.51639) (2.45443, 2.54438)
17 2.49940 0.0076228 (2.48242, 2.51639) (2.45443, 2.54438)
18 2.49940 0.0076228 (2.48242, 2.51639) (2.45443, 2.54438)
19 2.49940 0.0076228 (2.48242, 2.51639) (2.45443, 2.54438)
20 2.49940 0.0076228 (2.48242, 2.51639) (2.45443, 2.54438)
Table 5.4
VI. CONCLUSIONS
The present study was carried out to study the effect of input parameters on the material removal rate and surface roughness. The following conclusions have been drawn from the study:
1. The Material removal rate is mainly affected by cutting speed and feed rate. With the increase in cuttingspeed the material removal rate is increases & as the feed rate increases the material removal rate increases.
2. The surface roughness is mainly affected by cutting speed and feed rate. With the increase in cuttingspeed the surface roughness is decreases & as the feed rate increases the surface roughness decreases.
3. From ANOVA analysis, parameters making significant effect on material removal rate and surface roughness feed rate, and interaction between feed rate & cutting speed were found to be significant to Material removal rate for reducing the variation.
4. The parameters considered in the
experiments are optimized to attain maximum material removal rate and minimum surface roughness. The best setting of input process parameters for defect free turning (maximum material removal rate) within the selected range is as follows:
i) Speed is 1000rpm
ii) Feed rate i.e. 0.225mm/rev. iii) Depth of cut should be 1.0mm
REFERENCES
[1] Kamal Hassan, Anish Kumar, M.P.Garg. “Experimental investigation of Material removal rate in CNC turning using Taguchi method” International Journal of Engineering Research and Applications Vol. 2 (2012) pp.1581-1590.
[2] Pragnesh. R. Patel, Prof. V. A. Patel. “Effect of machining parameters on Surface roughness and Power consumption for 6063 Al alloy TiC Composites (MMCs)” International Journal of Engineering Research and Applications Vol. 2 (2012) pp.295-300.
[3] R A Mahdavinejad, S Saeedy. “Investigation of the influential parameters of machining of AISI 304 stainless steel” Sadhana Vol. 36, Part 6 (2011) pp.963–970.
[4] Sukumar, Poornima. “Optimization of machining parameters in CNC turning of martensitic stainless steel using RSM and GA” International Journal of Modern Engineering Research (IJMER) Vol.2, Issue.2, (Apr. 2012) pp.539-542.
IJIRT 144060
INTERNATIONAL JOURNAL OF INNOVATIVE RESEARCH IN TECHNOLOGY293
[6] Ahmet Hascalik. Ulas Caydas (2008) “Optimization of turning parameters for surface roughness and tool life based on the Taguchi method”, International Journal Advance Manufacturing Technology,38:896-903.
[7] Tian-Syung Lan. Ming-Yang Wang (2009) “Competitive parameter optimization of multi-quality CNC turning”, International JournalAdvance Manufacturing Technology, 41:820-826.
[8] K. Chandrasekaran et al (2012) “Machining performance of TiCN/Al2O3 multilayer and B-Tic nano multilayer coated inserts on martensitic stainless steel in CNC turning”, Springer India 2012. [9] B Kumaragurubaran1, P Gopal1, T Senthil Kumar, M Prasanna Mugunthan, “ optimization of turning parameters of EN-9 steel using design of experimentsconcepts”, Vol. 2, No. 3, July 2013 IJMERR.