IJIRT 144872
INTERNATIONAL JO URNAL OF INNOVATIVE RESEARCH IN TECHNOLOGY177
The Analogous Application of Game Theory and Monte
Carlo Simulation Techniques from World War II to
Business Decision Making
Dhriti Malviya
1, Disha Gupta
2, Hiya Banerjee
3, Dhairya Shah
4, Eashan Shetty
5 1, 2,3,4,5Narsee Monjee Institute of Management Studies, Mumbai, India
Abstract- The S econd World War, one of the most gruelling events in the history of mankind, also marks the emergence of one of modern-day’s most widely used scientific disciplines – Operations Research (OR). Rather than defining OR as a ‘part of mathematics’, a better characterization of the sequence of events would be that some mathematicians during World War II were coerced into mixed disciplinary units dominated by physicists and statisticians, and directed to participate in an assorted mix of activities which were clubbed together under the rubric of ‘Operations Research’. Some of these activities ranged from curating a solution for the neutron scattering problem in atomic bomb design to strategizing military attacks by means of choosing the best possible route to travel. Thus arose two major Operations Research techniques – Monte Carlo Simulation and Game Theory. More than 70 years later, managers face business problems that often seem as complicated as the design of an atomic bomb. Models of pricing buy-back and revenue-sharing negotiations, product decisions, principal -agent decisions, supply chain design, advertising decisions, options and futures trading or allocation of funds are usually too complex to solve in simple mathematical terms. In the first part of this paper, we discuss
in-depth, how mathematicians leveraged the two
aforementioned OR techniques during World War II. In the latter part of the paper, we map both these techniques to the current business scenario and suggest ways of using them to make better managerial decisions.
Index terms: Game Theory, Nash Equilibrium, Monte Carlo S imulation, Managerial Decision Making, S econd World War, Operations Research
I. INTRODUCTION
It is often seen that history is not clear cut. This is the classic example where different people have diverse views of the same event. Based on the history of OR, it is believed that Sir Charles Babbage (1791-1871) is the father of Operations Research, but the name
‗Operations Research‘ only came up in the year 1940. During World War II, a team of humans referred to as the Blackett‘s Circus in UK first applied scientific techniques to analyze military operations to win the war and thus developed the scientific discipline – Operations Research. Operations Research includes plenty of problem-solving techniques like mathematical models, statistics and algorithms to assist in decision-making. OR is used to analyze advanced real-world systems, typically with the target of improving or optimizing the tasks.
The aim during WWII was to get utmost economical usage of restricted military resources by the application of quantitative techniques. Ever since then, OR has developed into a theme oftentimes used in industries, economics and businesses together with petrochemicals, logistics, airlines, government, etc. The Second World War had sparked scientific advances in the study of communication, computation, & control which produced the technological grounds for automation.
IJIRT 144872
INTERNATIONAL JO URNAL OF INNOVATIVE RESEARCH IN TECHNOLOGY178
programming and regression analysis, to helporganizations make the most of their data. Through detailed analysis of the data, operations research analysts can help uncover options that lead to higher profits, more-efficient operations and less risk. Business managers who find that projects always seem to run late, cost overruns are all too common, and actual results are not even close to projections may sometimes feel the need to use methods akin to those used in the design of the atomic bomb. So they created a wholly new approach -- plugging in indiscriminately chosen numbers into the equations and scheming the results. This new approach came to be known as the ‗Monte Carlo Simulation‘ approach. Though the scientists during W WII solely checked thousands and trillions of combos of numbers, by sampling random numbers to hide the various dimensions of the matter, and analyzing the results with statistics, they were ready to create excellent predictions -- and in fact guide the design of an atomic bomb that ultimately ended WWII. Similarly, the ‗Theory of Games‘ also known as ‗Game Theory‘ originated to solve problems like finding the best route for military attacks and making strategic military decisions. Today, the application of Game Theory has scaled from just military decisions to crucial managerial decisions in the competitive corporate world.
Research Objectives:
1. To discuss the following applications of Game Theory and Monte Carlo Simulation:
(i) Historical applications (World War II) (ii) Current applications (in the business
scenario)
2. Under Game Theory, to enunciate the uses of the following types of strategies in various business applications and managerial decision making: (i) Zero-sum Games
(ii) Dominance Strategy and Pay-off Matrices
(iii) Nash Equilibrium and Prisoner‘s Dilemma
3. To similarly enunciate the uses of Monte Carlo Simulation in various business applications and managerial decision making particularly in making complex product decisions.
Methodology:
We carried out our analysis in two stages:
Stage 1: Analysing the use of Monte Carlo Simulation and Game Theory in World War II Stage 2: Mapping both the techniques and their uses to the modern world and managerial decision making.
Methods used: I. Game Theory
(i) Zero-sum Games:
In Zero-sum games, most instances involve repetitive solution. The winner receives the entire amount of payoff which is contributed by the loser. Therefore, two-person zero-sum games are simply those games which involves only two players where one person‘s gain is exactly balanced by the other person‘s loss. Thus, we obtain a sum of zero when adding up the total gains and subtracting the total loss.
We analyze a two-person zero-sum game with a simple mathematical description of a game, the strategic form.
The strategic form of a two-person zero-sum game is given by a triplet (X, Y, A), where
X being a nonempty set, the set of strategies of Player I
Y being a nonempty set, the set of strategies of Player II
A being a real-valued function defined on X × Y (Thus, A(x, y) is a real number for every x ∈ X and every y ∈ Y.)
Meaning, suppose Player I chose x ∈ X and Player II chose y ∈ Y concurrently, and each player oblivious of the choice of the other.
The amount Player I could win from Player II will belong to the set A(x, y). If A < 0, Player I will lose this amount. Therefore, A(x, y) indicates the winnings of Player I and the losses of Player II. The maximin value of a player is the largest value that the player can be sure to get without knowing the actions of the other players. The minimax value of a player is the smallest value that the other players can force the player to receive, without knowing his actions. Encounters where we obtain the same maximin and minimax values, the outcome is called an equilibrium outcome and we obtain a saddle point. Thus, when the maximin and minimax are said to be in equilibrium, the outcome associated with them is called a saddle point.
(ii) Nash Equilibrium
IJIRT 144872
INTERNATIONAL JO URNAL OF INNOVATIVE RESEARCH IN TECHNOLOGY179
where no player has an incentive to deviate from hischosen strategy after considering an opponent's choice.
(iii) Dominance Strategy & Pay-off Matrix In game theory, strategic dominance (commonly called simply dominance) occurs when one strategy is better than another strategy for one player, no matter how that player's opponents may play. A strategy is said to be weakly dominated if there exists some other strategy for a player which is possibly better and never worse, yielding a higher payoff in some strategy profile and never yielding a lower payoff.
An iterated-dominance equilibrium is a strategy profile found by deleting a weakly dominated strategy from the strategy set of one of the players, recalculating to find which remaining strategies are weakly dominated, deleting one of them, and continuing the process until only one strategy remains for each player.
A payoff matrix is defined as a visual representation of all the possible outcomes that can occur when two people or groups have to make a strategic decision. The decision is referred to as a strategic decision because each decision maker has to take into consideration how their choice will affect their opponent's choice and how their opponent's choice will affect their own choice. The payoff matrix illustrates each possible strategy that one side can choose, as well as every combination of outcomes that are possible based on each opponent's choice.
II. MONTE-CARLO SIMULATION
Monte Carlo simulation is a mathematical technique that helps to assess risk in decision making and in financial analysis. The technique is widely used by professionals in fields such as finance, project management, manufacturing, engineering, research and development, insurance and many more.
Phases of the simulation process:
1. Definition of the problem and statement of objectives
2. Construction of an appropriate model 3. Experimentation with the model constructed 4. Evaluation of the results of simulation Analysis:
STAGE 1: Analysing the OR techniques used at different instances during the Second World War
I. Game Theory
(Strategies curated and applied during WWII particularly in the Battle of the Bismarck Sea) The Battle of the Bismarck Sea took place in the South West Pacific Area during World War II in 1943 when aircraft of the U.S. Fifth Air Force and the Royal Australian Air Force attacked a Japanese convoy carrying troops to New Guinea. This part of the paper talks about the fundamental concepts of Game Theory like the two-person zero-sum game and some Nash Equilibrium dominance ideas as well as the strategies applied to the Battle of the Bismarck Sea based on the actual military operation.
The Japanese Admiral, Imamura, who was the commander of the Japanese Navy ordered for reinforcements to be delivered to Japanese soldiers fighting in Papua New Guinea. The struggle for Papua New Guinea had reached a critical stage as only two routes were available for the Japanese to choose between —either the Northern route, through the Bismarck Sea, or the Southern route, through the Solomon sea.
Figure 1: Red area represents Japanese control and blue area represents U.S. control.
IJIRT 144872
INTERNATIONAL JO URNAL OF INNOVATIVE RESEARCH IN TECHNOLOGY180
Analysis of the Battle of the Bismarck SeaThe United States military doctrine of decision states that decisions are made by the military commander either based on enemy capabilities or on enemy intentions. In the Battle of the Bismarck Sea, General Kenney‘s decision was made based on the enemy capabilities, that is, everything the Japanese Admiral could do to oppose him. General Kenney employed the use of a five-step process called Estimate of the Situation to make his decision.
Step 1. The mission
As per the orders given by the Supreme Commander General MacArthur, the mission required General Kenney to cut off and expose maximum annihilation on the Japanese reinforcements convoy
Step 2. Situation and Courses of Action
The general situation was of common knowledge to both the admirals. However, there was a determining factor pointed out by General Kenney‘s staff. The bad weather was predicted to appear in the north, accompanied by the poor visibility which would directly limit the number of bombing days for the U.S. to only two days. On the other hand, the south would enjoy the perks of the good weather and visibility which would grant them with greater payoffs, that is, more number of days for bombing. For Japanese troop, it would take three days to get to the final destination no matter which route its commander choose.
Step 3. Analysis of the Opposing Courses of Action Since each commander had two alternatives to choose from, there were a total of four possible clashes that could potentially arise.
Scenario 1.
•General Kenney was to concentrate mos t of his aircraft along the Northern route
•the Japanese Navy were considered to take the Northern route
•a total of two days of bombing due to the poor visibility
Scenario 2.
•General Kenney was to concentrate most of his aircraft along the Northern route
•the Japanese Navy were considered to take the Southern route
•Since the reconnaissance was limited along the Southern route, the Japanese convoy could be missing 4 during the first day, allowing only two days of bombing
Scenario 3.
•U.S. Air Force was to be located along the Southern route
•Japanese Navy were to take the Northern route •Due to the poor visibility and the low-level of reconnaissance, the Japanese would be missed for two days, allowing for only one day of bombing
Scenario 4
•U.S. Air Force were to take the Southern route •Japanese Navy were to take the Southern route •Due to the good visibility, General Kenney could have three days of bombing
IJIRT 144872
INTERNATIONAL JO URNAL OF INNOVATIVE RESEARCH IN TECHNOLOGY181
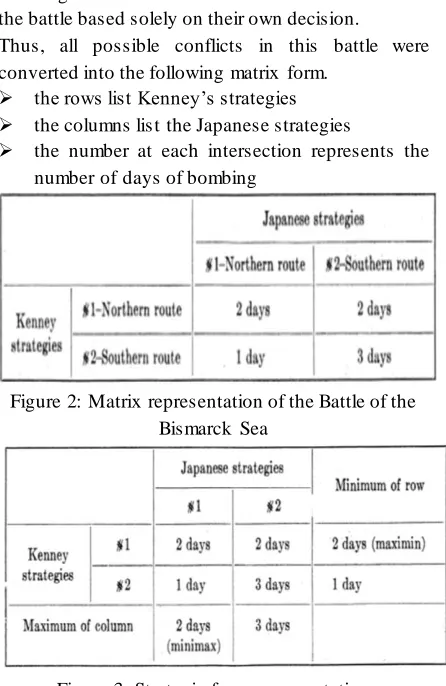
that provided him with the maximum time ofbombing. But neither could determine the outcome of the battle based solely on their own decision. Thus, all possible conflicts in this battle were converted into the following matrix form.
the rows list Kenney‘s strategies the columns list the Japanese strategies
the number at each intersection represents the number of days of bombing
Figure 2: Matrix representation of the Battle of the Bismarck Sea
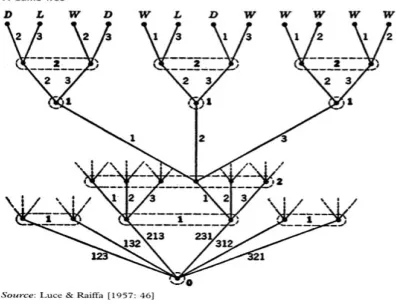
Figure 3: Strategic form representation
In order to acquire as many days of bombing possible, General Kenny ensured his outcome to be greater than or equal to the minimum number in any row. To represent this, we put the minimum values of each row into that extra column. It is clear from the matrix that if Kenney stayed with the Northern route, he guaranteed two days of bombing. If Kenney stayed with the Southern route, a situation may present itself where he would be allowed one day of bombing. Based on the doctrine that a commander makes his decision on the estimation of the enemy‘s capability, Kenney would definitely select to search the Northern route, as it gave the greatest promise of success. This suggests that Kenney would select the maximum value within the column of minimums, that is, the maximin value -2.
As for the Japanese Admiral, we put the maximum values of each column in that extra row, as he would want to minimize his exposure to bombing, so he would take into account the worst situation that
would occur by checking numbers in each column. We understand from the matrix that if Admiral stayed with the Northern route, he would have a max of two days of bombing and if he stayed with the Southern route, he might be exposed to a three-day bombing. Therefore, the Admiral would select the minimum value within the row of maximums, that is, the minimax value -2.
Step 5. The Decision
Based on our analysis from the perspective of game theory, both General Kenney and Japanese Admiral would choose the Northern route. It was not surprising that the actual outcome was identical to the one we predicted here. In the Battle of the Bismarck Sea, General Kenney finally decided to put his reconnaissance along the Northern route. The identical results were not a coincidence. We saw earlier that when both players yield the s ame outcome, the outcome is called saddle point. There are two reasons which support why players in a zero -sum game should choose a strategy associated with a saddle point-
i. a player‘s security level is maximized by choosing the saddle point
ii. a player will keep the other player from maximizing his security level by choosing the saddle point
IJIRT 144872
INTERNATIONAL JO URNAL OF INNOVATIVE RESEARCH IN TECHNOLOGY182
not smaller than his payoff of going south. However,there was no weakly dominated strategy for Kenney. We now go further to the discussion of the idea of the iterated-dominance equilibrium.
When applied to the Battle of the Bismarck Sea, the iterated-dominance equilibrium implies that Kenney believes that Admiral will choose the North route since it is weakly dominant. After taking one scenario out of consideration, Kenney has a strongly dominant strategy: to go north so that he would achieve payoffs strictly greater than results if he would go south. Therefore, the strategy (North, North) was an iterated-dominance equilibrium, which was the actual outcome of the Battle
II. Monte Carlo Simulation
(Technique curated and used for World War II‘s neutron- scattering problem in atomic-bomb design) The Monte Carlo Simulation was first conceived during the World War II by scientists John Von Neumann and Stanislaw Ulam. These two scientists were working intensively on the Manhattan project and they were given the task of modelling what would happen in a chain reaction in a highly enriched uranium. For this, they couldn‘t afford to have actual results deviate greatly from the projections carried out by them. The scientists had to resort to numerical methods since the ―neutron diffusion‖ model was too complex to describe and solve with algebraic equations. This consisted of plugging in different numbers into equations and then calculating their results. Thus, arose a simulation technique known as the Monte Carlo Simulation technique.
It all started when numerous technicians and scientists were working on the first electronic general purpose computer named the ENIAC - Electronic Numerical Integrator and Computer. It was originally designed to calculate artillery firing tables for the United States Army. But John thought that the computer could do more than mere computation of firing tables. Even though the model created by John for the computer was relatively simple, the simplifications were taken into account and the extrapolated results were cause for guarded optimism about the feasibility of a thermonuclear weapon. The Monte Carlo Simulation is best explained by the example discussed by John in his letter to Robert Richtmyer which included a detailed outline of a possible statistical approach to solving the problem of neutron diffusion in fission able material.
―Consider a spherical core of fissionable material surrounded by a shell of tamper material. Assume some initial distribution of neutrons in space and in velocity but ignore radiative and hydrodynamic effects. The idea is to now follow the development of a large number of individual neutron chains as a consequence of scattering, absorption, fission, and escape.
At each stage a sequence of decisions has to be made based on statistical probabilities appropriate to the physical and geometric factors. The first two decisions occur at time t = 0, when a neutron is selected to have a certain velocity.. When the neutron crosses a material boundary, the parameters and characteristics of the new medium are taken into ac- count. Thus, a genealogical history of an individual neutron is developed. The process is repeated for other neutrons until a statistically valid picture is generated.‖
Process of making the various decisions: To start with, the computer must have a source of uniformly distributed psuedo-random numbers. A much used algorithm for generating such numbers is the so -called von Neumann "middle-square digits." Here, an arbitrary n-digit integer is squared, creating a 2n-digit product. A new integer is formed by extracting the middle n-digits from the product. This process is iterated over and over, forming a chain of integers whose properties have been extensively studied. Clearly, this chain of numbers repeats after some point. H. Lehrner has suggested a scheme based on the Kronecker-Weyl theorem that generates all possible numbers of n digits before it repeats.
IJIRT 144872
INTERNATIONAL JO URNAL OF INNOVATIVE RESEARCH IN TECHNOLOGY183
Once one has an algorithm for generating a uniformlydistributed set of random numbers, these numbers must be trans - formed into the non uniform distribution g desired for the property of interest. It can be shown that the function f needed to achieve this transformation is just the inverse of the non uniform distribution function, that is, f = g l. For example, neutron physics shows us that the distribution of free paths - that is, how far neutrons of a given energy in a given material go before colliding with a nucleus - ‗decrease exponentially in the interval (0, ∞). If x is uniformly distributed in the open interval (0,1)' then f = - 1nx will give us a non uniform distribution g with just those properties. The Monte Carlo method is beneficial as compared to the differential equations method. For example, a neutron- velocity spectrum with various peaks and valleys is difficult to handle mathematically. For Monte Carlo one needs only to mirror the velocity spectrum in the probability distribution. Also, the Monte Carlo method is sufficiently flexible to account for hydrodynamic effects in a self- consistent way. In an even more elaborate code, radiation effects can be dealt with by following the photons and their interactions.
STAGE 2: Mapping both the techniques to the current business scenario and its application in managerial decision making:
I. Game Theory
Game Theory is a tool that helps to predict outcomes of a group of inter-related firms where action of a single firm directly affects the pricing of the other participating players/firms.
It is ideal for situations where competitive or individual behaviors can be modeled. These situations may include:
1. Auctions.
2. Bargaining activities. e.g., union vs management, pricing buy-back and revenue-sharing negotiations
3. Product decisions. e.g., entry or exit markets 4. Principal-agent decisions. e.g., negotiations,
supplier incentives
5. Supply chain design. e.g., capacity management, build vs out source decisions
Proper usage of the concept can help in reducing risk, yield valuable competitive insights, improve internal alignment around decisions and maximize strategic utility.
Use of different game theory strategies in different business applications:
1. Options and Futures Trading using Zero- Sum Games:
Zero-sum games work on a basic property that is the sum of payoffs to all the players will be equal to zero. Under such games one player will have a positive payoff while other will have a negative payoff. Poker and chess are the classic examples of these type of games. However, real world games are rarely zero-sum games.
Options and futures trading is one of the most prominent examples of a zero-sum game scenario. Example: Let's say a company say indigo is trading at Rs. 1000 per share. Now there is an Investor A who purchases a call option on Indigo from Investor B. A few weeks later, the share is trading at Rs . 1100 a share. The call option gives Investor A the right to purchase shares of Indigo at Rs . 1000 per share from Investor B. In such a scenario, the buyer could use the option to purchase those shares at Rs . 1000, then immediately sell those same shares in the open market for Rs. 1100. Investor A wins, because he gets to buy something for Rs . 1000 and immediately resell it for Rs. 1100. Investor B loses by the same amount, because he has something worth Rs . 1100 but has to sell it for Rs . 1000. The difference of Rs . 100 that Investor A gains is Rs. 100 that Investor B loses.
There are still few firms that approach business as a win-lose situation. A classic example is coke-Pepsi where gain of one affects the payoff of the other directly
2. Advertising Decisions using Dominance Strategy:
Example: Two companies (A and B) share a market, in which they currently make Rs 5,00,000 each. Both need to determine whether they should advertise or not. For each company advertising costs come out to be Rs 2,00,000 and captures Rs 3,00,000 from the competitor provided the competitor doesn‘t advertise. What should the companies do?
IJIRT 144872
INTERNATIONAL JO URNAL OF INNOVATIVE RESEARCH IN TECHNOLOGY184
columns correspond to the options of player B. Theentries are payoff for A and payoff for B provided the corresponding options are chosen.
B advertises B doesn‘t advertise
A advertises 3,3 6,2
A doesn‘t advertise
2,6 5,5
Table 1: Pay-off matrix for advertising decision making
Now the question arises what is the best starategy for each firm? To begin with firm A, based on the matrix it should advertise as in such a case it is either at par with B (when A advertises it earns Rs 3,00,000 and even B earns 3,00,000) or doing much better than B when B doesn‘t advertise (A earns Rs 6,00,000 while B earns 3,00,000). Similarly, if B advertises it is either at par or much higher than A‘s (in case A doesn‘t advertise). Also, both the firms are equally better off in case neither of them advertises. Therefore, the outcome is that both the firms are either better off when one of them doesn‘t advertise or are doing equally well when none of them advertises or both of them advertises.
3.Pricing Structure in Duopoly/Oligopoly Using Nash Equilibrium and Prisoner‘s Dilemma:
The Nash equilibrium refers to a stable state in a game where no player can gain by unilaterally changing his strategy, assuming the other participants also do not change their strategies. It represents a non-cooperative game. It is very common in case of an oligopolistic market.
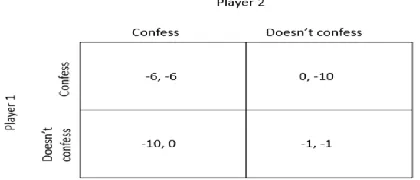
One example of Nash equilibrium is the very famous prisoner‘s dilemma. In prisoner‘s dilemma we have a situation with two suspects in separate rooms who are being interrogated at the same time. However, there are few conditions put forward: 1. The suspect is set free if he confesses the crime and gives up on the other suspect while the other suspect gets punished severely and 2. They receive a longer sentence if both confess their crime than if neither of them confesses. What we can see here is that it is in the best interest of A to confess even if B confesses ( -6 is better than 10) and even if B doesn‘t confess (0 is better than -1). Also, case of B is similar to case of A as if B confesses then it is better than either of the case. Therefore, in the given situation we expect both
player 1 and player 2 to confess as both will try to maximize their benefit.
Table 2: The Prisoner‘s Dilemma matrix.
Similarly, in the business world as well, two firms can either decide a price mutually or introduce their own lower pricing structure. In such cases it is observed that both the companies will introduce their own lower pricing structure despite the negativ e impact caused on the revenues of both the companies. Overview of Applications of Game Theory in Business:
1.Game Theory explains why in duopoly prices should be rigid. If prices are not rigid then tactic agreements between the competitors will be difficult to enforce.
2.Prisoner‘s Dilemma highlights the need for cooperation, mutual rules and decision making. 3.The task of each player is specified in the strategy in game theory. For example the task of the marketing manager is to design a advertising campaign and further actions to have a competitive edge in the market. Here, the player could be an individual or the firm itself.
4.A proper knowledge of the payoff matrix helps in making almost accurate predictions about all the factors that might affect the outcome of the alternative choices available.
5.Game theory helps in solving labour issues by adopting the most profitable strategy to tackle problems like strikes for higher wages, it helps in business as the manager can then guess and adopt effective strategy to compete and do better and lastly it helps management in estimating profits and taking decisions that can be balanced against the costs. 6. Economic problems like risks and technicalities can be better handled with the mathematical application of games.
II. Monte Carlo Simulation
IJIRT 144872
INTERNATIONAL JO URNAL OF INNOVATIVE RESEARCH IN TECHNOLOGY185
parameters to discover opportunities forimprovement. Simulations give a view of what might happen if certain action is taken and these results can be helpful in managing risk and in making better choices.
Monte Carlo simulation plays a vital role in commercial applications which includes marketing and customer relationship management. It can be applied in diverse areas such as market sizing, customer lifetime value measurement and customer service management.
Monte Carlo simulation provides a range of possibilities and probabilities that might occur for a particular action. It shows all possible outcomes example outcome of choosing an aggressive portfolio over a conservative portfolio or over a moderate portfolio.
For example – there is a change in the old system that interacts with a lot of users and is replacing the old system. Monte Carlo simulation can be helpful in the following ways:
1.A sample study to estimate cost, time and other expenses associated with migration of users to a new business system which will help in identifying problem areas and also if any additional resources are required.
2.The previous testing data can be helpful in estimating the maximum and minimum amount of time required.
3.The simulation can be fairly accurate in providing the likely result of the whole project, timing and costs based on historical data and sample study of the company.
Simulation is a very potent, flexible and therefore a commonly employed quantitative tool for solving decision making problems.
Overview of Applications of Monte Carlo in Business:
1.Training – a training simulation helps in experiencing complex situations while trying out new techniques with a realistic picture of events. For example: to upgrade to new software‘s the employees have to first learn and practice before they can actually start working on it.
2.Improvement of Processes – simulations are very helpful in analysing business practices to monitor and improve them. Simulations are helpful as specific details can be worked out and pointed out which can be later worked upon using a different technique in
such a way that small changes create a bigger impact. Also, by laying down the interdependencies and interactions involved, a lot of problems become visible which otherwise go unnoticed.
3.Predicting Results - accurate forecasts about certain conditions and situations can be stimulated using spreadsheets. For example, the trend function can be used to predict the future direction of sales based on the historical sales data.
4.Risk Management – defines the risk the investor is exposed to that is how much he can invest or how much is he in position to lose under certain stimulated circumstances. Monte Carlo simulations are specifically in assessing risk. Using spreadsheets, cash flows, returns and risk of new product introductions can be estimated.
5.Police dispatching and beat design.
6.Location of emergency vehicles like ambulances. 7.Making inventory policy decisions.
8.Evaluation of operating alternatives at airports. 9.In financial planning in both portfolio selection and capital budgeting.
10.Scheduling the production processes. Phases of the Simulation Process:
1.Definition of the problem and statement of objectives: There are two preliminary tasks that have to be performed which are collection of data and selection of means by which simulation activity will replicate the random behaviour of the real world. To identify and clearly define the problem and list of objectives the solution is intended to achieve. A clear statement facilitates development of an appropriate model and provides basis for evaluation of the simulation results. The scope and level of detail in simulation is important as it influences the chances that the simulation model will accomplish the objective.
2.Construction of an appropriate model: A simulation model may be physical or mathematical model, a mental conception, or a combination. Examp le of a physical model- a scale down model of an aeroplane or ship constructed out of wood or other material. Since physical models are expensive to build, mathematical models are preferred. Such models involve mathematical symbols or equations used to represent relationship in the system.
IJIRT 144872
INTERNATIONAL JO URNAL OF INNOVATIVE RESEARCH IN TECHNOLOGY186
However, if the model is stochastic in nature, withthe parameters subject to random variation, then a number of runs would be needed to get a clear picture of the model performance. Greater the variability inherent in the simulation, larger would be the simulation runs needed to obtain a reasonable degree of confidence that the results are truly indicative of system behaviour.
4. Evaluation of the results of simulation: The steps involves interpretation and analysis of the results of the runs. The interpretation of results depends upon the extent to which simulation model portrays the reality. Closer the approximation of the real system by the simulation model, lesser will be the need for adjusting the results and also lesser will be the risk inherent in applying the results.
Application in making crucial product decisions: Explained via an illustration:
The tit-fit scientific laboratory is engaged in producing different types of high class equipment for use in science laboratories. The company has two different assembly lines to produce the most popular product pressure. The processing time for each of the assembly lines is regarded as a random variable and is described by following distribution:
Process time (minutes)
Assembly A1 Assembly A2
10 .10 .20
11 .15 .40
12 .40 .20
13 .25 .15
14 .10 .05
Table 3
Using the following random numbers, generate data on the process time for 15 units of the item and compute the expected process time for the product.
4134 8343 3602 7505 7428
7476 1183 9445 0089 3424
4943 1915 5415 0880 9309
In stage 1, we assign random number intervals to the processing time on each of the assemblies.
Table 4: Random interval table.
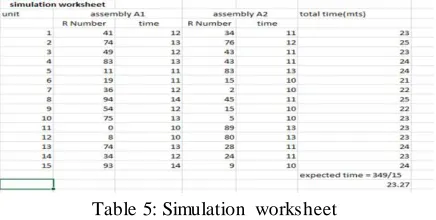
The simulation worksheet given below shows the simulated data on the process times. Thus, the random numbers for the first unit are 41 and 34, respectively, for the assemblies A1 and A2. From the above table we observe that the times corresponding to these are 12 d 11 minutes respectively. Thus, the total time required for the unit is 23 minutes. In the same way the time for other 14 units are determined and shown in the last column. The expected completion time for a unit works out to be 23.27 minutes.
Table 5: Simulation worksheet Conclusions and Recommendations:
As is evident from the analysis in this paper, Operations Research techniques particularly Monte Carlo Simulation and Game Theory can be leveraged by modern-day businesses and incorporated in almost all their day to day activities.
Businesses are recommended to:
-Discourage use of simple mathematical equations and resort to use of Monte Carlo Simulation and other simulation techniques for prediction specifically Finance firms involving risk management and qualitative analysis.
-To surge competitive advantage, firms should actively use Nash Equilibrium and other popular Game Theory strategies to make wise advertising decisions.
-Modernisation of Monte Carlo Simulation: In the current age, with the advent of Big Data, Data Mining and Data Analytics, there is an abundance of available data figures which businesses can input in the simulation technique instead of using randomly chosen variables. Using this accurate data would lead to more accurate predictions.
CITATIONS, BIBLIOGRAPHY AND WEBLIOGRAPHY
[1] (British operational research in World War II ,
IJIRT 144872
INTERNATIONAL JO URNAL OF INNOVATIVE RESEARCH IN TECHNOLOGY187
http://pubsonline.informs.org/doi/pdf/10.1287/opre.35.3.453 .
[2] Operations Res earch during World War II ,
Frederic H. Murphy ,
http://www.esi2.us.es/~mbilbao/econor.htm [3] The Beginning of Monte Carlo Method Research
Paper, N. Metropolis, http://library.lanl.gov/cgi-bin/getfile?00326866.pdf
[4] Monte Carlo Simulation , AIP Conf Proc. 2010
Jan 5,
https://www.ncbi.nlm.nih.gov/pmc/articles/PMC 2924739/ AIP Conf Proc. 2010 Jan 5
[5] O.G. Haywood Jr., Military Decision and Game Theory, November 1954, Journal of the Operation Research Society of America
[6] Oliver G. Haywood Jr, Military Doctrine of Decision and Von Neuman Theory of Games, 20 March 1950, for The Air War College, Maxwell Air Force Base
[7] Thomas S. Ferguson, Game Theory ,Tom
Scheve, HowGame Theory Works,
howstuffworks.com
[8] https://www.academia.edu/1040767/Markov_cha in_Monte_Carlo_in_practice. (Markov Chain Monte Carlo in Practice, Uploaded by Olexander Syniavsky)
[9] https://www.academia.edu/2720321/Minimum_
Square_Error_Single-Channel_Signal_Estimation (Minimum Mean-Square Error Single-Channel Signal Estimation, Ole Winther)
[10]https://biblio.ugent.be/publication/678298/file/68 19122.pdf
[11]MATHEMATICS THROUGH
MAN-COMPUTER INTERACTION. A STUDY OF THE EARLY YEARS OF COMPUTING, by Lisbeth De Mol1
[12]http://www.globalspec.com/reference/50676/203 279/chapter-4-monte-carlo-simulation-methods-for-nanosystems (Chapter 4: Monte Carlo Simulation Methods for Nanosystems, By G. Ali Mansoori)
[13] http://docplayer.net/49377632-Historical-uses- of-game-theory-in-battles-during-the-world-war-ii.html
[14](Historical Uses of Game Theory in Battles during the World War II, Nanjiang Liu, December 11, 2015)
[15]http://business.financialpost.com/executive/using -game-theory-to-improve-strategic-decision-making (Mitchell Osak ,24 July 2010, Using Game Theory to Improve Strategic Decision Making)
[16]https://www.maa.org/sites/default/files/pdf/eboo ks/GTE_sample.pdf (Erich prisoner, 2014, game theory through examples)
[17]http://www.investopedia.com/ask/answers/06051 5/how-game-theory-related-nash-equilibrium.asp (Investopedia, June 25,2015, how is game theory related to the Nash equilibrium?)
[18]zaverecna_prace.pdf (Barbora Varkovo, may 2010, Game theory approach to managerial decision making: a building construction industry case )
[19]https://www.captechconsulting.com/blogs/monte -carlo-simulation-and-its-use-in-everyday-business ( Craig Paxton, 6th September 2013, Monte Carlo simulation and its use in everyday business)
[20] http://smallbusiness.chron.com/application-simulation-business-73684.html (Tara Duggan, Application of Simulation in Business)
[21]http://www.palisade.com/risk/monte_carlo_simu lation.asp
[22]http://blog.minitab.com/blog/adventures -in-
statistics-2/understanding-monte-carlo-simulation-with-an-example (Jim Frost, 25 April 2017)
[23]http://www.yourarticlelibrary.com/economics/ga me-theory-in-economics-importance-limitation-and-other-details/28930/ (Smriti Chand, Game Theory in Economics: Importance, Limitation and Other Details)
[24]http://www.referenceforbusiness.com/manageme nt/Tr-Z/Zero-Sum-Game.html (Kevin Nelson, zero sum game)
[25]From Cardinals to Chaos: Reflection on the Life and Legacy of Stanislaw Ulam, Edited by N. G. Cooper, Roger Eckhardt, Nancy Shera