Abstract—Since the tropical zone is hotter and humid
weather, maintaining the green area and microclimate strategies of surrounding urban areas can improve not only outdoor thermal comfort but also indoor as well. This paper discusses about the tree pattern and tree species of colonial grid pattern city in tropical zone which is aging, but still use as central business district, considering urban morphology with respect to shading since the shading has supreme influence on thermal comfort. The purpose of this research is to investigate the shading condition of existing city pattern. The investigation was carried out using Geographic information system(GIS), 3D modelling program, and statistical analysis. The result of this study will propose tree planning system of old Grid Pattern city to maintain old urban city not to vanish the historical facts and original image and to contribute it to other similar area.
Index Terms—Tree pattern, tree species, tropical zone, urban
shading.
I. INTRODUCTION
A. Background
In recent decades, since 1880, the rate of temperature is increasing year by year around the world because of global warming[1]. Millions of people who live in cities must suffer increased temperature more than the rural and undeveloped surrounding. Hence, many urban planning researchers have been focusing on the climatology as the climate change has large effects on health and well-being of humans, animals and plants in the city [2] and urban heat island effect(UHI) on the city as UHI is the most obvious atmospheric modification attributable to urbanization [3]. They find out urban elements which can reduce the rate of city temperature to make the city comfortable.
Among urban elements, trees and vegetation is also one of the significant factors to help cool the environment and to reduce urban heat islands through shading and evapotranspiration [4], [5]. Moreover, Urban trees are an increasingly important quality of life issue in tropical cities as
Manuscript received December 5, 2017; revised May 1, 2018.
Khaing Myint Mo with Faculty of Civil engineering and Architecture of graduate school of Science and Engineering at Saga University, 1, Honjo-machi, Saga, 840-8502, Japan (e-mail: [email protected], [email protected]).
MISHIMA Nobuo was with University of Tokyo, Tokyo, Japan in 1988, 1990 and 1985 respectively. He also studied at Faculty of architecture and urban planning Tech. Univ. of Vienna, Austria, as a scholarship student of Austrian government with Joint Study Program between two institutions, from October of 1990 to March of 1993. He is now with the faculty of Civil engineering and Architecture of graduate school of Science and Engineering at Saga University, 1, Honjo-machi, Saga, 840-8502, Japan [email protected]).
economic growth swells increasingly affluent urban populations [6], [7]. Trees are one of the most cost-effective means to reduce urban heat island effects and transform our urban environments to create prosperous, livable cities [8], [9]. In this case, city planning pattern, street orientation, tree pattern and tree species do play in important role to have the outdoor thermal comfort [10].
B. Research Significance and Aim
In this study, tree planning system and different types of tree species of colonial grid pattern city in tropical zone will be disclosed considering city pattern, street orientation and sun path of the city which are urban morphology [11] since the grid pattern is one of the remarkable city forms which dates from antiquity and initiated in multiple culture [12] and tropical ecosystems appear to be more sensitive to climate change and less able to store carbon [13]. This study aims to provide appropriate design recommendation for grid pattern city in tropical zone and we hope supportive data from this study can be able to use for evaluation of the ancient colonial grid pattern city partially by considering the tree shading and tree species with respect to shading.
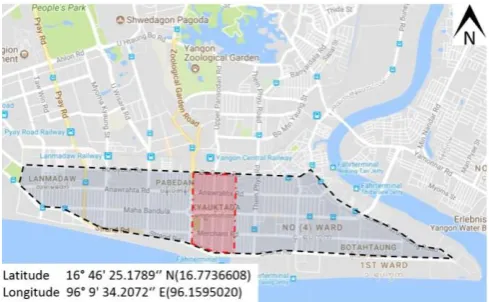
Fig. 1. Central business district area, Yangon, Myanmar.
II. METHODOLOGY
A. Site Study
The study area is in the former capital city of Myanmar, Yangon until Myanmar government built new capital city, Nay Pyi Taw, in 2007. In this research, Yangon central business district (CBD) which is shown in fig.1 is selected to investigate the shading since it is aging city and still using as CBD area. Yangon Central Business District (CBD) is one of the grid pattern cities, especially planned and constructed by British planner as a colonial city located in tropical zone. There are seven townships in CBD area and Kyauktada
A Study of Tree Pattern and Tree species of Colonial Grid
Pattern City in Tropical Zone Considering Urban
Morphology Using Statistical Analysis
township is selected because it is the center of downtown Yangon, Myanmar and dotted with many colonial era buildings, including 39 landmark buildings and structures protected by the city [14], [15]. Because of the tropical zone, the area should have proper shading especially on the street platform where many pedestrians and vendors are always using as it is the CBD area of Yangon City.
B. Method of Study
To investigate the tree planning system and tree species of the grid pattern city in tropical zone with respect to shading, firstly, the study area is surveyed to collect the information for the existing conditions of the study area. And then, data for type of trees, trees’ height, vendors and bus stands which are continuously using many people who are working and going around CBD for their business will be collected. Type of tree will be categorized according to the tree species. After that, all the collected data will be input as GIS (Geographic Information System) data to clarify the study area and to use those databases easily for analyzing.
Here, QGIS software for analysis is used. Quantum GIS is an open source Geographic Information System that supports most geospatial vector and raster file types and database formats. The program offers standard GIS functionality, including a large variety of mapping features, data editing, on-the-fly projection and GRASS digitizing [16]. In this study, we used overlay method and buffer method to analyze the tree pattern and planning system. Different type of tree species shading area are created by three-dimensional program and compare each types of tree species and tree pattern along South to North direction and East to West by using statistical analysis. Finally, we can know how the colonial grid pattern city is planning the trees and tree species of the area. We hope, this study will provide the supportive data for evaluation of colonial grid pattern city for further study.
III. ANALYSIS
A. Site Analysis 1) City pattern
The study area, Kyauktada Township, is located in the middle among seven Townships. North side is connected to Mingalar Taung Nyunt Township and in the South Side is Yangon River. Another side of Yangon River is Dhala Township and, so they might plan the way to connect the CBD and Dhala Township directly when they planned the grid pattern city.
2) Tree pattern
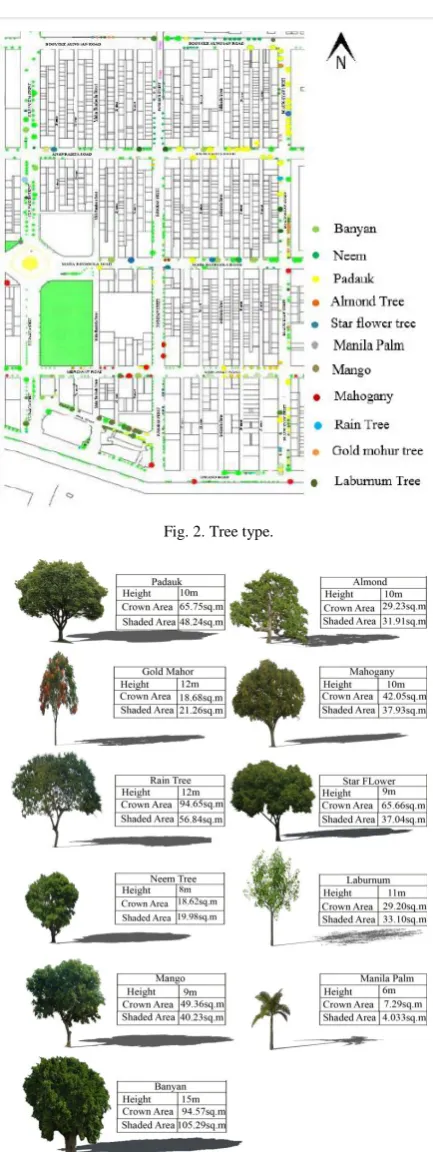
According to the GIS data, as shown in Fig. 2, we can determine the tree planning system of colonial grid pattern. Trees are planting mainly in the main road and streets and not in the narrow street. The reason is that narrow streets can get proper shading from building. The wider the road, the more sunshine will receive. Trees planning system in Colonial Grid Pattern City of Yangon CBD area is quite interesting. Concerning with the sun direction, different kind of trees are used and type of tree of South to North direction and East to West direction are almost separated. Therefore, we will analyze more detail of tree species depending on the street direction and prove it.
Fig. 2. Tree type.
Fig. 3. Characteristics of tree species model.
3) Tree species analysis
To evaluate the shading magnitude of the colonial grid pattern city and to examine which types of tree species can give more shading, tree height above one meter is selected, and eleven types of tree species can be found in the area. Tree height and crown size are estimated measured data in site by the author during March and April 2016.
open at that time [17]. Therefore, many pedestrians will be there around that time. From that, we could know the characteristic of the tree species which exists in old grid pattern city, Yangon, Myanmar as shown in fig.3.
Fig. 4. Shading analysis of the tree.
4) Analysis of Tree shading
To explore the tree shading continuity, tree species data which are hierarchically categorized by their characteristics are initially changed to digital data by using QGIS. After that, we used buffers method with 1meter radius to show shading magnitude from different species of trees and to investigate the continuity of shading. The light-yellow color represents the shading of respective tree species by buffer method as shown in Fig. 4.
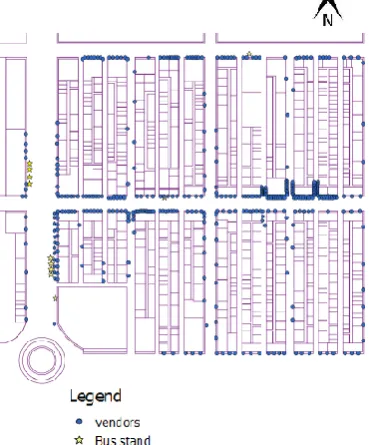
Fig. 5. Location of the vendors and bus stand in the area.
Also, the investigation of the shading with respect to tree pattern and species will be carried out comparing the overall shading magnitude of the area with the factor that are street vendors and bus stand as in Fig. 5. So, firstly, location of the vendors will be allocated in GIS and the bus stand will also be allocated as most of the vendors opened their shop near the bus stand and many people use the bus transportation.
Fig. 6. Overlay of trees, vendors and bus stand.
B. Result and Discussion
1) Tree shading analysis depending on species
From the result of the calculation, the shaded area of each tree species can be compared. The hierarchical order of the shaded area of different kind of tree species is shown in table I.
We can check from this table which species give more shading. We found that big tree which has a big crown area can give more shading. Banyan tree is the highest tree and crown area and its leaves are also big so that its shaded area is wider than other trees. But it should be noted that those kind of big trees takes lots of land area and it can obstruct the aesthetic of the building facet. After that, dependants of the shaded area of the tree in tropical zone are continued to investigate by using statistical analysis.
TABLEI: CALCULATION OF THE SHADED AREA BY USING MODEL
Tree Species Height(m)
Crown Area(sq.m)
Shaded Area(sq.m)
Manila Palm 6 7.27 4.033
Neem 8 18.62 19.983
Tree
Almond 10 29.23 31.912
Laburnum 11 29.20 33.106
Star Flower 9 65.66 37.049
Mahogany 10 42.05 37.939
Mango 9 49.36 40.239
Padauk 10 65.75 48.240
Rain Tree 12 94.65 56.840
Banyan Tree 15 94.57 105.297
TABLEII:TREE HEIGHT AND SHADED AREA MAGNITUDE
Regression Statistics
Multiple R 0.89
R Square 0.78
Adjusted R Square 0.78 Standard Error 0.76 Observations 496.00
Anova
df SS F Sign F
Regression 1.00 1032.95 1802.83 0.00 Residual 494.00 283.04
Total 495.00 1316.00
Coeffs
Standard
Error t Stat P-value Intercept 6.30 0.06 97.74 0.00
48.24 0.09 0.00 42.46 0.00
According to the R square result, we can say that the magnitude of the shaded area by tree species is depending on the tree height as percentage of R square value is high. Moreover, P value is lower than 0.05 and so we can strongly prove that hypothesis is correct. And so, while we consider the tree planning, we should also consider the tree height of the tree species.
TABLEIII:CROWN AREA AND SHADED AREA MAGNITUDE
Regression Statistics Multiple R 0.92 R Square 0.84 Adjusted R Square 0.84 Standard Error 8.33 Observations 496.00
Anova
df SS F Sign F
Regression 1 182407.74 2629.92 0.00 Residual 494 34263.17
Total 495 216670.91
Coeffs Standard
Error t Stat P-value Intercept -2.07 0.71 -2.92 0.00
48.24 1.18 0.02 51.28 0.00
The result shows that the magnitude of the shaded area is
also depending on the crown area of the tree species and here also, P-value is lower than the 0.05 and so our hypothesis is true.
From Table II and III, we can say that the higher the tree and the bigger the crown size, the trees will provide the better shading.
To prove the separation of tree species along to the direction of the street, the exploration will be continued by Anova single factor analysis.
TABLEIV:PERSPECTIVE STATISTIC OF DIFFERENT TREE SPECIES AND ITS
SHADING MAGNITUDE ALONG TO S-NDIRECTION
Groups Count Sum Average Variance
Padauk 10 482.4 48.24 0
Almond 2 63.824 31.91 0
Gold Mohur
Tree 4 85.04 21.26 0
Rain Tree 4 227.36 56.84 0 Star Flower 8 296.39 37.05 0 Neem 143 2857.56 19.98 4.58E-28 Laburnum 10 331.06 33.11 0 Mango 10 402.39 40.24 5.61E-29
Banyan 2 210.59 105.30 0
Manila Palm 26 104.85 4.03 0
TABLEV:ANALYSIS OF VARIOUS (ONE-WAY) OF TREE SPECIES AND ITS
SHADING MAGNITUDE ALONG N-SDIRECTION
Source of Variation F P-value F crit Between Groups 1.45E+31 0 1.924882
H0: All Trees species has same shading magnitude H1: At least two types are different
According to the result of the analysis of Various (one way) in table V and VII, F normal is greater than F critical and, also P-value is lower than 0.05. It means that Hypothesis H1 is
correct and the study area has the differences in receiving the shadow highly depending on the type of the different type of tree species.
By comparing table IV and VI, we can see that big shaded tree species are more along South to North direction rather than East to West direction. Along the South to North direction, small shaded trees such as neem trees, gold mohor, manila palm are planted as it is not so high and can get enough shading properly. Along East to West Direction, due to the sun path, the street platform need more shading for the users and so many type of big shaded trees such as Banyan, Padauk, Almond, etc are planted in that direction.
TABLEVI:PERSPECTIVE STATISTIC OF DIFFERENT TREE SPECIES AND ITS
SHADING MAGNITUDE ALONG E-WDIRECTION
Groups Count Sum Average Variance Padauk 27.00 1302.48 48.24 0.00 Almond 9.00 293.24 32.58 4.04 Gold Mohur
Tree 2.00 42.52 21.26 0.00
Mahogany 3.00 113.82 37.94 0.00 Star FLower 10.00 370.49 37.05 0.00 Neem 125.00 2497.88 19.98 0.00 Laburnum 12.00 397.27 33.11 0.00
Mango 2.00 80.48 40.24 0.00
Banyan 6.00 631.78 105.30 0.00
TABLEVII:ANALYSIS OF VARIOUS (ONE-WAY) OF TREE SPECIES AND ITS
SHADING MAGNITUDE ALONG E-WDIRECTION
Source of
Between
Groups 41012.9 6.4287E-299 1.99
H0: All Trees species has same shading magnitude H1: At least two types are different
2) Shading effected by trees
When we overlaid the shading of the trees, vendors and bus stand as shown in Fig. 6, we can see that most of vendors makes their shop under the tress and near to the bus stands where they can get well shading and many customers as the pedestrians and people who comes to the bus stand are also seeking for the place where they can get enough shading since the study area is in tropical zone.
IV. CONCLUSION
This study presents tree planning system and different type of tree species which are exiting in the colonial grid pattern city which are essential for a township not only for aesthetics but also for the human comfort. From there, we can be beneficial to know the original image of the colonial grid pattern city and preferable types of tree species to attain more shading. According to the previous result and discussion of this study, big trees are recommended to plant along East to West direction to reveal the original image of tree planning system of colonial grid pattern city. According to the result, we have already known the original pattern of the colonial grid pattern city and the order of shading magnitude with respect to the different types of tree species. Moreover, by establishing the Tree-shading map for this area, this study will help to evaluate colonial grid pattern city of tropical zone. Furthermore, this study could prove that hypothesis of investigation of the tree pattern and planning system of old grid pattern city can be revealed by using statistical method. Therefore, we hope this study will contribute the appropriate tree design guideline for the area when we redesign the study area and, also for the similar area to reduce the rate of the temperature and to get comfort in the city.
However, some of the vendors have to open their shops in common public area though those areas cannot get enough shading especially in East to West direction where is getting strong sunshine at the time of highest temperature. In this case, Tree shadings are very useful for helping to cool the street platform and it is the most cost effective. Therefore, we need to give better design guideline to achieve the enough shading in the area.
ACKNOWLEDGMENT
The work described in this paper is considerably revised and added some more information on the local report to AIJ (Architectural Institute of Japan), Kyushu Branch. The author would like to express her gratitude to YCDC (Yangon City Development Committee) which provide useful information of CBD area and Ms.Myint Thandar Win, Ms.Cho Lae Yi Hlaing and Mr.Ye Zin Naing who help to collect the data in study area.
REFERENCES
[1] N. Shishegar, "Street design and urban microclimate: Analyzing the effects of street geometry and orientation on airflow and solar access in urban canyons," Clean Energy Technologies, p. 1-6, 2013.
[2] A. N. Kakon, M. Nobuo, S. Kojima, and T. Yoko, "Assessment of thermal comfort in respect to building height in a high-density city in the tropics," American J. of Engineering and Applied Sciences, vol. 3, vol. 3, pp. 545-551,
[3] R. Emmanuel, "Urban shading – A design option for the tropics? A study in Colombo, Sri Lanka," International Journal of Climatology, p. 1-7, 2007.
[4] Wikipedia. Yangon City Heritage List. [Online]. Available: https://en.wikipedia.org/wiki/Yangon_City_Heritage_List#Kyauktada [5] N. G. Society. Global warming fast facts. [Online]. Available: http://news.nationalgeographic.com/news/2004/12/1206_041206_glo bal_warming.html.
[6] M. Roth, Urban Heat Islands, Singapore: National University of Singapore.
[7] Nilsson, "Urban forestry as a vehicle for healthy and sustainable development," Chinese Forestry Science and Technology, pp. 1-14, 2005.
[8] T. C. a. L. Nield, "Cooling a tropical city," Architectureau, Darwin, 2016.
[9] EPA. Using trees and vegetation to reduce heat islands. [Online]. Available.
https://www.epa.gov/heat-islands/using-trees-and-vegetation-reduce-h eat-islands.
[10] EPA. Trees and vegetation chapter of the compendium. [Online]. Available:
https://www.epa.gov/heat-islands/trees-and-vegetation-chapter-compe ndium.
[11] Ellie. Ancient city grid plan. [Online]. Available: http://www.crystalinks.com/ancientcitygrids.html.
[12] E. Dodsworth. The leading geospatial news and educational resource.
[Online]. Available:
http://spatialnews.geocomm.com/articles/qgisreview/
[13] E.Prianto, F. Bonneaud, P. Depecker, and J. P. Peneau, "Tropical-humid architecture in natural ventilation efficient point of View," International Journal on Architectural Science, vol. 1, no. 2, pp. 80-95, 2000.
[14] The Myanmar times. [Online]. Available: http://www.revolvy.com/main/index.php?s=Kyauktada%20ownship& uid=1575
[15] J. C. K. Ho, C. Ren, and E. Ng, "A review of studies on the relationship between urban morphology and urban climate towards better urban planning and design in (sub)tropical regions," in Porc. 9th International Conference on Urban Climate Jointly with 12th
Symposium on the Urban Environment, France, 2015.
[16] E. Andreou, "The effect of urban layout, street geomery and orientation on shading conditions in urban canyon in the Mediterranean," Elsevier, pp. 1-6, 2014.
[17] K. M. Mo and M. Nobuo, "A study of colonial grid pattern city in tropical zone considering urban morphology viewing from shading," in
Porc. 10th International Symposium on Lowland Technology,
Mangalore, India, 2016.
Khaing Myint Mo was born in Thahton, Myanmar, on
May 17 of 1993. She entered Thanlyin Technological University in 2010 and received Bachelor of Architecture in February 2015.Then, she was selected as a scholarship student of Japanese company for Master Degree to study at Saga University, Japan and entered Saga University in April 2015 and belonged to the laboratory of architecture and urban design. She received Master Degree of Saga University in March 2017. Now a moment, she is studying doctoral course under same laboratory of Saga University from October 2017 since she was selected as a Japanese Government scholarship student.
She worked at Amenity Design Group, Yangon, Myanmar from December 2014 to February 2015 before 2017. She had experiences of internship at Design 2000 firm, Yangon and Ishibashi Architect office, Saga, Japan. She worked at Myanmar Azusa which is Japanese Architect Office from May 2017 to August 2017 before entering doctoral course.
Nobuo Mishima was born in Fukuoka, Japan, on May 11 of 1964. He entered the Univ. of Tokyo in April of 1984 and belong to the department of urban engineering. He received the B.E., M.E., and D.E. degrees in urban engineering from the Univ. of Tokyo, Japan in 1988, 1990, and 1995 respectively. He also studied at Faculty of architecture and urban planning, Tech. Univ. of Vienna, Austria, as a scholarship student of Austrian government with Joint Study Program between two institutions, from October of 1990 to March of 1993.
He worked at Eto Shinchi Architecture Atelier in Vienna and in Osaka, Japan, as a Technical Staff from 1992 to 1994. Since he was graduated from the doctor course of University of Tokyo, he has been with Saga University, Japan, as Lecturer from 1995 to 1998, Assistant Professor from 1998 to 2007, Associate Professor from 2007 to 2013, and Professor from 2013. Moreover, he got the Qualified Architect of First-class in Japan on February 7 of 1997.