ISSN: 2334-2366 (Print), 2334-2374 (Online) Copyright © The Author(s). 2014. All Rights Reserved. Published by American Research Institute for Policy Development DOI: 10.15640/jcsit.v2n3-4a2 URL: http://dx.doi.org/10.15640/jcsit.v2n3-4a2
3D Segmentation by Spectral Clustering Using Shape Index
Rajaallah, E.1, Herouane, O.1, Moumoun, L.1 & Gadi, T.1
Abstract
The 3D segmentation is a required pretreatment for many applications of 3D processing objects (Search by content, compression, animation, etc…). The design of a segmentation algorithm must take into account the purpose of the algorithm and the application domain to which it is intended. We propose in this paper a new approach to construct the recursive spectral clustering technique using a similarity matrix. This approach is based on the shape index values of adjacent faces and a hierarchical segmentation by optimal recursive cuts. The experimental results obtained are very encouraging and have allowed us to evidence the effectiveness of our approach for segmentation of 3D objects.
Keywords: 3D segmentation, shape index, spectral clustering, similarity matrix.
Introduction
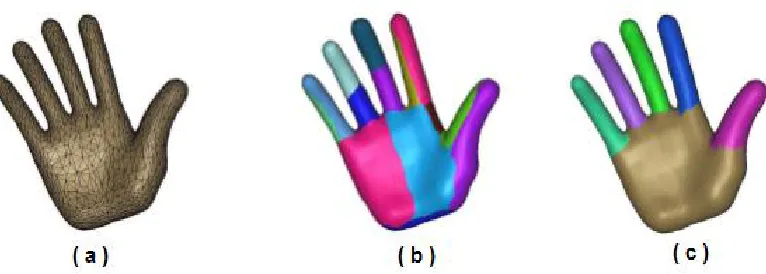
3D segmentation methods aim to subdivide a 3D object into different parts with similar characteristics; they are generally classified into two categories (Shamir, 2006): Segmentation into surface patches and segmentation into semantic parts (Figure 1). The first category generally uses geometric model information, such as curvature, which is particularly used in preprocessing algorithms for search by content. The second category is based on the notion of semantics related to human perception and aims to distinguish regions from a perceptual point of view; this approach is particularly useful in animating 3D objects.
1Laboratory LAVETE - Faculty of Science and Technology - University Hassan 1st Settat – Morocco.
Figure 1: 3D Mesh of Hand Model (a) Segmentation Into Surface Patchs (b)Segmentation into Significant Parts (c)
Segmentation into surface patches usually tends to simulate the cut that could be realized by human vision (semantic parts). So it amounts to solving the optimization's problem of the cut.
To solve the optimization's problem of the cut, we propose in this paper a segmentation method based on spectral clustering.By spectral clustering, we refer to the partitioning algorithms which are based on the eigenvectors (eigenvalues) of a matrix defined appropriately that captures the specific data of the domain studied.
In this paper we present a new approach for calculating the similarity matrix without the addition of the information about the areas of the faces, the reason is to avoid dependence on the mesh’s regularity; for the normalization of this matrix we opted for a standard normalization by symetric's division (Ng and Jordan, 2002), and we also use the normalized Cheeger Cuts (Szlam and Bresson, 2010), this approach reduces the computational complexity of the similarity matrix, its normalization and optimization of the cut, while preserving the best performance of segmentation of the previous approach as will be shown in the evaluation part.
This paper is organized as follows, first, we present the related works of the methods of segmentation using the spectral clustering, and then we will present our approach of segmentation. Finally, we present qualitative and quantitative evaluation of the proposed method.
1. Related Works
Recently, several methods of 3D mesh segmenting from a spectral clustering have been developed. The readers may consult the works of (Zahang et al., 2007), (Von Luxburg, 2007)and the thesis of (Liu, 2009) for more details. There are two approaches used to implement the spectral clustering (Filippone et al., 2008), in the first one, the data is partitioned into k groups simultaneously " k-way" , in the second, a clustering into two groups is used recursively until reaching the desired number of clusters "2-way".
For the second approach, we can mention the very important work of (Shi and Malik, 2000), we chose this second approach in our research, indeed, the previous paper (Chahhou et al., 2011) can be seen as an adaptation of (Shi and Malik, 2000) in a 3D context, wherein, the challenge for 3D segmentation is solved as a graph partitioning problem and proposes a novel normalized global condition for segmenting the graph. The normalized cut condition measures both the entire dissimilarity between each two groups and the total similarity within the groups. The results obtained are very encouraging and prove the success of the approach for segmentation of 3D objects.
2. Spectral Analysis
Hereafter we consider a graph G of a 3D mesh of n faces. This graph is represented by a similarity matrix A (G) of size n × n which describes the neighborly relations between the faces. The value of Aij depends on the shape index characterizing the curvature between faces i and j of the mesh, the diagonal of A contains zeros.
2.1. The Minima Rule
Hoffman and Richards proposed the minima rule (Figure 2), that is to divide a surface in parts considering for each principal curvature its negative minima. Areas where cuts should be realized, according to the theory of the minima rule are locations where a human being makes the intuitive decomposition of the object (Figure 2), they are named hyperbolic regions with negative curvature. These regions correspond to the faces of the mesh for which the shape index is between 0.25 and 0.5.
Figure 2: Minima Rule
We propose using the normalized cheeger cuts (Szlam and Bresson, 2010) in the graph associated to the mesh object.
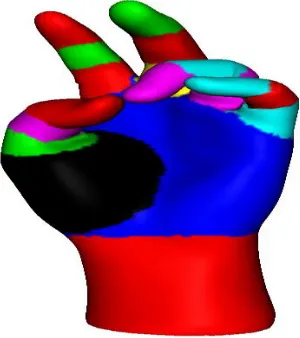
Figure 3: Example of a Human Segmentation (Benhabiles et al., 2010)
2.2. Shape Index
The proposed approach is based on the use of a shape index to locally characterize the curvature.
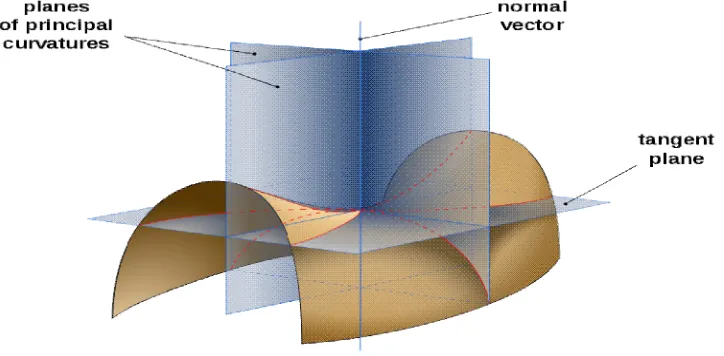
Figure 4: View of the Planes Establishing the Main Curvatures on a Minimal Surface2
Let p be a point of a 3D surface, note and , the principal curvatures associated with the point p. The shape index of the point p, denoted by SI , is defined as:
SI = −
π arctg avec k > k (1)
The shape index takes values in the interval [0,1] and it is not defined for flat surfaces (K1 = K2 = 0). C variable defined by Equation 2, is used to recognize this type of surfaces.
k = ((k ) + (k ) )/2 (2)
If C is less than a pre-determined threshold then it means that the face is plane.
2.3. The Normalized Laplacian Matrix
The diagonal of the similarity matrix contains zeros, to solve this situation we define the Laplacian matrix associated with the graph as follows:
L = D−A (3)
Where I is a unit matrix and D is a diagonal matrix with Dii corresponding to:
D = ∑ A (4)
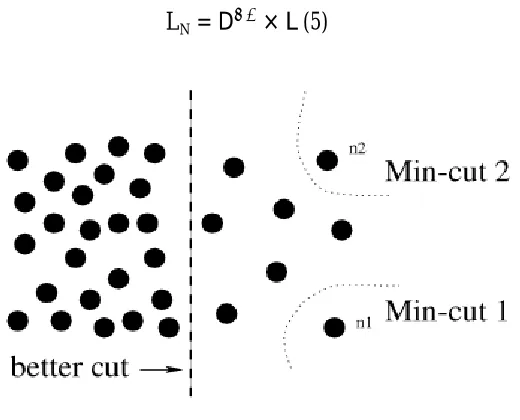
To avoid problems of poor partitioning (Figure 5), the Laplacian matrix is first normalized (See the work of Shi and Malik for more theoretical detail). The normalized Laplacian matrix is defined as:
LN = D × L (5)
Figure 5: A Case Where Minimum cut gives a Bad Partition (Shi and Malik, 2000)
3. Our Approach
3.1. Construction of Similarity Matrix
The principal idea of (Chahhou et al., 2011), initially, is to partition a 3D model into 2 segments which afford to have clusters with similar sizes. Therefore, we should ensure that the weights associated with the edges lying in hyperbolic regions with negative curvature are small enough to promote cuts in these areas compared to others, by experiments, the value “0.1” provides the best results. We give The value “0” if two faces are not neighbors and for the other values of the shape index the
value “1 + + ”, areaf and areafbeing the areas of the faces i and j,
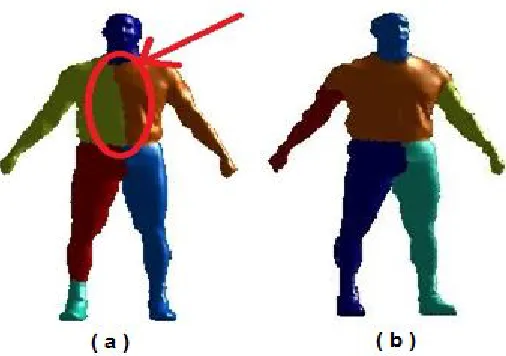
adfi and adfj are the numbers of adjacent faces. The argument given by (Chahhou et al., 2011) for this addition is to enable the normalization of the similarity matrix taking into account the total area of the formed clusters. Favoring the surface information over the geometric and structural information can generate erroneous segmentation (Figure 6) with respect to a human semantic segmentation; to overcome this limit, in our approach we will remove the sum of the two ratios, we consider the normalized Laplacian matrix of the similarity matrix (Formula 3) and we use a normalization of this matrix (Formula 5) by symmetric (Shi an Malik, 2000), this normalization is done to avoid cases of degeneration and favor the geometric information and structural information on the curvature in the neighbors of each face (use of the matrix D).
So, our similarity matrix is defined by:
A =
0, if faces i and j are not adjacent 0.1, else if 0.25 < SI ≤0.5 1, else
(6)
Figure 6: Example for Segmentation of a Human Model3Based on the Surface Information (A) and Segmentation Based on Geometric and Structural
Information (B)
3.2. The Clusters
The use of the first K eigenvectors corresponding to the K largest eigenvalues provides a projection space of lower dimension (K) than the original space of dimension N. The eigenvectors are calculated by solving the equation proposed in (Shi and Malik, 2000), as following:
L ∗U= λ*D*U (7)
The dimension of the matrix U (Matrix of eigenvectors) is then constructed by storing these eigenvectors in columns:
U = [u , u , … , u ] (8)
The vector ui corresponding to the i-th smallest eigenvalue of U and its row’s number is equal to the number of the mesh’s faces.
After forming U, form the T ∈ Rnxk from U by normalizing the rows to norm 1 (Ng and Jordan, 2002), its elements are defined as follows:
t = u
(∑ u ) / (9)
Define Y = ti2,i=1…n; each value yi of Y is considered a weight for a facei of the mesh, and partitionthe graph G into clusters C 1 and C2 by use of the normalized cheeger cuts (Szlam and Bresson, 2010).
The process is repeated on the resulting Ci to get the number of the clusters requested.
3.3. Summary of the Algorithm
The steps of the algorithm are as follows:
1. Given a graph G of a 3D mesh of n vertices represented by a similarity matrix A of size n × n which describes the neighborly relations between the faces.
2. Define the normalized Laplacian matrix of A.
3. Calculate the eigenvectors associated with the smallest eigenvalues.
4. Use the eigenvector with the second smallest eigenvalue to bipartition the graph by use of the normalized cheeger cuts.
5. Decide if the current partition should be subdivided and recursively repartition the segmented parts if necessary.
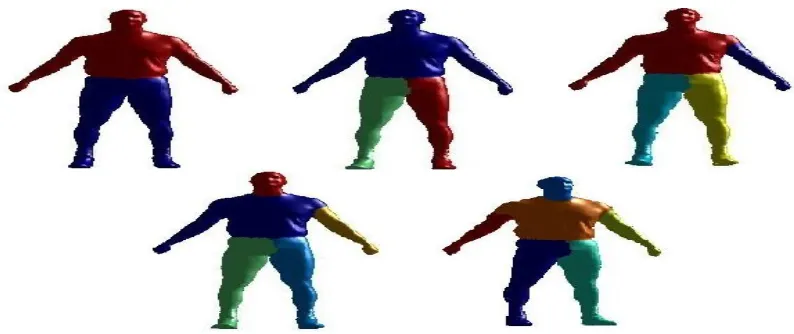
Figure 7: Example of the Steps of the Recursive Segmentation by Spectral Clustering
4. Experimental Results
4.1. Segmentation Benchmark
To evaluate the performance of our segmentation method, we used the database "3D Segmentation Benchmark" proposed by (Benhabiles et al., 2010). This benchmark was created within 3D Models and Dynamic Models Representation and Segmentation. It provides an automated tool4 to evaluate, analyze and compare different algorithms for automatic segmentation of 3D meshes.
4.1.1.Test Database
The proposed corpus contains twenty-eight 3D models of triangular meshes. These models derived databases: GAMMA INRIA, and "Princeton Shape Benchmark," they are grouped into five classes, namely: "animal", "furniture", "hand", "human", and "bust". To achieve human segmentations, the authors have used 36 volunteers to manually segment the corpus models. Therefore, they built for each 3D model, 4 human segmentations (Figure 8) which gives a total of 112 segmentations.
Figure 8: Example of Human Segmentations (Benhabiles et al., 2010)
4.1.2.The Benchmark Algorithms
The "3D Segmentation Benchmark" uses 8 automatic segmentation algorithms, we briefly describe each algorithm:
The aim of (Huebner, 2012)segmentation algorithm is to iteratively split an oriented bounding box (starting from one root box) in a way that the new item sets yield a better approximation of the box shape. Iterative splitting of a root box corresponds to the build- up of a hierarchy of non- axis aligned minimum volume bounding boxes (MVBBs). (Benhabiles et al.,2011) proposed an algorithm based on two main steps: the off-line step in which the objective boundary function is learned using a set of segmented models, and the on-line step in which the learned function is used to segment the input mesh.
(Lavoué et al., 2005) proposes a surface segmentation algorithm using a mechanism of growth region, the algorithm includes the mesh vertices in regions of similar curvatures, (Moumoun et al., 2010)proposed an adaptation of the segmentation method of the watershed line, which had proved its success for 2D images, to 3D mesh objects. The Plumber algorithm by (Mortara et al., 2004)segments a surface into connected components that are either body parts or elongated features,that is, handle-like and protrusion-like features, together with their concave counterparts.
4.2. Qualitative Evaluation
Evaluating segmentation algorithms is a delicate issue; the different contexts of use may favor a certain type of segmentation over another one, in order to improve the final performance. However, the problem of evaluation is important for researchers and users. Researchers should propose new algorithms and compare them with existing ones and users should be able to choose one of the segmentation methods according to their needs.
Due to the limited literature on the evaluation, most researchers use qualitative evaluation to compare their results. For this, images from different segmented objects are compared with images from others' work to let the reader judge the quality of the segmentation side. This type of evaluation can determine thedegree of visualrelevance for segmented3D models.
Figure 9: Examples of the Segmentation’s Quality of Our Algorithm
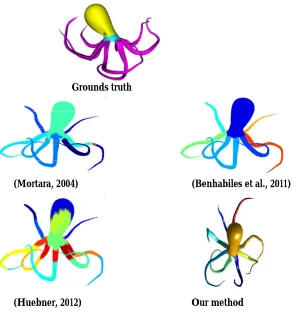
Figure 10 shows the results obtained by our method and the methods (Benhabiles et al., 2011), (Huebner, 2012) and (Mortara, 2004) and the ground truth, for octopus’s object.
Grounds truth
(Mortara, 2004) (Benhabiles et al., 2011)
(Huebner, 2012) Our method
The result of the segmentation obtained by this method has a good quality when compared with those obtained by the methods (Benhabiles et al., 2011), (Huebner, 2012) and (Mortara, 2004).
To evaluate the relevance of our segmentation algorithm with respect to the set of objects in a database, the qualitative evaluation is insufficient; hence the necessity of using a quantitative one. This type of evaluation will be presented in the next section.
4.3. Quantitative Evaluation
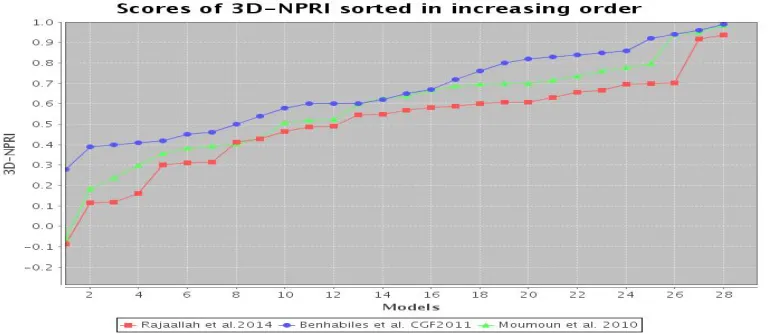
For a quantitative evaluation we use the metric "3D Normalized Probabilistic Rand Index» (3D-NPRI) proposed by (Benhabiles et al., 2010). This metric takes values between -1 and 1, where 1 indicates a perfect similarity between the automatic segmentation and the real one, while a score below zero usually indicates worse than random segmentation.
According to authors, this metric is better than others in terms of properties and discriminative power.
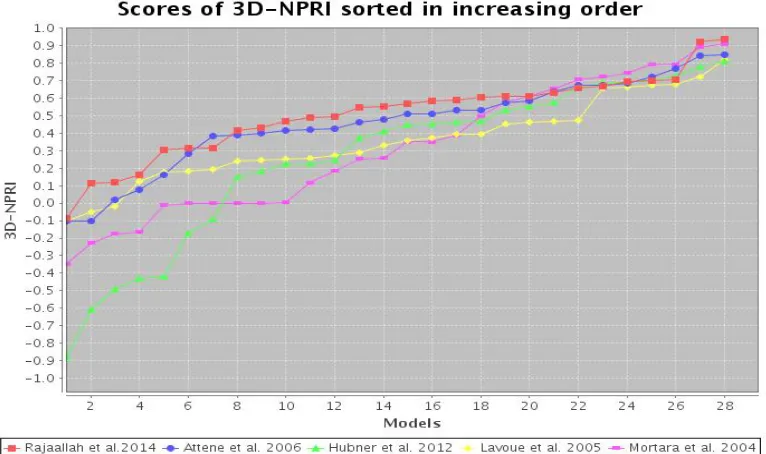
Figures 11, 12and 13 demonstrate the different variations of each NPRI 3D-model corpus, in ascending order of 3D-NPRI score obtained for our approach and the other eight different segmentation algorithms.
Figure 11: The First Comparative Graph
For the method (Tierny et al., 2007) and (Shapira et al., 2008) the results obtained for some objects are significantly higher, but remain lower than for others
(Figure 12).
Figure 12: The Second Comparative Graph
Figure 13: The Third Comparative Graph
Table 1 shows the numerical performance of our method, which was ranked fourth overall among the different methods of the benchmark, with a difference of 0.01% with the method of (Shapira et al., 2008), with no negative value.
Class Method Name
Animal Bust Furniture Hand Human Global
Mean Benhabiles et al.
CGF2011
0.68 0.41 0.79 0.68 0.69 0.65
Moumoun et al., 2010
0.58 0.27 0.81 0.65 0.57 0.58
Shapira et al., 2008 0.62 0.24 0.85 0.19 0.66 0.51
Rajaallah et al., 2014 0.50 0.15 0.78 0.57 0.51 0.50
Attene et al. 2006 0.45 0.09 0.56 0.52 0.61 0.45
Tierny et al. 2007 0.51 -0.07 0.36 0.78 0.50 0.41
Lavoué et al., 2005 0.43 0.10 0.38 0.45 0.29 0.33
Mortara et al., 2004 0.36 0.00 0.54 0.27 0.33 0.30
Hubner et al., 2012 0.52 -0.08 0.08 -0.09 0.37 0.16
Table 1: Performance's Numeric Results5
5
The values associated with the "Bust" class are generally low for all algorithms; this limit is not due to the nature of the segmentation algorithm, because even with the best segmentation, the grounds truth, we can clearly see segmentation faults (Figure 14) where two objects of the same class can then have different segmentations. The main causes are the form of the objects and their heterogeneity. Despite this, the results obtained by our algorithm remain in the top four.
Figure 14: Objects of the Bust Class
Despite its 4th position, our approach is less complex compared to other methods of the Benchmark and operates simple mathematical tools.
5. Conclusion
In this work, we proposed a segmentation method based on the value of the shape index and the recursive spectral classification of 3D models segmentations. The obtained results showed very clearly the importance of using the logic of the human perception in segmentation algorithms. The principal idea of this approach is to insert into one matrix, together, geometric information and structure information inorder to ensure that the cut occurs in the hyperbolic regions with negative curvature. The segmentation algorithms differ in how to segment the models, some algorithms are more appropriate for certain categories than others. With our segmentation method we have encouraging results for all classes.
References
Attene, M., B. Falcidieno and Spagnuolo, M. (2006). Hierarchical mesh segmentation based on fitting primitives. In the Visual Computer: International Journal of Computer Graphics, vol. 22(3), 181-193.
Benhabiles, H., Lavoué, G., Vandeborre, J.P. and Mohamed D. (2011, November). Learning boundary edges for 3D-mesh segmentation. Computer Graphics Forum - Eurographics Association - Ed. Blackwell, volume 30, number 8, 2170-2182.
Chahhou, M., Moumoun, L., El far, M. and Gadi, T. (2011, December). Consistent segmentation algorithm for 3D retrieval. In the 3rd International Conference on Information and Multimedia Technology (ICIMT 2011), Dubai-UAE, IEEE.
Filippone, M., Camastra, F., Masulli, F., and Rovetta, S. (2008, January). A survey of kernel and spectral methods for clustering. Pattern Recogn., vol. 41, 176-190.
Hoffman, D. D. and Richards, W. A. (1987). Parts of recognition. Readings in Computer Vision: Issues, Problems, Principles and Paradigms, 227-242.
Huebner, K. (2012). A Toolbox for Box-based Approximation, Decomposition and GRasping. Robotics and Autonomous Systems 60, 367–376.
Koenderink, J. (1990). Solid shape. In The MIT Press. Cambridge, Massachusetts.
Lavoué, G., Dupont, F. and Baskurt, A. (2005). A new CAD mesh segmentation method, based on curvature tensor analysis. In Computer-Aided Design, vol. 37(10), 975-987.. Liu, R. and Zhang, H. (2004). Segmentation of 3D meshes through spectral clustering. In Proceedings of the 12th Pacific Conference on Computer Graphics and Applications (PG'04), Washington, DC, USA, IEEE Computer Society, 298-305.
Liu, R. (2009). Spectral Mesh Segmentation. PhD thesis, Simon Fraser march.
Mortara, M., Patané, G. and Spagnuolo, M., Falcidieno, B,. and Rossignac, J. (2004). Plumber: a method for a multi-scale decomposition of 3D shapes into tubular primitives and bodies. ACM Symposium on Solid Modeling and Applications.
Moumoun, L., Chahhou, M., Gadi, T. and Benslimane, R. (2010). 3D Hierarchical segmentation using the markers for the whatershed transformation. In International Journal of Engineering Science and Technology (IJEST), vol. 2(7), 3165-3171. Ng, A.,Jordan, M. and Weiss, Y. (2002). On spectral clustering: Analysis and an algorithm.
JProceedings of Advances in Neural Information Processing Systems, p. 849-856. Shamir,A.(2006). Segmentation and Shape Extraction of 3D Boundary Meshes. In
State-of-the-Art Report, Proceedings Eurographics, 137-149.
Shapira, L., Shamir, A. and Cohen-Or, D. (2008). Consistent mesh partitioning and skeletonisation using the shape diameter function. In Visual Computer, vol. 24(4), 249–259.
Shi, J. and Malik J. (2000, August). Normalized cuts and image segmentation. IEEE Trans. Pattern Anal. Mach. Intell., vol. 22, 888–905.
Szlam,A. and Bresson X. (2010, June). Total variation and cheeger cuts. Proceedings of the 27th International Conference on Machine Learning (ICML-10), 1039–1046.
Tierny, J., Vandeborre, J.P. and Daoudi, M. (2007). Topology driven 3D mesh hierarchical segmentation. In IEEE International Conference on Shape Modeling and Application(SMI'07).
Von Luxburg, U. (2007). A Tutorial on Spectral Clustering. Statistics and Computing, vol. 17(4), 395-416.