(UDC: 544.4)
Estimating parameters of a model of thin filament regulation in solution
using genetic algorithms
B. Stojanovic1*, M. Svicevic1, Dj. Nedic1, M. Ivanovic1, S. M. Mijailovich2,3
1Faculty of Science, University of Kragujevac, Serbia
[email protected], [email protected], [email protected], [email protected]
2
Tufts University, School of Medicine, Department of Medicine, MA 02135, USA, [email protected]
3 Steward St. Elizabeth‘s Medical Center, Boston, MA 02135, USA,
[email protected] *Corresponding author
Abstract
The estimation of chemical kinetic rate constants for any non-trivial model is complex due to the nonlinear effects of second order chemical reactions. To accomplish this goal we have developed an algorithm based on genetic algorithms (GA) and then tested the effectiveness of this method on the McKillop–Geeves (MG) model of thin filament regulation. This method have shown better accuracy than deterministic methods, the Damped Least Squares (DLS), quasi-Newton (QN) and simulated annealing (SA). However, it requires large number of evaluations of candidate solutions which take longer CPU time. In this paper, a platform for distributing evaluation of different sets of parameters (i.e. individuals in genetic algorithm) over a number of threads on a single computer is presented. Performed tests have shown that parallelized evaluation provides significant speedup with better accuracy and estimation times comparable to deterministic methods.
Keywords: McKillop–Geeves, genetic algorithms, parameter estimation, distributed evaluation
1. Introduction
on chemical kinetics are least squares methods that minimize an objective function iteratively by working with its gradient (Farinha et al., 1997; Lisy et al., 1998; Tadi et al., 1998). In these methods the objective function is defined as the error between the experimental observations and the predictions of the model, which depends on the model parameters. Several approaches, such as Damped Least Squares (DLS), quasi-Newton (QN) and simulated annealing (SA), have been developed to solve this difficult minimization problem.
The estimated rate constants by DLS, QN and SA were critically evaluated for the accuracy and robustness (Mijailovich et al., 2010). Damped Least Square (i.e. Levenberg–Marquardt) inversion is a widely used method for the estimation of model parameters that has two important features: quantitative evaluation of the uniqueness of the estimated parameters and good parameter resolution (Menke, 1989). The DLS method is based on iterative minimization of the mean-square error of the model predictions with respect to experimental observations. The QN method estimates parameters by minimizing the error with the Newton algorithm (Dennis Jr. et al., 1983; Nocedal et al., 2006). SA algorithm provides a global search method specifically designed for functions with multiple minima over wide range of parameters (Kirkpatrick et al., 1983; Press et al., 1986). All of these methods suffer the problem of local minimum, except SA that is also a global method. Ideally, the parameter set that minimizes the objective function is a manifold of dimension zero in which the minimum of error is a single distinguished point in the error landscape. In this case, the error increases as the parameter values vector moves away from this point in any arbitrary direction. However, in systems where multiple parameters need to be estimated, the optimal parameter set may span a manifold of dimensions equal or greater than one, forming ―valleys‖ or ―hyper-valleys‖ in the error landscape, and, therefore, global methods should be used.
The primary focus of this study is on the estimation of kinetic parameters using genetic algorithm that solves the problem of local minima. To improve performance, a platform for distributed evaluation of multiple sets of the model parameters (i.e. individuals in GA) based on the master-slave model is introduced. The accuracy and effectiveness of the presented method is compared to existing deterministic methods, and strengths and weaknesses of these methods are discussed.
2. Theoretical background
2.1 The McKillop–Geeves three-state model of thin filament regulation
In vertebrate skeletal and cardiac muscles the interaction between myosin and actin is regulated by the actin-associated proteins, tropomyosin (Tm) and troponin (Tn), depending on the concentration of calcium (Ca2+). The soluble fragment of the myosin molecule S1 is widely used for studying kinetics of myosin binding to regulated actin filaments in solution. This fragment, also known as the motor domain, contains all of the ATPase and actin binding properties of the parent myosin. In the absence of nucleotide, myosin-S1 forms a tight (rigor-like) bond to actin filaments. McKillop and Geeves (McKillop et al., 1993) proposed that the regulation of tropomyosin and troponin-containing thin filaments can be interpreted using three-states of the actin filament: (1) ―blocked‖ state, in which myosin-S1 binding to actin is prohibited; (2) ―closed‖ state, in which S1 can bind with actin, but cannot be isomerized further to next step; and in the (3) ―open‖ state, where no limitation to S1 binding to actin is imposed. The unit size of Tm–Tn complex is assumed to cover 7 actin monomers, denoted as
7
therefore affected by Ca2+ concentration. There are three myosin states in the model: one unbound state where myosin is in solution and two bound states where myosin is bound to actin. The bound states are denoted as weakly bound A-states and strongly bound, i.e. rigor-like states, as R-states (Fig. 1).
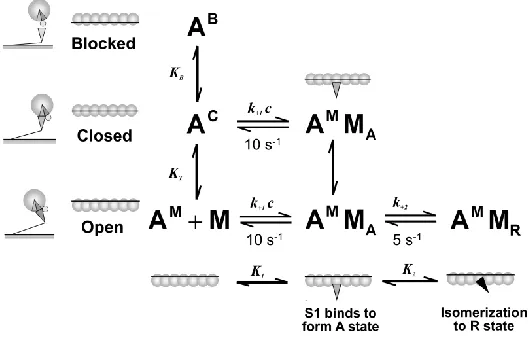
Fig. 1. MG three-state model scheme (McKillop and Geeves, 1993). In the MG model the structural unit, A TmTn7 , is schematically shown as seven open circles representing the actins connected via a line representing the tropomyosin: the blocked states, AB, in which no myosin-S1 binding can occur, the closed state, AC, in which only weak binding of S1 can occur, and
the open state, AM, which allows isomerization of the myosin-S1 to the rigor-like state. The ratio of the three states in absence of myosin-S1 is defined by the equilibrium constants KB
(between the blocked and closed states) and KT (between the closed and open states). Weakly bound myosin states are denoted as A-states and rigor-like states are denoted as R-states. The
rate of myosin binding is defined by equilibrium constant K1k1/k1, and the rate of isomeration od S1 into R-state is defined by the equilibrium constant K2k2/k2 (adopted
from Mijailovich et al., 2010).
11 2
2
1 1 2 1 3
45
2 2 45
7
7
B B
B B T
dp t
k p k p
dt dp t
k p k k c k p k p
dt
dp t
k k p
dt
(1)
where p ti
is the fraction of TmTn units in state i, which is defined by position of Tm (i.e. inblock, closed or open state) and a particular combination of actin unoccupied sites and S1 bound in A- or R- states within the actin TmTn7 unit. The equilibrium constants of the model are defined as KBkB/kB, KT kT/kT, K1k1/k1 and K2k2/k2, where kB
,
T
k ,k1 and k2 are forward rate constants, and kB
,
kT,k1 and k2 are backward rate constants. The system of Eq. (1) is nonlinear because the forward transition rate between the free actin state and myosin bound to actin in the A state depends on the concentration of unbound S1. In Eq. (1) we denoted S1 concentration as c
S1 , thus the effective myosin binding rate constant, k c1 , is in units s−1. The concentration of S1 in solution, i.e. theconcentration of unbound myosin, decreases as myosin binds to actin and, therefore, decreases the effective rate of myosin binding. The concentration of free myosin-S1 in solution is equal to the initial concentration of free myosin-S1, [S1o], minus concentrations of myosin bound to
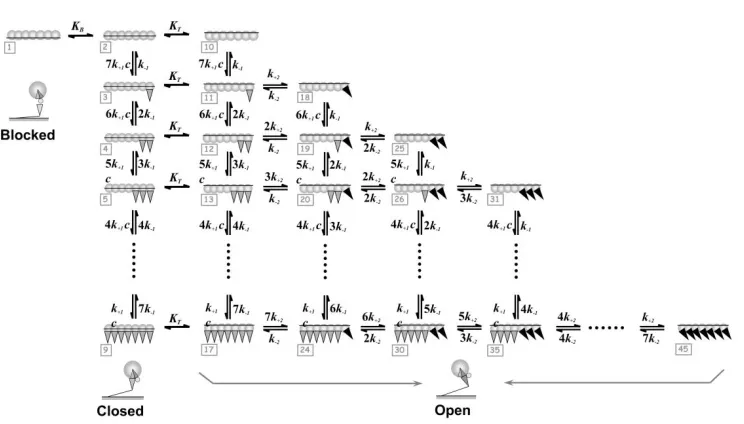
Fig. 2. Schematic representation of the three-state MG model where each TmTn complex is assumed to cover seven actin sites. The complete kinetic diagram for the binding of S1 to a structural actin TmTn7 unit includes seven actin monomers. The resulting model contains one
blocked state, eight closed states and 36 open states. All states are denoted as numbers in the square boxes (gray). The configurations of some states are shown. The fused two-way arrows
represent the transitions from the blocked to the closed state with equilibrium rate transition constant, KB and the transition from closed to open state with the rate KT. The two-way arrows represent forward and backward transition rates between myosin states interacting with actin: (i) S1 from solution weakly binding to actin (into A-state) and (ii) transition from A-state to R-state. The forward rate of S1 binding from the solution to the actin in an actin TmTn7 is
defined as effective binding rate k c s1
1 multiplied by the number of unoccupied actinmonomers within the unit, and the backward rate of the S1 unbinding from A-state back to solution by the detachment constant k1 multiplied by the number of S1 bound in A-state in the
7
actin TmTn . Similarly, transition from A-state to R-state is defined by the forward constant 2
k multiplied by the number of S1 bound in A-state in the actin TmTn7 , and transition from R-state to A-state is defined by the backward rate constant k2 multiplied by the number of S1
bound in R-state in the unit (adopted from Mijailovich et al., 2010).
Thus the binding rate depends on probabilities of all myosin bound states, pbound. The equations of the MG model are solved numerically by Gear‘s backward differentiation formulas (up to order five) (Hindmarsh, 1972). All 45 equations can be easily solved for a wide range of parameter combinations. However, in some extreme cases in which some of the parameters take much larger values than others, the set of Eq. (1) becomes numerically ―stiff‖ and it is difficult to solve it using standard methods. In those cases, Monte Carlo simulations should be used in order to solve the resulting stiff set of equations efficiently.
Once we determine the vector of 45 states, p k
,t , where the vector k
k1, ,kn
calculate the fraction of actin sites in each one of the three actomyosin states by summing the occupancy of the actin sites over all TmTn units, and normalizing by the total number of actin sites occupied by S1 in the R-state when the system is in equilibrium. The model predictions are tested against measurements of the pyrene fluorescence intensity during stopped-flow experiments (Boussouf et al., 2007a; Boussouf et al., 2007; Boussouf et al., 2007b). A drop in pyrene fluorescence is proportional to myosin binding to actin in the R-state. Thus, the calculated instantaneous fractions of actin sites that are not occupied or which are in the A-state (i.e. which are not in the R-state), denoted by p k
,t , can be compared with correspondingexperimental data, dobs
t , at the same instant. Here, the vector k
k1, ,km
represents theset of m free model parameters that need to be estimated. Note that k is usually a subset of the complete parameter set k, since some of the parameters are prescribed by the experimental protocol, or they are measured (or estimated) independently in which case mn. For example, the prescribed concentration of actin, myosin and calcium are the same in both the model simulations and those used in the experiments. Also, m is reduced if some parameters, such as several rate or equilibrium state transition constants, vary a little over the course of multiple experiments and can be measured independently.
2.2 A Genetic algorithm
The concept of Genetic Algorithm (GA) was developed by John Holland and his colleagues in the 1960s and 1970s (Holland, 1975). Genetic algorithms are search algorithms inspired by the theory of natural selection, where the strong species have greater opportunity to survive and pass their genes to future generations via reproduction, then the weak ones. The GA is a probabilistic algorithm which maintains a population of individuals, p t
x t1
, ,xn
t foriteration (generation) t. Each individual represents a potential solution to the problem at hand, and it is implemented as some (possibly complex) data structure S. Each solution x ti( ) is
evaluated to give some measure of its fitness. Then new population (iteration t1) is formed by selecting fitter individuals (selection step).
In GA terminology, a solution vector xX is called an individual or a chromosome and corresponds to a unique solution x in the solution space. Chromosomes are made of discrete units called genes. Each gene controls one or more features of the chromosome. In this paper, genes are assumed to be real numbers.
In every single generation t, GA operate with a collection of chromosomes
1
, , n
P t x t x t , called a population. The population is normally randomly initialized in generation t0. As search evolves from generation to generation, the population includes fitter and fitter solutions, and eventually it is dominated by a single solution. Holland (Holland, 1975) also presented a proof of convergence (the schema theorem) to the global optimum where chromosomes are binary vectors.
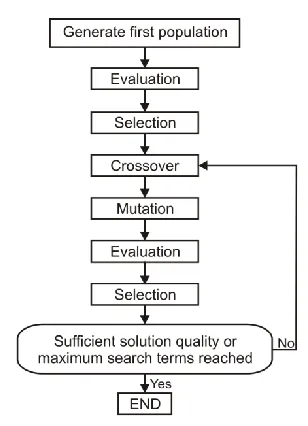
Fig. 3. Genetic algorithm. GA uses two operators to generate new solutions from the existing ones: crossover and mutation. In the crossover, generally two chromosomes, called parents, are
combined together to form new chromosomes, called offspring. By iteratively applying the crossover operator, genes of good chromosomes are expected to appear more frequently in the
population, eventually leading to convergence to an overall good solution. The mutation operator introduces small random changes into characteristics of chromosomes. While crossover leads the population to converge by making the chromosomes in the population alike,
mutation reintroduces genetic diversity back into the population and assists the search escape from local optima. Reproduction involves a selection of chromosomes for the next generation.
In most general case, the fitness of an individual determines probability of its survival for the next generation.
Following section describes how we applied genetic algorithm in evaluating parameters of a model of thin filament regulation in solution.
3. Implementation
3.1 Implementation of the genetic algorithm
The McKillop–Geeves (MG) three-state model has four free parameters: the equilibrium constants KB kB/kB, KT kT/kT, K1k1/k1 and K2k2/k2, where kB
,
kT,1
k and k2 are forward rate constants, and kB
,
kT,k1 and k2 are backward rateconstants, what was discussed in the section 2.1. Values of kB
,
kT,k1 and k2 are fixed,while the values of the remaining constants kB
,
kT,k1 and k2 should be evaluated so that the model results are as close as possible to experimental results.individual. The fitness of an individual is determined by its ability to simulate model behavior as close as possible to experimental results. Experimental observations are represented by a set of N values of the pyrene fluorescence sampled at discrete time points. The simulation has the same type of values as the experiment, but the calculations are done by much smaller time steps, not necessarily coinciding with the times at which data were acquired. Interpolated simulated values at each experimental point are compared to corresponding experimental value and mean square error is calculated. The deviation between simulated and experimental results for each individual is defined by Eq. 2. An individual has a better grade, i.e. a higher value of the fitness, if the value of the errorfunction in Eq. (2) is smaller.
2 exp 11 N
sim i
error y y
N
(2)Initial population in genetic algorithm consists of a number of individuals (simulations) with randomly chosen chromosomes (sets of parameters). Each chromosome is created by generating its parameters randomly in the given ranges. The evaluation is carried out for each individual, executing the simulation using the parameters encoded by the chromosome and calculating its error according to Eq. (2). After that, selection of individuals based on their fitness is performed. In this paper, the Binary Tournament selection operator is used, where one half of fittest (with smallest error) individuals are selected to be parents for next generation (Mitchell, 1996). The two best individuals (i.e. sets of parameters) are directly transferred to the new generation in order to prevent loss of individuals with smallest value of errorfunction. Applying the crossover operator on chromosomes of two randomly selected individuals from previous generation, consisting of the 50% of the sets of data that best fit the experiments, two new individuals are created. In fact, these are two new simulations that combine characteristics of both parent simulations. The crossover process continues until a sufficient number of individuals are formed. The crossover operator exchanges genetic content of individuals at randomly chosen positions of the chromosome. Simulated Binary Crossover was used for this genetic algorithm (Deb et al., 1995).
Mutation operator is an unary operator applied to a number of individuals in order to prevent local minima problem. Random change of chromosomes prevents all simulations to converge to the same set of parameters (local minimum), introducing new genetic material with certain probability. In this paper, Polynomial Mutation Operator is used. Polynomial Mutation Operator is based on polynomial probability distribution instead of a normal distribution (Deb et al., 1995).
3.2 Proposed platform for distributing the evaluation
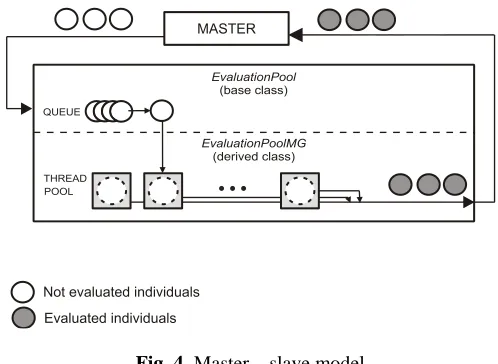
The distribution of evaluation imposed the use of master-slave model as the most convenient way to parallelize the evolutionary algorithm. This model aims to distribute the (objective function) evaluation of the individuals on several threads on one computing resource while the master node executes the rest of the algorithm in sequential fashion. The communication overhead between the threads in presented simulations requires much less time than the parallel calculations in the individual threads, so the communication overhead can be neglected. Thus, the master-slave model is reasonable to use in this particular setting.
its job is to distribute them to available threads and to assign evaluation result to the corresponding individual.
EvaluationPool is an abstract class that serves as the base for deriving specific classes, which perform evaluation out of the main thread. Every evaluation pool contains queue where solutions sent to evaluation are collected. It also has methods for manipulating the queue. Evaluation pool may be in one of three states: idle, busy and error.
Fig. 4. Master – slave model
For evaluation using threads the class EvaluationPoolMG was developed. This class inherits class EvaluationPool and represents intermediate between software that performs evaluations and available threads. The role of this class is to take solutions from the evaluation queue and send them to free threads. Its responsibility is receiving values of fitness functions from threads and storing them into collections inside each solution.
The class uses the thread pool provided by the .NET Framework through the ThreadPool class (MSDN Library). A thread pool is a collection of threads that can be used to perform a number of tasks in the background. The individuals are assigned to the separate threads from the thread pool (Fig.4). That way, evaluations can be processed asynchronously, without tying up the primary thread of evaluation pool or delaying the processing of subsequent requests. When evaluation of the solution is done, the result is returned and assigned to the solution. Once a thread in the pool completes its task, it is returned to a queue of waiting threads. Then it can be reused for the rest of queued individuals. This reuse enables applications to avoid the cost of creating a new thread for each task. The evaluation pool remains in the busy state as long as there are solutions waiting for evaluation in the queue. Once all threads return results and there are no more solutions in the queue, the evaluation pool changes its state to idle and sends a signal to the main thread that all evaluations are done.
Typically, the number of threads can be taken to be equal to the number of CPU cores in the system, but this value may be configured differently depending on the specificities of the system analyzed, thus accordingly more (or less) threads can be used to parallelize genetic algorithm.
4. Results and discussion
There are two important features of the model. One is accuracy, i.e. good matching between the simulation results and the experimental measurements, while the second is related to performance, i.e. the time needed to perform the estimation. Here we compare accuracy and performance of the proposed genetic algorithm to those obtained by DLS, QN and SA methods.
4.1 Estimation of MG model parameters by DLS, quasi-Newton, SA and genetic algorithm estimation methods
We estimated kB,kT,k1 and k2 parameters (described in Section 3.1) using the DLS, QN, SA methods and the genetic algorithm by fitting the predictions of the MG model to stopped-flow transients for binding S1 to excess actin (
A 0.50M S,
1 5M). Backward rate constants used in all simulations are taken to be kB 100s 1
, kT 3000s 1
, k 1 20s 1
and
1 2 20
k s .
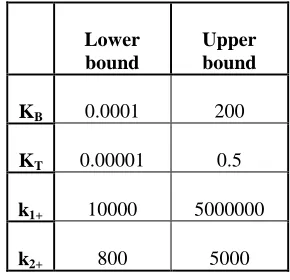
The experimental data were collected over 2s, so the simulations were also performed over the same time period. In Table 1, lower and upper limits within which the required parameter values were searched are shown.
Lower bound
Upper bound
KB 0.0001 200
KT 0.00001 0.5
k1+ 10000 5000000
k2+ 800 5000
Table 1. Ranges of unknown parameters
The population size (number of simulations per generation) in the genetic algorithm was 100 individuals evolved in 100 generations. In contrast, DLS, QN and SA methods required much smaller number of calculating because they were executed until the appropriate criterion is achieved, or until the maximum of 100 iterations is reached.
Table 2 shows values of four constants obtained by DLS, QN, SA and GA. It is important to note that different estimation methods estimated somewhat different values of the parameters
B
DLS SA QN GA
KB 1.47 5.35 7.66 2.96
KT 0.05 0.013 0.034 0.017
k1+ 1.47*106 1.47*106 1.43*106 1.48*106
k2+ 1235.07 4999.98 800.37 4499.26
Error 6,492*10-5 6.533*10-5 6.759*10-5 5.739*10-5
Table 2. Estimated parameters and estimation errors
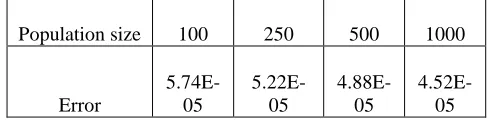
Table 2 shows that the genetic algorithm gives the best estimation of the parameters because it provides the least error compared to the experimental measurements. Increasing the population of GA, i.e. the number of individuals, increases the chance to get better results, which can be seen in Table 3.
Population size 100 250 500 1000
Error
5.74E-05
5.22E-05
4.88E-05
4.52E-05
Table 3. Estimation error as a function of population size
4.2 Speed-up of GA
Due to its nature, the genetic algorithm requires a longer period of time for execution comparing to deterministic methods. Although it gives the higher accuracy than other methods (Table 2), the performance issue is a serious drawback. In order to solve this problem, parallelization of GA (PGA) was carried out using platform described in Section 3.2. That way the evaluations within a single generation can be performed in parallel on a specified number of threads on a single machine.
Benchmark setup for performance examination considered following variable parameters: population size (100, 250, 500, and 1000 individuals), number of threads (2, 4, 8, 16 and 24). Number of threads is limited to 24, considering the number of CPU cores on the machine used for research purposes.
For the sake of completeness, the hardware/software environment description is given. The server employed is a SMP machine equipped with 2 AMD Opteron 6174 CPUs (2.2GHz, 12-core each, totaling to 24 12-cores) and 64GB RAM running Scientific Linux 6.3 x86_64. Since the original MS .Net Framework is not available for POSIX compatible platforms, we employed the open source implementation of .NET Framework – Mono v2.10 which complies with .NET 3.5 standard sufficiently for this purpose.
size varies as 100, 250, 500, and 1000 individuals. Speed-up is then calculated as SpTm/Tt
where Tm is the time needed to evaluate the parameters of one generation using sequential
genetic algorithm (for various size of the population) and T is the time neededt to evaluate the parameters using parallel genetic algorithm for variable numbers of threads N (2, 4, 8, 16 and 24).
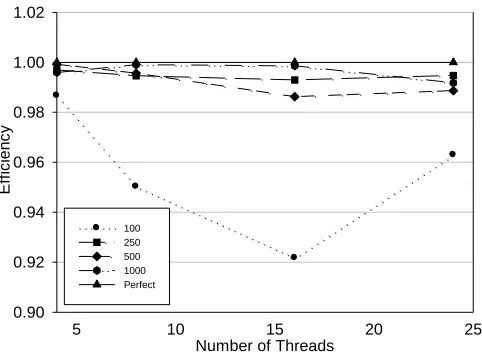
Fig. 5. Efficiency analysis of the PGA run.
Figure 5 shows efficiency (EpSp/N) as a function of number of threads and number of individuals in a generation. Perfect speed-up is the theoretical limit assuming entire communication overhead is neglected. In Figure 5 can be seen that we achieve considerably high efficiencies. The explanation of this result can be found in small communication overhead, which will be explained in more detail below.
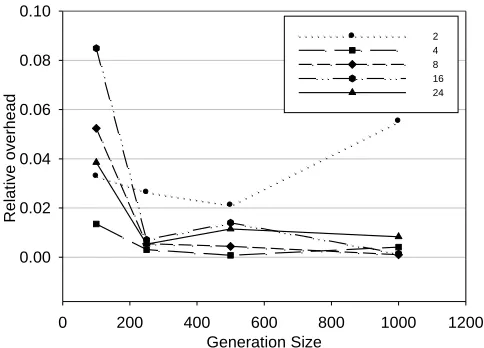
In Figure 6 we have analyzed the functional dependencies between communication overhead and number of individuals in a generation, with varying number of threads. Figure 6 contains diagram for various number of threads and various number of individuals. The overhead is quantified like
Tp Tt
/Tt, where Tp is an average time needed to evaluate a generation taken from 100 consecutive runs, and Ttdenotes theoretical ideal time value obtained by dividing time needed for sequential run with number of threads (2, 4, 8, 16 or 24).Number of Threads
5 10 15 20 25
E
ff
ic
ie
nc
y
0.90 0.92 0.94 0.96 0.98 1.00 1.02
Fig. 6. Relative overhead as a function of number of individuals within a generation
Although the Master has to wait for all individuals of a generation to be evaluated in order to resume the rest of the algorithm, the relative overhead influence do not increase with increasing number of threads, which can be seen in Figure 6. This behavior can be explained in a way that time required to execute sequential part of code is negligible compared to the part executed in parallel.
Times required for estimating parameters using different methods are given in Table 4. It can be seen that parallelization of GA solved the problem of relatively high parameter estimation duration, reducing estimation time to 3 minutes. PGA with 24 threads performs parameter estimation slightly longer than DLS, QN and SA, but with a better accuracy (Table 2). If the maximum number of threads is higher, duration of PGA would be even shorter.
DLS SA QN
PGA (24)
1 min 1.5 min 0.5 min 3 min
Table 4. Estimation duration
5. Conclusions
This paper presents a new method for estimating parameters of a model of thin filament regulation in solution. We have proposed Genetic Algorithm (GA) as a new method for estimating parameters and have compared it to deterministic methods, the Damped Least Squares (DLS), quasi-Newton (QN) and simulated annealing (SA). GA gives better results, and therefore better matching between the simulation and the experimental results. Even better matching of the simulation and experimental values could be reached if a larger population is used. In order to solve the performance issue, we proposed parallelization of Genetic Algorithm (PGA) within a single shared memory computing resource. With parallelization on 24 threads, we achieved execution time of GA, comparable to the time demands of other methods. With better hardware, executing time would be even shorter.
Generation Size
0 200 400 600 800 1000 1200
Rela
tive
ov
erh
ea
d
0.00 0.02 0.04 0.06 0.08 0.10
Acknowledgements:The part of this research is supported by Ministry of Science in Serbia, Grants III41007, OI174028 and TR37013, and FP7 ICT-2007-2-5.3 (224297) ARTreat project.
Извод
Естимација параметара модела регулације танког филамента у
раствору коришћењем генетских алгоритама
Б. Стојановић1*, М. Свичевић1, Ђ. Недић1, М. Ивановић1, С. М. Мијаиловић2,3
1Природно-математички факултет, Универзитет у Крагујевцу, Србија
[email protected], [email protected], [email protected], [email protected]
2 Tufts University, School of Medicine, Department of Medicine, MA 02135, USA,
3 Steward St. Elizabeth‘s Medical Center, Boston, MA 02135, USA,
[email protected] *Corresponding author
Резиме
Одређивање брзина хемијских реакција за било који нетривијалан модел је веома комплексно због нелинеарних ефеката хемијских реакција другог реда. Да би се остварио овај циљ, развијен је алгоритам заснован на генетским алгоритмима (ГА), а затим је ефикасност ове методе тестирана на McKillop–Geeves (MG) моделу регулације танког филамента. Ова метода је показала бољу тачност него детерминистичке методе, Damped Least Squares (DLS), quasi-Newton (QN) i Simulated Annealing (SA). Међутим, она захтева велики број евалуација потенцијалних решења што троши више процесорског времена. У овом раду је представљена платформа за дистрибуирану евалуацију различитих сетова параметара (т.ј. јединки у генетском алгоритму) на одређеном броју тредова на једном рачунару. Обављени тестови су показали да паралелизована евалуација обезбеђује значајно убрзање са бољом тачношћу и временом естимације упоредивим са детерминистичким методама.
Кључне речи: McKillop–Geeves, генетски алгоритми, естимација параметара, дистрибуирана евалуација
References
Boussouf, S.E., Agianian, B., Bullard, B., Geeves, M.A. (2007a). The regulation of myosin binding to actin filaments by Lethocerus troponin. J. Mol. Biol. 373 (3), 587–598.
Boussouf, S.E., Geeves, M.A. (2007). Tropomyosin and troponin cooperativity on the thin filament. Adv. Exp. Med. Biol. 592, 99–109.
Chen, Y., Yan, B., Chalovich, J.M., Brenner, B. (2001). Theoretical kinetic studies of models for binding myosin subfragment-1 to regulated actin: Hill model versus Geeves model. Biophys. J. 80 (5), 2338–2349.
Deb, K. and Agrawal, R. B. (1995) Simulated binary crossover for continuous search space. Complex Systems, 9 115–148.
Dennis Jr., J.E., Schnabel, R.B. (1983). Numerical Methods for Unconstrained Optimization and Nonlinear Equations. Prentice-Hall, Englewood Cliffs, NJ.
Farinha, J.P.S., Martinho, J.M.G., Pogliani, L. (1997). Non-linear least-squares and chemical kinetics. An improved method to analyse monomer–excimer decay data. J. Math. Chem. 21, 131–139.
Goldberg DE (1989). Genetic algorithms in search, optimization, and machine learning. Reading, MA: Addison-Wesley.
Hindmarsh, A.C. (1972). GEAR: Ordinary Differential Equation System Solver.
Holland JH., 1975. Adaptation in natural and artificial systems. Ann Arbor: University of Michigan Press.
Kirkpatrick, S., Gelatt Jr., C.D., Vecchi, M.P. (1983). Optimization by simulated annealing. Science 220 (4598), 671–680.
Lisy, J.M., Simon, P. (1998). Evaluation of parameters in nonlinear models by the least squares method. Comput. Chem. 22 (6), 509–513.
Maytum, R., Lehrer, S.S., Geeves, M.A. (1999). Cooperativity and switching within the three-state model of muscle regulation. Biochemistry 38 (3), 1102–1110.
McKillop, D.F., Geeves, M.A. (1993). Regulation of the interaction between actin and myosin subfragment 1: evidence for three states of the thin filament. Biophys. J. 65 (2), 693–701. Menke, W. (1989). In: Dmowska, R., Holton, J.R. (Eds.), Geophysical Data Analysis: Discrete
Inverse Theory. Academic Press, Inc., San Diego, CA.
Mijailovich S.M., Li X., Juan C. del Álamo, Griffiths R.H., Kecmand V., Geeves MA. (2010). Resolution and uniqueness of estimated parameters of a model of thin filament regulation in solution. Computational Biology and Chemistry 34 (2010) 19–33.
Mitchell, M. (1996). An introduction to genetic algorithms. MIT Press, Cambridge.
MSDN Library. How to: Use a Thread Pool (C# Programming Guide). [Online] Microsoft. http://msdn.microsoft.com/en-us/library/3dasc8as(v=VS.90).aspx.
Nocedal, J., Wright, S.J. (2006). Numerical Optimization. Springer, New York, NY.
Press, W.H., Flannery, B.P., Teukolsky, S.A., Vetterling, W.T. (1986). Numerical Recepies. The Art of Scientific Computing. Cambridge University Press, New York, NY.