Nitrogen Use Efficiency and Feed Conversion Efficiency of Lactating
Dairy Cows Grazing Simple and Diverse Pastures
A Dissertation
submitted in partial fulfilment
of the requirements for the Degree of
Bachelor of Agricultural Science with Honours
at
Lincoln University
by
Richard Cresswell Barry
Lincoln University
Abstract of a dissertation submitted in partial fulfilment of the
requirements for the Degree of Bachelor of Agricultural Science with Honours.
Abstract
Nitrogen Use Efficiency and Feed Conversion Efficiency of Lactating Dairy Cows
Grazing Simple and Diverse Pastures
by
Richard Cresswell Barry
Two experiments were conducted at the Lincoln University Research Dairy Farm from the 25th of
March to the 10th of April to examine whether NUE and FCE were affected by pasture type. In
experiment 1, 20 Holstein Friesian × Jersey cows were fed either a simple (S) pasture containing ryegrass and white clover, or a diverse (D) pasture containing ryegrass, white clover, lucerne,
plantain and chicory. Apparent intake and nutritive value of was determined and NUE was estimated using N intake and N excreted in milk. In experiment 2, 8 cows from experiment 1 were grazed individually on either S or D pastures. Energy intake was determined for each cow based on disappearance. FCE was estimated using heart rate (HR) to determine heat production (HP).
Differences in cow activity were recorded using activity monitoring ear tags to examine differences in energy expenditure.
Milk production and composition were unaffected by diet in experiment 1. There was a tendency for higher fat and protein yields (P<0.10), however this was not significant. Average milk yield ranged from 14 to 14.9 L/cow/day. Average N intake ranged from 510 to 541 g N/cow/day and was unaffected by pasture type (P>0.05). NUE was not affected by diet ranging from 21.4 to 22.7%. There was a tendency (P<0.10) for cows grazing the S pasture to excrete more N in milk, though this did not result in a higher NUE.
FCE in experiment 2 was not affected (P>0.05) by diet, and ranged from 0.37 to 0.46 MJ NE/MJ ME intake. ME intakes were similar (average 155 MJ ME/cow/day) and total NE retained averaged 56.7 MJ NE (milk and live weight gain). Cows grazing D pastures spent 417 mins/day ruminating compared with 383 mins/day for cows grazing S pastures (P=0.001). This difference was not reflected in their HR (average 82.5 beats/min) or estimated HP (80.3 MJ heat/cow/day) (P>0.05). Feeding D pastures that do not differ in their ME content or N content did not influence NUE or FCE of lactating dairy cows in this experiment.
Acknowledgements
Thanks must firstly be given to my supervisor, Dr. Racheal Bryant. Thank you for your support and advice. Your clear explanations and enthusiasm for the topic have been greatly appreciated.
To Carmen Teixeira. Thank you for your dedication and hard work during the running of the grazing trial. I hope you enjoyed your time working with me on the experiment and all the highs and lows that it entailed.
A big thank you must be given to all the staff at LURDF. Especially to Sarah Taylor and Helen Hague for their help with all aspects of running the trial. Even after a long day on the dairy farm you never failed to lighten the mood.
To all the friends I’ve made over my time here at Lincoln. Especially to Emma Petersen, Marie-Loiuse Barkema, Blair Hamill, Victoria Shaw, Isaac Martin, and Sam Anderson. We’ve shared some great times over the past few years and I look forward to seeing where our futures lead us.
A special thank you needs to go to Clay and Joy Paton for your continued support and advice this last year. Your monthly phone calls were always something to look forward to.
Thank you to my family; Mum, Micheal, Benji, Jim and Shumba. Thank you for your love, support and encouragement, particularly during this past year.
To Dad. Thank you for teaching me to appreciate the little things in this world and to make the most of every day. I’ve inherited your love for animals and hope you would be proud of my
accomplishments here at Lincoln.
Table of Contents
Abstract ... ii
Acknowledgements ... iii
Table of Contents ... iv
List of Tables ... vii
List of Figures ... ix
List of Plates ... xi
Chapter 1 Introduction ... 1
Chapter 2 Literature review ... 3
2.1 Introduction ...3
2.2 Pasture ...3
2.2.1 Nutritional Value ... 3
2.3 Milk production ...4
2.4 Nitrogen use efficiency ...6
2.4.1 Milk urea nitrogen ... 6
2.4.2 Nitrogen intake ... 7
2.5 Feed conversion efficiency...9
2.5.1 Diverse pastures ...11
2.5.2 Novel methods for predicting feed conversion efficiency ...13
2.6 Conclusions ... 16
2.7 Research objectives ... 17
Chapter 3 Materials and Methods ... 18
3.1 Experimental site and design ... 18
3.1.1 Management ...19
3.2 Measurements ... 19
3.2.1 Pasture mass ...19
3.2.2 Botanical composition and nutritive value ...21
3.2.3 Animal measurements ...22
3.3 Energy balance ... 24
3.3.1 Heat production calibration ...24
3.4 Animal activity... 25
3.4.1 Development of heart rate monitor harness ...25
3.4.2 Activity ear tags ...28
3.5 Statistical analysis ... 30
Chapter 4 Results ... 31
4.1 Climate ... 31
4.2 Experiment 1 ... 32
4.2.1 Pasture ...32
4.2.2 Animal ...35
4.2.3 Nitrogen use efficiency ...36
4.3 Experiment 2 ... 37
4.3.1 Pasture ...37
4.3.2 Animal ...38
4.3.3 Nitrogen use efficiency ...39
4.3.4 Feed conversion efficiency ...40
Chapter 5 Discussion ... 44
5.1 Experiment 1 ... 44
5.1.1 Herbage yield and composition ...44
5.1.2 Nutritive value ...45
5.1.3 Milk yield and composition ...46
5.1.4 Nitrogen use efficiency ...46
5.2 Experiment 2 ... 47
5.2.1 Nutritive value ...47
5.2.2 Milk yield and composition ...47
5.2.3 Nitrogen use efficiency ...48
5.2.4 Feed conversion efficiency ...49
5.3 Conclusions ... 51
5.4 Suggestions for further research ... 52
List of Tables
Table 2.1 Mean herbage characteristics (± SEM, n = 9) and chemical composition of simple and diverse pastures sampled to ground level (Edwards et al., 2015). ...4 Table 2.2 Milk production (kg/cow/day) from cows grazing diverse (DP) and simple (SP)
pastures over three years at Scott Farm in Hamilton (Woodward et al., 2013). ...5 Table 2.3 Mean milk yield and milk composition (n = 15) of dairy cows grazing simple and
diverse pastures. LSD = least significant difference (α = 0.05) (Edwards et al., 2015). ..5 Table 2.4 Nitrogen partitioning of dairy cows grazing simple (SP), high sugar (HS) and diverse
pastures (DP) at Lincoln University Dairy Farm, Canterbury; adapted from Totty et al.
(2013). ...9 Table 2.5 Maximum energetic efficiencies(K) of triglyceride (TG), protein and glycogen
synthesis from different substrates (Waghorn & Wolff, 1984). ... 10 Table 3.1 Plant species, cultivar and sowing rates of simple (SP) and diverse (DP) pasture
treatments at Lincoln University Research Dairy Farm, March to April 2015. ... 18 Table 4.1 Pre and post grazing herbage mass and height of simple and diverse pasture
treatments at Lincoln University Research Dairy Farm, March to April 2015. ... 32 Table 4.2 Average botanical composition of simple ryegrass-clover and diverse pastures
containing additional legumes and herbs offered (dry matter, DM %) as a proportion of the total pasture on offer above ground level (4 cm) at Lincoln University Research Dairy Farm, March to April 2015. ... 33 Table 4.3 Nutritive value offered (percentage of total dry weight, %) to cows grazing simple
ryegrass-clover pastures and diverse pastures containing additional herbs and legumes above grazing height (4 cm) at Lincoln University Research Dairy Farm, March to April 2015. ... 34 Table 4.4 Nutritive value of ingested diet of cows grazing simple ryegrass-clover pastures
compared with diverse pastures containing additional herbs and legumes for
experiment 1 at Lincoln University Research Dairy Farm, March to April 2015. ... 35 Table 4.5 Average metabolisable energy (ME) intake, milk yield composition and net energy in
milk for cows grazing simple and diverse pastures in experiment 1 (n= 5) at Lincoln University Research Dairy Farm, March to April 2015. ... 36 Table 4.6 Average nitrogen (N) intake, and nitrogen use efficiency of cows grazing simple and
Table 4.7 Nutritive value of ingested feed of cows with monitors in experiment 2 grazing simple ryegrass-clover pastures compared with diverse pastures containing additional herbs and legumes at Lincoln University, April 2015. ... 38 Table 4.8 Metabolisable energy (ME) intake and milk yield and composition for cows grazing
simple and diverse pastures in experiment 2 (n= 4) at Lincoln University Research Dairy Farm, April 2015. ... 39 Table 4.9 Nitrogen intake and nitrogen use efficiency of cows grazing simple and diverse
pastures in experiment 2 (n= 4) at Lincoln University Research Dairy Farm, April 2015. ... 40 Table 4.10 Grazing behaviour and energy balance of individually penned cows grazing simple
and diverse pastures (n= 16) at Lincoln University Research Dairy Farm, April 2015. 43 Table 5.1 Average heart rate for cows in experiment two with recordings above 20 hours
List of Figures
Figure 2.1 The relationship between milk urea nitrogen (mmol/L) and nitrogen use efficiency (g N milk/g N intake) of lactating dairy cows in New Zealand; NUE 0.32 - 0.007 ×
MUN(mmol/L) (R2= 0.64) (Aizimu et al., 2013). ...7
Figure 2.2 Relationship between nitrogen intake (g/d) and output (g/d) in faeces, milk, and urine using the relationships established feeding dairy cows forage diets varying in nitrogen content (Kebreab et al., 2002) ...8 Figure 2.3 Partition of feed energy during digestion illustration total heat production (Waghorn
et al., 2007). ... 11 Figure 2.4 Regression between annual ME intake (MJ ME/cow/year) and feed conversion
efficiency (g MS/MJ ME intake), (R2= 0.80, P< 0.05) in a three year dairy farm
monitoring trial conducted in the southern North Island, New Zealand (Salles et al., 2003). ... 12 Figure 2.5 Direct measurement of heart rate (HR; beats/min, ●) and O2 consumption (VO2; mL
min-1 per kg BW-0.75, □) and the calculated O
2 pulse (O2P. mL beat-1 per kg BW-0.75, ∆)
of 1 cow recorded at 5 s intervals, averaged every 60 s (Brosh et al., 2006). ... 14 Figure 2.6 Daily heart rate (HR; beats/min) pattern (per hour, h) of a single grazing cow
throughout 5 days; each line represents 1 day of recording measurement taken once every minute averaged over 5 minute intervals (Brosh et al., 2006). ... 14 Figure 2.7 Regression between annual milk solids production (kg/cow/year) and feed
conversion efficiency (g MS/MJ ME total intake by all cows) (R2= 0.15, P> 0.05) in a
three year dairy farm monitoring trial conducted in the southern North Island, New Zealand (Salles et al., 2003). ... 15 Figure 2.8 The relationship between heat production (per unit area) and heart rate (beats/min)
established for dairy cows grazing improved and unimproved pastures in New
Zealand (Hickey, 1960). ... 16 Figure 3.1 Linear regressions of pasture height and dry matter (DM) of simple pasture (F1)
treatment (R2= 0.760), at Lincoln University Research Dairy Farm, March to April
2015. ... 20 Figure 3.2 Linear regressions of pasture height and dry matter (DM) of diverse pasture (paddock
F5) treatment (R2= 0.819), at Lincoln University Research Dairy Farm, March to April
2015. ... 21 Figure 3.3 Regression of heat production expressed per square metre of cow surface area and
Figure 4.1 Total daily rainfall (solid blue) (mm) and daily air temperatures: maximum (red dash), mean (solid purple), and minimum (greed dotted) (°C) for the trial period 30th of March to 10th of April. Data obtained from Lincoln Broad Fields weather station (-43o63’N, 172o47’E), 1.5 km from trial site (NIWA, 2015). ... 31
Figure 4.2 Average (1 hour) daily heart rate pattern over 24 hours for cows grazing simple (orange) or diverse (blue) pastures; red arrow attach shows when monitors were attached, green arrows show milking times at Lincoln University Research Dairy Farm, April 2015. ... 41 Figure 4.3 Average dairy heart rate and average hourly ruminating time for cows grazing cover a
period of 24 hours for cows grazing simple (orange) or diverse (blue) pastures at Lincoln University Research Dairy Farm, April 2015. ... 41 Figure 4.4 Average daily grazing time (mins/hour) and heart rate for cows grazing simple
(orange) and diverse (blue) pasture diets at Lincoln University Research Dairy Farm, April 2015. ... 42 Figure 5.1 Regression for observed idle behaviour and reported behaviour for Cow Manager
Sensoor System from 11:00 am to 1:00 pm recorded at five minute intervals for four recording sessions at Lincoln University Research Dairy Farm (R² = 0.561). ... 53 Figure 5.2 Regression for observed rumination time and reported rumination time for Cow
Manager Sensoor System from 11:00 am to 1:00 pm recorded at five minute intervals for four recording sessions at Lincoln University Research Dairy Farm (R² = 0.825). . 53 Figure 5.3 Regression for observed grazing time and reported grazing time for Cow Manager
List of Plates
Plate 3.1 A site map of trial area used at the Lincoln University Research Dairy Farm, March to April 2015; diverse pasture paddocks F5 (orange) and simple pasture F2 (light green) indicates paddocks used in the adjustment phase, and diverse pasture paddock F6 (yellow) and simple pasture paddock F1 indicates trial period paddocks. ...19 Plate 3.2 Trial design for Experiment 2 with individual cow breaks (B1-4) for those cows with
heart rate monitors for days 5, 7, 9 and 11 which were used for monitoring of heart rate over 24 hours and grazing behaviour validation at Lincoln University Research Dairy Farm, March to April 2015. ...23 Plate 3.3 The Polar Equine heart rate monitoring system used for during the experiment at
Lincoln University Research Dairy Farm, left to right; Polar heart rate monitor,
personal computer, heart rate sensor and elastic harness strap. ...26 Plate 3.4 Initial design of HRM harness used until day 3rd of April (day 5) with all data excluded due to poor recording times at Lincoln University Research Dairy Farm, March to April 2015. ...27 Plate 3.5 The final design showing various stages of harness being constructed left to right;
final picture is full harness set up with yellow indicating position of heart rate sensor on the cow at Lincoln University Research Dairy Farm, April 2015. ...28 Plate 3.6 Location of the activated Cow Manager Sensoor System ear tag; orange tag
highlighted yellow at Lincoln University Research Dairy Farm, April 2015. ...29 Plate 3.7 Simple treatment cows (S), with the heart rate monitor harness attached in their
Chapter 1
Introduction
The New Zealand dairy industry generates $14 billion a year in export earnings and contributes roughly 7% of GDP to the economy (MPI, 2015). The industry is predominantly pasture based and owes its success to efficient, low-cost production. Indeed, maintaining profitability in farming is due to maintaining a high feed conversion efficiency (FCE), while environmental sustainability is affected by nitrogen use efficiency (NUE). Pastures generally comprise of a binary mix containing perennial ryegrass (Lolium perenne) and white clover (Trifolium repens) (Woodward et al., 2013). However, these pastures often have a crude protein (CP) content over 20% dry matter (DM) - far in excess of animal requirements (Waghorn et al., 2007).
The use of diverse (D) pastures containing multiple species and including herbs, has shown a change in the partitioning of dietary nitrogen (N). Nitrogen use efficiency (NUE) is an important indicator of production efficiency with an increase in NUE linked to an increase in profitability and a reduced environmental footprint (Powell et al., 2010). Reductions in the proportion of N excreted in urine from 43 to 29% have been reported in New Zealand when grazing D pastures (Woodward et al., 2012). This inherently leads to an improvement in NUE with an increase in the proportion of N found in milk. In addition to this, high levels of crude protein (CP) in the diet reduce NUE with an increasing proportion of the ingested N leaving the cow as urine (Kebreab et al., 2001).This imbalance has meant large volumes of N (up to 1000 kg N/ha in urine patches) are excreted by the animal, with urinary N (UN) being easily leached from the system (Di & Cameron, 2002). This loss of N from the system is not only an environmental cost, but also represents a loss in soil fertility. Using alternative species has been shown to improve NUE and reduce the level of N excreted by grazing animals having positive implications both economically and environmentally (Grainger & Goddard, 2004; Totty et al., 2013).
The excessive N supplied in the diet relative to requirements represents an energy cost to the animal and may reduce its FCE (Hickey, 1960). The cow must then catabolise and excrete this excess N causing an increase in energy expenditure (EE) and hence may reduce its FCE (Beever & Doyle, 2007). There is also evidence to suggest cow behaviour changes when grazing diets containing herbs (Gregorini et al., 2013).
Two possible mechanisms which may lead to an improved FCE are; the reduction in N intake – reducing heat production, and a change in cow behaviour, reducing EE. Accurately predicting FCE is still a major challenge with the use of heart rate (HR) to predict total EE offering a potential solution.
Chapter 2
Literature review
2.1
Introduction
The objectives of this literature review were; firstly, to examine whether pasture type affects milk production and nitrogen use efficiency (NUE), and secondly, to determine whether pasture type affects energy expenditure (EE) and feed conversion efficiency (FCE) of lactating dairy cows in late lactation. Techniques using HR to estimate EE and determine FCE are also discussed.
2.2
Pasture
2.2.1
Nutritional Value
Pasture quality generally refers to the pasture’s ability to support high animal production. This is largely associated with a high metabolisable energy (ME) content and adequate CP levels. Work by Nobilly et al. (2013) comparing simple (S) and D pastures reported similar CP levels over a two year trial under irrigation in Canterbury. CP content ranged from 196 g/kg DM to 261 g/kg DM and levels were generally higher in the autumn. ME content was higher in the S (12.2 MJ ME/kg DM) than in the D pasture (12.0 MJ ME/kg DM) and was likely due to the higher legume content of the S pasture. Neutral detergent fibre (NDF) levels were also greater in the S (368 g/kg DM) than in the D pasture (301 g/kg DM) for the duration of the trial. They also found water soluble carbohydrates (WSC) to be lower in the D (186 g/kg DM) than in the S pasture (206 g/kg DM) although this was only significantly different in the winter of 2011 (P<0.001).
Work conducted in Hamilton by Woodward et al. (2012) reported D pastures having a lower dry matter (DM) content compared with S pastures (D=15.9 vs. S=19.9%). In contrast to Nobilly et al.
(2013), CP content was lower in the D pasture (D=15.0% vs. S=18.6% of total DM) with NDF content of the D pasture also being lower (D= 31.7% vs. S=40.1% total DM). ME content was higher on the D (10.9 MJ.kg DM) than on the S pasture (10.2 MJ ME/kg DM) although ME intakes were similar due to the lower DM content of the D pasture (D=159 vs. S=161 MJ ME/cow/day).
Work by Edwards et al. (2015) during mid lactation found similar pasture quality and composition offered to cows on either S or D pasture treatments (Table 2.1). Chicory and plantain contributed 15% of the total DM on offer and legume contents in both pastures was high (>24%). This resulted in no difference in CP content offered, however CP intake was suggested to be higher on the S (228g CP/kg DM) than on the D pasture (192 g CP/kg DM) although no statistical analysis was carried out.
Table 2.1 Mean herbage characteristics (± SEM, n = 9) and chemical composition of simple and diverse pastures sampled to ground level (Edwards et al., 2015).
Treatment
Simple Diverse
Pre grazing
Compressed Sward height, cm 9.6 ± 1.4 10.5 ± 0.6
Herbage mass, kg DM/ha 3625 ± 555 3634 ± 152
Legume, % 28.6 ± 5.2 24.9 ± 5.1
Grass, % 58.4 ± 7.2 54.9 ± 7.2
Herb, % 0 ± 0 15.1 ± 3.9
CP, g/kg DM 186 ± 9.3 182 ± 9.7
WSC, g/kg DM 202 ± 19.5 217 ± 15.5
NDF, g/kg DM 381 ± 18.2 394 ± 13.2
ADF, g/kg DM 245 ± 7.2 245 ± 6.2
ME, MJ ME/kg DM 11.8 ± 0.1 12 ± 0.1
Post grazing
Compressed Sward height, cm 4.5 ± 0.3 5.6 ± 0.2
Herbage mass, kg DM/ha 1605 ± 251 1903 ± 119
CP, crude protein; WSC, water-soluble carbohydrates; NDF, neutral-detergent fibre; ADF, acid-detergent fibre; ME, metabolisable energy
In general, pasture quality seems to be similar for either S or D pastures. Differences in CP content seem to be accounted for by differences in sward legume content. Therefore, if legume contents are similar across the treatments N intakes are unlikely to be significantly different.
2.3
Milk production
D=11.8 MJ ME/kg DM). Reductions in MS yield were seen autumn of year 1 when DM intake, and therefore ME intake was lower (S=1.48 vs. D=1.47 kg MS/cow/day) (Table 2.2). Fat and protein composition of milk produced from the two pastures were also similar.
Table 2.2 Milk production (kg/cow/day) from cows grazing diverse (D) and simple (S) pastures over three years at Scott Farm in Hamilton (Woodward et al., 2013).
Year 1 (2010-11) Year 2 (2011-12) Year 3 (2012-13)
Spring Summer Autumn Spring Summer Autumn Spring Summer
D 18.6 11.6 9.6 18.6 15.4 12.0 23.0 18.2
S 19.7 11.6 8.1 18.6 15.0 12.2 22.4 18.4
SED 0.66 0.78 0.35 0.50 0.47 0.31 0.44 0.33
P value NS NS * NS NS NS NS NS
In contrast, Woodward et al. (2012) found similar fat levels (S= 5.34% vs. D= 5.33%) but higher protein levels for cows fed a D pasture (D=4.03% vs. S=3.84%). Milk yield and MS production was also greater for the D pasture (D=12.5 vs. S=11.3 kg/cow/day and D=1.16 vs. S=1.03 kg
MS/cow/day respectively) even though ME intakes were similar (D=159 vs. S= 161 MJ ME/cow/day). Work by Totty et al. (2013) also found similar ME intakes for cows grazing either S or D pastures (S= 172 vs. D= 178 MJ ME/cow/day), though MS yields were comparable (S= 1.55 vs. D=1.47kg MS/cow/day). However, the cows grazing a D pasture had an increased milk volume (16.9 kg/d) compared with those grazing the S pasture (15.2 kg/d) even though DM% of the pastures were not significantly different. Cows fed a D pasture also had a lower milk fat % (D=5.0% vs. S=6.1%), though, there was no difference in milk protein % (P>0.05). Recent work by Edwards et al. (2015) also found similar milk yield, milk composition and MS production when cows were grazing D or S
pastures in mid lactation (Table 2.3).
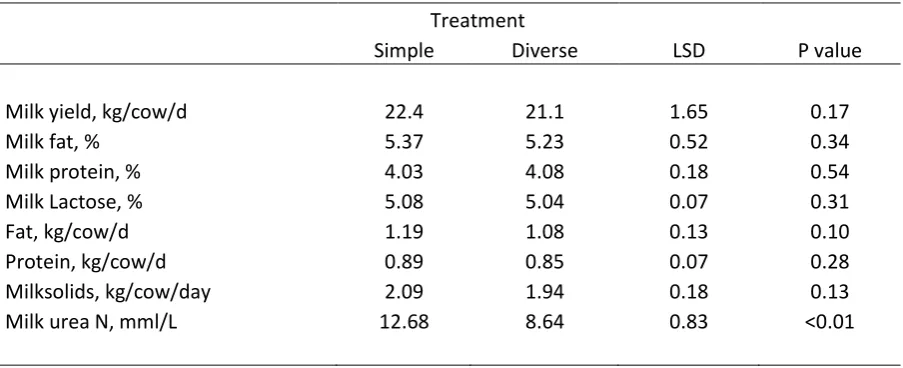
Table 2.3 Mean milk yield and milk composition (n = 15) of dairy cows grazing simple and diverse pastures. LSD = least significant difference (α = 0.05) (Edwards et al., 2015).
Treatment
Simple Diverse LSD P value
Milk yield, kg/cow/d 22.4 21.1 1.65 0.17
Milk fat, % 5.37 5.23 0.52 0.34
Milk protein, % 4.03 4.08 0.18 0.54
Milk Lactose, % 5.08 5.04 0.07 0.31
Fat, kg/cow/d 1.19 1.08 0.13 0.10
Protein, kg/cow/d 0.89 0.85 0.07 0.28
Milksolids, kg/cow/day 2.09 1.94 0.18 0.13
Milk urea N, mml/L 12.68 8.64 0.83 <0.01
However, reductions in MS production (S=1.48 vs. D=1.29 kg MS/cow/day, P<0.05) may be seen during spring due to CP levels limiting milk production in a D pasture at this time (Woodward et al., 2011), though this has not been reported elsewhere.
Given the findings from previous work, it would be expected that milk composition and MS production would be similar across the treatments provided pasture quality and therefore, ME intakes are similar. While differences in production have been noted in indoor work, field work has shown that, generally, productivity is comparable on either a S or D pasture.
2.4
Nitrogen use efficiency
NUE is a measure of the proportion of nitrogen (N) consumed which is utilised for milk production (Rius et al., 2010). However, measuring NUE in the grazing animal is difficult because it requires measuring total inputs and outputs of N in the system (Cheng L, 2010).
Improving NUE has important economic and environmental implications. Improving NUE leads to a reduction in the environmental impact of the dairy farming (Kebreab et al., 2001). A high NUE is indicative of lower N losses, thus there would be a reduced environmental burden due to reduction in N leaching (Woodward et al., 2011). Therefore, alternative methods for predicting NUE are required.
Woodward et al. (2011) has shown that the NUE of New Zealand dairy cows grazing pasture is generally low ranging from 18.5% to 22%. Pasture had an ME of 9.87MJ ME/kg DM and a CP of 15.2g/g DM. This suggests that approximately 80% of ingested nitrogen is either incorporated into tissue or lost to non-productive sources such as urine and faeces. Overseas work by Powell et al.
(2010) found a higher NUE, with values ranging from 16-36%. This is likely due to TMR diets providing adequate CP relative to the cow’s requirements; whereas pasture based systems have a high CP intake relative to requirements reducing their NUE (Woodward et al., 2011).
2.4.1
Milk urea nitrogen
Due to the difficulties that arise when predicting NUE in grazing animals other methods for
Figure 2.1 The relationship between milk urea nitrogen (mmol/L) and nitrogen use efficiency (g N milk/g N intake) of lactating dairy cows in New Zealand; NUE 0.32 - 0.007 ×
MUN(mmol/L) (R2= 0.64) (Aizimu et al., 2013).
In other work, Edwards et al. (2015) has shown how feeding of D pastures reduces MUN levels, suggesting an improvement in NUE. MUN levels were 12.68 mmol/L for cows grazing a S pasture compared with 8.64 mmol/L for cows grazing a D pasture. While N intakes were suggested to be higher on the S pasture, no statistical analysis was carried out. Using MUN levels may therefore, provide farmers with a blunt tool for estimating NUE with a high MUN level related to a low NUE.
2.4.2
Nitrogen intake
NUE is affected most by total N intake, with an increase in CP reducing NUE (Rius et al., 2010; Woodward et al., 2011). As N intake increases, the proportion lost through urine increases (Kebreab
et al., 2002). This is because lactating animals require approximately 18% CP in their diet to meet their requirements with New Zealand pastures typically having a CP content exceeding 20% (Pacheco & Waghorn, 2008). This exponential increase in UN output with increasing N intake is depicted in Figure 2.2 and shown to occur when N intake exceeds approximately 400g/day (Castillo et al., 2000). Therefore, feeding a diet lower in CP may be an effective measure to improving NUE without
Figure 2.2 Relationship between nitrogen intake (g/d) and output (g/d) in faeces, milk, and urine using the relationships established feeding dairy cows forage diets varying in nitrogen content (Kebreab et al., 2002)
Indoor metabolism work by Woodward et al. (2012) found the N content of D pastures was less than that of S pastures. D pastures contained a mix of perennial ryegrass, white clover, chicory (Cichorium intybus), plantain (Plantago lanceolate) and lucerne (Meticago sativa). CP content of the D pasture was 15.0% DM vs. 18.6% DM for the S diet. This meant N intake was significantly higher on the S (466 g N/cow/day) compared with the D pasture diet (350 g N/cow/day). An outdoor farmlet trial conducted by Woodward et al. (2013) also reported a lower CP levels in D compared with S pastures (S=19.9 vs. D=19.3%). This resulted in lower urinary N (UN) concentrations for cows fed a D diet compared with a S diet (0.26 vs. 0.62% respectively). In addition to this, urine volumes were similar even though the D pasture had lower DM (15.9 vs. 19.9%). This meant UN output from cows fed a D diet was 100 g N/cow/day compared to 200 g N/cow/day for cows fed the S pasture.
Research by Totty et al. (2013) also found CP content was lower in the D pasture. CP content ranged from 23.7 % DM for the D to 26.2 % DM for the S pasture. Although the CP content of the two pastures were different, N intakes were similar across treatments. This was probably due to selective grazing by the animals, whereas diet selection would have been limited in the indoor trial conducted by Woodward et al. (2012). In contrast, field work by Nobilly et al. (2013) found there was no difference in the CP content of S and D pastures. CP content in their experiment was higher, ranging from 195 to 261 g/kg DM, however, N intake not estimated.
A 10 day grazing trial conducted by Totty et al. (2013) using lactating dairy cows in late lactation also found a similar result. The findings of their study are presented in Table 2.4. They found UN excretion was lower from the cows fed a D diet an increased NUE. N content in urine was 0.34% on the D diet compared with 0.57% on the S pasture diet. Higher MP yields of cows grazing D pastures resulted in an improved NUE for milk for 20.4% from the cows fed a D pasture, compared
with 17.8 from cows fed a S pasture. The feeding of a D pasture led to an increased NUE due to an increase in the protein concentration in the milk.
Table 2.4 Nitrogen partitioning of dairy cows grazing simple (S), high sugar (HS) and diverse pastures (D) at Lincoln University Dairy Farm, Canterbury; adapted from Totty et al.
(2013).
Treatment
S HS D SEM P value
Plasma urea (mmol/L) 10.6a 10.7a 8.5b 0.21 <0.001
Creatinine (μmol/L) 58.6a 59.5a 53.4b 1.23 0.002
Urine N% 0.57a 0.58a 0.34b 0.02 <0.001
Urine NH3 (mmol/L) 0.66a 0.75a 0.36b 0.06 <0.001
Urine urea (mmol/L) 177.6a 180.4a 103.5b 6.63 <0.002
Urine creatinine (mmol/L) 1.2a 1.2a 0.88b 0.05 <0.003
N output (g/d) 438.3a 426.6a 353.8b 12 <0.004
Faeces N% 3.6a 3.4b 3.5a 0.04 0.001
Ash % 25.3a 26.5a 30.4b 0.47 <0.001
Faeces DM% 10.7 11.5 11.2 0.33 0.2
Milk urea N (mmol/L 11.4a 12.1b 9.5c 0.22 <0.001
N excretion (g/d) 104.8a 101.8a 112.1b 1.93 0.003
While all trials were conducted in late autumn, differences in CP content were probably due to a combination of factors including the pasture species present and their relative abundance. Climatic differences can also affect feed quality with the work by Totty et al. (2013) and Nobilly et al.
(2013) performed in Canterbury, while the trial by Woodward et al. (2012) was conducted in the warmer climate of Waikato. While N content of the pasture may be lower, selective grazing of legumes in a field environment is likely to reduce any difference in N intake.
2.5
Feed conversion efficiency
FCE is calculated as the NE deposited in milk and meat relative to the ME consumed (MJ). Improving efficiency by maximising the amount of milk produced from the feed grown is an important way to improve farm profitability with pasture being the cheapest (<0.05 c/kg DM) feed available (Smeaton
et al., 2008). However, FCE is difficult to measure in a grazed system as actual feed intake can only be estimated, limiting its accuracy (Salles et al., 2003). Previous work has shown there are a number of factors influencing FCE in dairy cattle including breed and genetic merit (Bryant et al., 2003; Grainger & Goddard, 2004). Efficiency with which energy is used is also determined by feed quality and composition, with the efficiency for LWG ranging from 0.20 when feeding straw, to 0.58 when feeding a high quality diet (Waghorn et al., 2007). Additionally, the efficiency of energy use for LWG
can only be estimated due different efficiencies of use for fat and protein deposition which depend on the substrate from which they are made (Table 2.5).
Table 2.5 Maximum energetic efficiencies (K) of triglyceride (TG), protein and glycogen synthesis from different substrates (Waghorn & Wolff, 1984).
Reaction
Efficiency of energy conservation (%)
Long chain fatty acids → TG 97
Acetate → TG 77
Amino acid → TG 65
Amino acid → protein (max K) 84
Proprionate storage as glycogen 88
Glucose storage as glycogen 97
Glucose → lactate → glucose 88
(Cori cycle)
Total heat production (EE) is a function of the inefficiency of converting ME to NE plus heat produced from maintenance (Figure 2.7) (Waghorn et al., 2007). Therefore, comparisons in EE can only be made if cows have a similar maintenance cost (LWT). Any differences in total HP after maintenance has been accounted for can then be assumed to be from different efficiencies with which the animal has converted ME consumed to NE.
Figure 2.3 Partition of feed energy during digestion illustration total heat production (Waghorn
et al., 2007).
2.5.1
Diverse pastures
One potential route to improving FCE is through the feeding of D pastures, either through an improved profile of fermentation products, or possibly through increased ease of grazing and reduced activity costs. The effects of D pastures on FCE are inconclusive, largely owing to the difficulty in determining DM, and therefore, ME intake under grazing conditions. Using data
presented by Woodward et al. (2012) looking at N losses, cows fed a D pasture diet had a FCE of 0.29 while those fed a S diet had a FCE of 0.26 (MJ NE/MJ ME intake), due to their higher MS production and ME intake. Work presented by Woodward et al. (2009) also looking at N losses found that feeding a diet comprising of 45% birdsfoot trefoil (Lotus corniculatus) improved FCE from 0.31 to 0.39 MJ NE/MJ ME than when feeding a S based diet. This suggests that the feeding of plants containing CT such as chicory and plantain may improve FCE. This may be due to an increase in protein adsorption in the small intestine, with CT protecting proteins from microbial degradation (Waghorn
et al., 2007). Work by (Totty et al., 2013) found similar a FCE, with cows fed a S pasture having a FCE of 0.36 compared to 0.31 for those cows grazing a D pasture respectively. Recent work by Edwards et al. (2015) looking at urination behaviour on S pastures found FCE to be higher on S pastures (0.47 MJ NE/MJ ME intake) compared with D pastures (0.41 MJ NE/MJ ME intake). This was due to a higher fat % and lower ME intake for those cows grazing the S pasture compared with those grazing a D
pasture. It seems that FCE whether grazing a S or D pasture is related to ME intake and milk production. In a three year farm monitoring trial Salles et al. (2003) highlighted the relationship between ME intake and FCE. They found that high levels of ME intake are positively associated with milk production, however a negative association exists between FCE and ME intake as shown in Figure 2.4 (R2= 0.80).
Figure 2.4 Regression between annual ME intake (MJ ME/cow/year) and feed conversion efficiency (g MS/MJ ME intake), (R2= 0.80, P< 0.05) in a three year dairy farm
monitoring trial conducted in the southern North Island, New Zealand (Salles et al., 2003).
This may be due to an excess in ME intake relative to that required for milk production, with energy likely being partitioned to live weight gain (LWG). However, in all of these studies LWG has not been accounted for, with energy being partitioned to LWG being an important consideration. Regardless, these findings show that up to 60% of ingested ME is either used for maintenance or wasted as heat. Therefore, given the potential benefits of increasing FCE more work looking at how D pastures may influence FCE is needed.
In the limited NZ work available, FCE values have not accounted for differences in EE or NE retained in body tissue. This is due to the difficulties associated with estimating energy costs in a pastoral system (Osuji, 1974). The energy cost associated with the excretion of excess nitrogen is also yet to be quantified on S or D pastures (Beever & Doyle, 2007). While this cost has not yet been quantified, feeding D pastures which tend to have a lower CP content may improve FCE. Behaviour work by Gregorini et al. (2013) also found significant differences in the activity (EE) of cows when grazing chicory, with cows spending similar amount of time grazing, and spending less time ruminating (20%). This was possible due to the faster outflow rate of chicory and the lower fibre content of such herbs.
The differing sward structure of D pasture may also allow for a larger bite size and intake rate when grazing D pastures leading to less time spend grazing (Dillon, 2007), although this was not reported by Gregorini et al. (2013). Osuji, (1974) estimated the energy cost of ruminating equivalent to only 1% of total expenditure compared to 36% for grazing in sheep. More recent work has estimated the EE associated with ruminating to be equivalent to 27% of the energy cost of eating using indirect calorimetry (Susenbeth et al., 1998). However, more work is needed to determine whether this difference in behaviour and EE may influence FCE for cows grazing a D pasture.
2.5.2
Novel methods for predicting feed conversion efficiency
Measuring heat production (HP) (or EE) is challenging in a field environment. This is due to the challenges that arrive around predicting ME intake of individual cows grazing in a mob and the different behavioural patterns exhibited by cows under different grazing environments (Gregorini et al., 2013). Traditionally, the use of calorimetry equipment has been needed to estimate EE based on the oxygen consumption of the grazing animal (Brosh, 2007). However, the use of indirect
calorimetry interferes with grazing behaviour and may then influence the animals predicted FCE. Because of this, other ways of predicting EE to estimate FCE are needed. Extensive work conducted by Brosh et al. (2010) has shown a relationship between heat production and HR after calibrating oxygen consumption with HR (R2= 0.66). In a recent US study by Arndt et al. (2015) cows with a
higher FCE (1.82 milk kg/kg DMI) produced 10% less heat than those with a lower FCE (1.03 milk kg/kg DMI). Therefore, if total EE can be predicted using a non-invasive method, then a more accurate measure of FCE may be determined and designing pasture diets with equivalent productivity but a lower HP may be an effective measure to improving FCE (Brosh et al., 2006). The close relationship between oxygen consumption (VO2),heart rate (HR), and oxygen pulse (O2P) is
Figure 2.5 Direct measurement of heart rate (HR; beats/min, ●) and O2 consumption (VO2; mL
min-1 per kg BW-0.75, □) and the calculated O
2 pulse (O2P. mL beat-1 per kg BW-0.75, ∆) of
1 cow recorded at 5 s intervals, averaged every 60 s (Brosh et al., 2006).
However, in order to estimate total EE using HR, measurements should be recorded over at least a 24 hour period to account for the diurnal variation in HR as shown by Brosh et al. (2006) using a single cow over a period of five days (Figure 2.5). This is mainly due to the daily patterns of feeding bouts that occur in a controlled farming environment (Brosh et al., 2006).
Figure 2.6 Daily heart rate (HR; beats/min) pattern (per hour, h) of a single grazing cow
throughout 5 days; each line represents 1 day of recording measurement taken once every minute averaged over 5 minute intervals (Brosh et al., 2006).
Other work by Purwanto et al. (1990) also found EE to be closely related to HR. In their study, greater milk yields were associated with an increased HR. Total daily HP ranged from 644 to 1,014 kJ/kg of BW−0.75/d−1. This finding agrees with that of Salles et al. (2003), who’s findings while not
significant (P>0.05), suggested a negative relationship between FCE and MS production (Figure 2.7). Removed due to copyright
This may be possibly be due to a diminishing return, with high ME intakes increasing MS production at a decreasing rate as energy is partitioned to other sources (LWG).
Figure 2.7 Regression between annual milk solids production (kg/cow/year) and feed conversion efficiency (g MS/MJ ME total intake by all cows) (R2= 0.15, P> 0.05) in a three year
dairy farm monitoring trial conducted in the southern North Island, New Zealand (Salles et al., 2003).
Early New Zealand work by Hickey (1960) found a very strong correlation (R2= 0.99) between
HP and HR once surface area (SA) was adjusted for using LWT (Figure 2.8). Their work suggested that grazing of pastures high in nitrogen reduced FCE due to the cost of digesting the excess dietary N increasing EE through an increased metabolic rate. Cows on an unimproved (low N) diet had a HR of 64.9 beats/min compared with 77.3 beats/min on the improved pasture during peak lactation. This resulted in an estimated 22 to 24% less heat production on the unimproved pasture. Therefore, Lowering the CP in the diet may reduce EE leaving more energy available for productive uses.
2.7
Research objectives
The objectives of this research trial were to:
Compare the milk yield and nitrogen use efficiency of cows grazing either simple or diverse
pastures.
Develop a heart rate harness to for use on dairy cows capable of reading heart rate for 24 hours.
Compare the behavioural patterns of cows grazing simple and diverse pastures.
Compare the feed conversion efficiency of cows grazing simple and diverse pastures by
determining energy expenditure and heat production.
Chapter 3
Materials and Methods
3.1
Experimental site and design
The trial was conducted between the 25th of March and 10th of April 2015 at the Lincoln University Research Dairy Farm (LURDF, 43°38'22.7"S 172°27'23.8"E; 10 m A.S.L.). The soil type is a Wakanui silt loam over sandy loam (LandcareResearch, 2015). There were two experiments conducted to address the following research questions: 1. Does pasture type affect milk production and NUE? 2. Does pasture type affect energy cost and FCE? To address question 1, animal measurements were carried out on a group of 10 animals grazing together among a larger mob of 20 animals in each treatment group using a completely randomised design. To address question 2, animal measurements were carried out on four randomly selected animals which were grazed separately using a randomised complete block design. Both treatments used the same pasture treatments: simple pasture (S) and diverse pasture (D). The D treatment was sown in perennial ryegrass, white clover, lucerne, plantain, chicory and S treatment sown in perennial ryegrass and white clover (4.1).
Table 3.1 Plant species, cultivar and sowing rates of simple (S) and diverse (D) pasture treatments at Lincoln University Research Dairy Farm, March to April 2015.
Species Common name Cultivar Sowing Rate (kg/ha) Treatment
Oct ‘13 Feb ‘15
Lolium perenne Perennial Ryegrass Arrow AR1 12 - S & D
Trifolium repens White Clover Weka 3 - S & D
Lolium multiflorum Italian Ryegrass Asset AR37 - 20 D
Medicago sativa Lucerne Torlesse 8 - D
Cichorium intybus Chicory Grouse 1.5 2 D
Plantago lanceolata Plantain Tonic 1.5 2 D
Plate 3.1 A site map of trial area used at the Lincoln University Research Dairy Farm, March to April 2015; diverse pasture paddocks F5 (orange) and simple pasture F2 (light green) indicates paddocks used in the adjustment phase, and diverse pasture paddock F6 (yellow) and simple pasture paddock F1 indicates trial period paddocks.
3.1.1
Management
A total of 40 lactating Holstein Friesian × Jersey cows were blocked according to; milk yield (1.29 ± 0.032 kg MS), live weight (541 ± 6.7 kg), age (6 ± 0.3 years), and days in milk (212 ± 3.7 days). Cows were adapted to experimental conditions over five days from the 25th of March to the 30th of March.
During both the adjustment phase, and trial period, cows were fed an allowance of 16 kg DM cow-1 day-1. The grazing area for each group was set using a height-mass calibration. Pasture height
of the pasture ahead of the cows was measured using an electronic rising-plate meter (Jenquip F150 Electronic Pasture Meter, Fielding, New Zealand). Pasture mass was then estimated using the calibration provided by the manufacturer: Pasture height (cm) ×280+500. From the 5th of April (day 7) until the end of the trial (day 12) the calibration for setting the paddock area of the D pasture was changed to: Pasture height (cm) × 260 + 200 as post grazing residuals were lower than the target 4 cm and in recognition of the lower bulk density of pasture mass in the D treatment.
Each group of cows received a new allocation daily which was given after returning from morning milking. All breaks were back-fenced so that only the allocated area could be grazed and every break had access to fresh water provided by a portable water trough.
3.2
Measurements
3.2.1
Pasture mass
A height-mass calibration was used to estimate pasture mass and was generated during the
detergent fibre (ADF), Metabolisable energy (MJ ME/kg DM) and carbohydrate percent. Metabolisable energy (MJ ME/kg DM) was calculated as DOMD × 0.16 (CSIRO, 2007).
The final subsample of approximately 100 g was taken to determine the pastures botanical composition. In the S treatment the sample was separated into perennial ryegrass, white clover, weed and dead plant material. The D treatment sample was separated into perennial ryegrass, white clover, lucerne, plantain, chicory, weed and dead material. Each component was then dried at 60oC
for at least 24 hours before its dry weight was determined.
3.2.3
Animal measurements
Experiment 1
All animal sampling procedures were approved by the Lincoln University Ethics committee. On day 1 and day 11 of the trial, the 10 cows selected from each treatment group were sampled for urine and faeces following the afternoon milking (PM), and following the morning milking the following day (AM) to get a sample corresponding to the day’s 24 hour pasture break allocation. Urine samples were collected by stimulating the vulva with the sample collected mid-stream. To prevent volatilisation samples were acidified to a pH less than 4 using sulfuric acid. Treated urine samples were then frozen at -20oC. Samples were thawed before being analysed for N%, ammonia N, urea-N and creatinine concentration (mmol/ L).
Faecal samples of approximately 250 ml were collected either through voluntary defecation or by stimulating defecation through rubbing of the rectal wall. After being collected, samples were frozen at -20oC. Samples were then thawed before being thoroughly mixed. Following this, a subsample of approximately 10 g was taken, weighed, and placed in a 100oC oven to be dried for at least 48 hours. Samples were then removed and weight to measure dry weight and determine DM%. A second faecal subsample of ̴10 g was taken and freeze dried before being passed through a 1 mm sieve (ZM200 rotor mill, Retsch Inc. Newtown, Pennsylvania, US). This subsample was analysed for dry matter N% by combustion using the Variomax CN Analyser; Elementar.
urea content with an automated Modular P analyser (Roche/Hitachi). The MUN was calculated as the molar concentration of milk urea multiplied by two. Total yield of fat, protein, lactose and MUN were determined by multiplying the percent by yield for the corresponding afternoon and morning milking session.
From the 25th of March till the 10th of April, live weight was measured twice every day after each milking using an automatic walk over weighbridge (DeLaval Alpro Herd Management system, Hamilton, New Zealand).
Experiment 2
Experiment 2 was carried out on days 5, 7, 9 and 11 of the trial. On these days, four randomly selected cows from each treatment in experiment 1 were used to measure energy cost and FCE for the purposes of experiment 2. Cows were separated into an individual pasture break for a period of 24 hours (Plate 3.2). Urine and faecal samples were taken on these days to determine an energy balance. Urine samples were collected following the same procedure outlined in experiment 1. Faecal samples were collected from each cow’s individual break, with a subsample from each dung patch being collected to fill a 250 ml container. Milk samples collected in experiment 1 for analysing milk composition were also used in experiment 2 for those cows being monitored. Analysis of milk, urine and faecal samples were done using the procedures outlined in experiment 1.
3.2.4
Animal intake
Cow apparent dry matter intake was estimated using the height mass calibration for each paddock. After the break size had been set, pasture height in the break was measured again using a rising plate meter. Post grazing height was measured after cows had moved to the next break. To determine intake in experiment 2, individual breaks were plated pre and post grazing to estimate individual intake. Intake per cow was calculated as pre graze herbage mass minus post grazed herbage mass divided by the number of cows per break:
(Pre graze HM (kg DM ha − 1) × area (ha))– (Post graze HM (kg DM ha − 1) × area (ha)) number of cows
3.3
Energy balance
NE in live weight gain (LWG) was assumed to by 19MJ/ kg gain based off the AFRC (1993) calculation for LWG. Net energy in milk was based off the AFRC (1993) calculation for NE in milk/kg milk and then adjusted for milk yield to get total NE produced in milk per day.
NEmilk
kg = (0.376 × fat%) + (0.209 × protein%) + 0.948
Feed conversion efficiency was calculated as the net energy in milk and estimated net energy in LWG (19MJ/kg gain; AFRC (1993)), divided by metabolisable energy (ME) intake.
FCE =NE(milk) + NE(LWG)
ME intake
3.3.1
Heat production calibration
Total heat production was estimated based on cow surface area (SA) determined by its live weight expressed in pounds derived from Hickey (1960).
SA = 0.096(w)0.56
Heat production (HP) was estimated using the relationship between heat production (Kcal/sq. m SA) and heart rate reported by Hickey (1960) (R² = 0.9907) (Figure 3.3).
Plate 3.3 The Polar Equine heart rate monitoring system used for during the experiment at Lincoln University Research Dairy Farm, left to right; Polar heart rate monitor, personal computer, heart rate sensor and elastic harness strap.
During the adjustment phase of the trial, cows were shaved using electric hand shears where the HR sensors would sit on the cows body (Plate 3.5). This was done to ensure a strong HR reading by the sensors. Over the Adjustment period various harness designs were trialled aiming to prolong the reading time of the monitor. Plate 3.4 shows the initial design used until day 5 of the trial.
Plate 3.4 Initial design of HRM harness used until day 3rd of April (day 5) with all data excluded due to poor recording times at Lincoln University Research Dairy Farm, March to April 2015.
Plate 3.5 The final design showing various stages of harness being constructed left to right; final picture is full harness set up with yellow indicating position of heart rate sensor on the cow at Lincoln University Research Dairy Farm, April 2015.
Cows that were selected for experiment 2 were fitted with the harness following morning milking before being returned to their individual pasture breaks. The harness was attached for a period of 24 hours, being removed the after the morning milking the following day. Monitors recorded the HR at either 1 or 5 second intervals (model, model respectively). Data was then processed with readings averaged per hour for the purposes of statistical analysis.
3.4.2
Activity ear tags
Plate 3.6 Location of the activated Cow Manager Sensoor System ear tag; orange tag highlighted yellow at Lincoln University Research Dairy Farm, April 2015.
For validation of the Cow Manager Sensoor System, visual grazing behaviour was recorded for those four cows in each treatment fitted with a HR monitor harness, separated into an individual pasture break (Plate 3.3). Grazing behaviour was recorded for a period of two hours (11:00am – 1:00pm) on days 5, 7, 9, and 11 of the experiment. Behaviour was recorded as either: idle,
Plate 3.7 Simple treatment cows (S), with the heart rate monitor harness attached in their individual breaks. The rest of simple herd can be seen in a separate break in distance; taken during grazing behaviour at Lincoln University Research Dairy Farm, April 2015.
Cow behaviour as minutes in every hour was then compared with the corresponding activity reported by Cow Manager to check for accuracy. A linear regression was plotted between observed and reported behaviour with the y-intercept set to zero. The accuracy of the ear tags were; idling (R2= 0.678), minutes ruminating (R2= 0.817) and minutes grazing (R2= 0.908) (Appendix 1).
3.5
Statistical analysis
All statistical analysis was carried out using Genstat 16 Ed. (VS.N International, 2014). Variables for metabolisable energy intake, pasture mass and nutritive value, milk production, milk composition, urine and faeces composition, cow activity, HR and cow activity were analysed. For comparison of the means, all standard error of differences (SED) have been calculated with a P<0.05 being
considered significant. In experiment 1, each cow’s data for urine and faeces was average over two experiment days, with milk data being averaged over 5 experiment days. One way ANOVA using randomized blocks, using experiment day as a random block was then performed. In experiment 2, milk urine and faeces data was averaged over 4 experimental days for each cow. Initially HR readings were analysed using a general linear model being blocked for a treatment and then a day effect to see if there was an effect of experiment day on HR (P<0.04). Activity data from Cow Manager was also analysed using a one way ANOVA in randomized blocks. Given the low number of HR readings (8 from each group), HR was then grouped across experiment day and a one-way ANOVA was
4.2
Experiment 1
4.2.1
Pasture
The average pre and post grazing pasture mass of the pastures over the course of the experiment is shown in Table 4.1. Pre grazing pasture height was greater in the D pasture than in the S pasture (P= 0.007). There was no difference in post grazing pasture height. There was no significant difference for post grazing height or pre and post grazing pasture masses for the two treatments.
Table 4.1 Pre and post grazing herbage mass and height of simple and diverse pasture treatments at Lincoln University Research Dairy Farm, March to April 2015.
Treatment
Simple Diverse SEM P value
Pasture height (pre), cm 7.95 9.68 0.411 0.007
Pasture height (post), cm 4.06 4.08 0.229 NS
Pasture mass (pre), kg DM/ha 2092 2030 137.5 NS
Pasture mass (post), kg DM/ha 805 714 76.8 NS
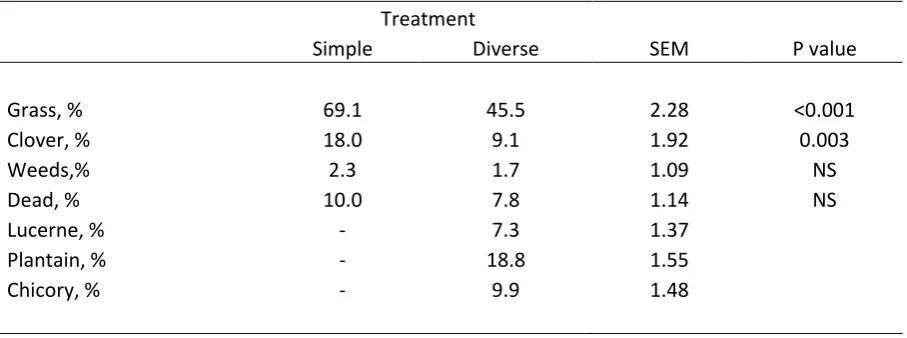
Table 4.2 Average botanical composition of simple ryegrass-clover and diverse pastures
containing additional legumes and herbs offered (dry matter, DM %) as a proportion of the total pasture on offer above ground level (4 cm) at Lincoln University Research Dairy Farm, March to April 2015.
Treatment
Simple Diverse SEM P value
Grass, % 69.1 45.5 2.28 <0.001
Clover, % 18.0 9.1 1.92 0.003
Weeds,% 2.3 1.7 1.09 NS
Dead, % 10.0 7.8 1.14 NS
Lucerne, % - 7.3 1.37
Plantain, % - 18.8 1.55
Chicory, % - 9.9 1.48
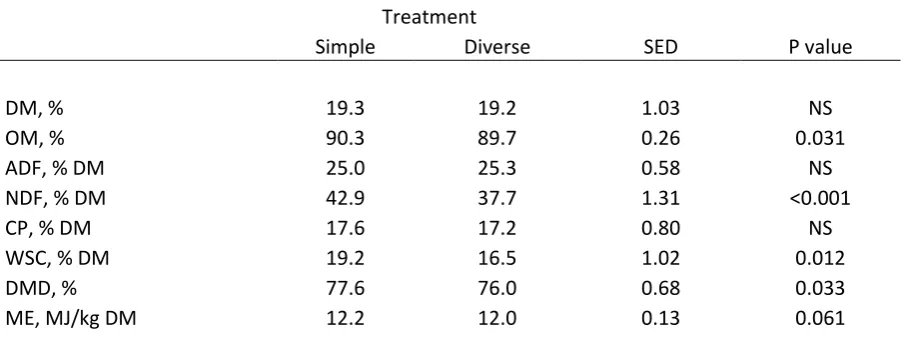
The nutritive value of the two pasture treatments is shown in Table 4.3. The quality of herbage on offer was determined to 4 cm. There was no significant difference between the two treatments in their dry matter (DM) percent (P> 0.05). Organic matter (OM) offered was higher in the S treatment (90.3%), than in the D pasture (89.7) (P= 0.031). The proportion of acid detergent fibre (ADF) was not significantly different for either treatment averaging 25.2% of the dry matter on offer (P> 0.05). Neutral detergent fibre (NDF) of the dry matter was higher in the S pasture (42.9%) than in the D pasture treatment (37.7%) (P< 0.001). Crude protein content of both pastures was similar, averaging 17.4% (P> 0.05). The proportion of water soluble carbohydrates (WSC) on offer was higher in the S treatment (19.2%) compared with the D treatment (16.5%) (P= 0.012). Dry matter
digestibility (DMD) was higher for the S treatment (77.6%) than for the D treatment (76.0%)
(P=0.033). Metabolisable energy content of the dry matter tended to be higher in the S pasture (12.2 MJ ME/kg DM) than in the D pasture (12.0 MJ ME/kg DM), however this difference was not
Table 4.3 Nutritive value offered (percentage of total dry weight, %) to cows grazing simple ryegrass-clover pastures and diverse pastures containing additional herbs and legumes above grazing height (4 cm) at Lincoln University Research Dairy Farm, March to April 2015.
Treatment
Simple Diverse SED P value
DM, % 19.3 19.2 1.03 NS
OM, % 90.3 89.7 0.26 0.031
ADF, % DM 25.0 25.3 0.58 NS
NDF, % DM 42.9 37.7 1.31 <0.001
CP, % DM 17.6 17.2 0.80 NS
WSC, % DM 19.2 16.5 1.02 0.012
DMD, % 77.6 76.0 0.68 0.033
ME, MJ/kg DM 12.2 12.0 0.13 0.061
DM=dry matter, OM=Organic matter, ADF=acid detergent fibre, NDF, neutral detergent fibre, CP=crude protein, WSC=water soluble carbohydrate, DMD=dry matter digestibility,
ME=metabolisable energy.
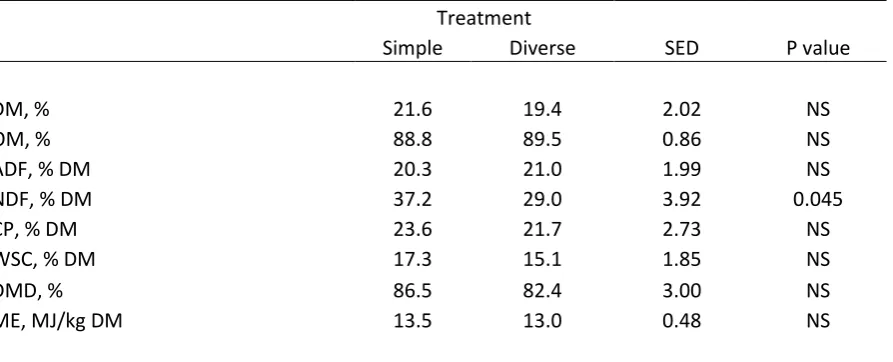
Table 4.4 Nutritive value of ingested diet of cows grazing simple ryegrass-clover pastures compared with diverse pastures containing additional herbs and legumes for experiment 1 at Lincoln University Research Dairy Farm, March to April 2015.
Treatment
Simple Diverse SED P value
DM, % 21.6 19.4 2.02 NS
OM, % 88.8 89.5 0.86 NS
ADF, % DM 20.3 21.0 1.99 NS
NDF, % DM 37.2 29.0 3.92 0.045
CP, % DM 23.6 21.7 2.73 NS
WSC, % DM 17.3 15.1 1.85 NS
DMD, % 86.5 82.4 3.00 NS
ME, MJ/kg DM 13.5 13.0 0.48 NS
DM=dry matter, OM=Organic matter, ADF=acid detergent fibre, NDF, neutral detergent fibre, CP=crude protein, WSC=water soluble carbohydrate, DMD=dry matter digestibility,
ME=metabolisable energy.
4.2.2
Animal
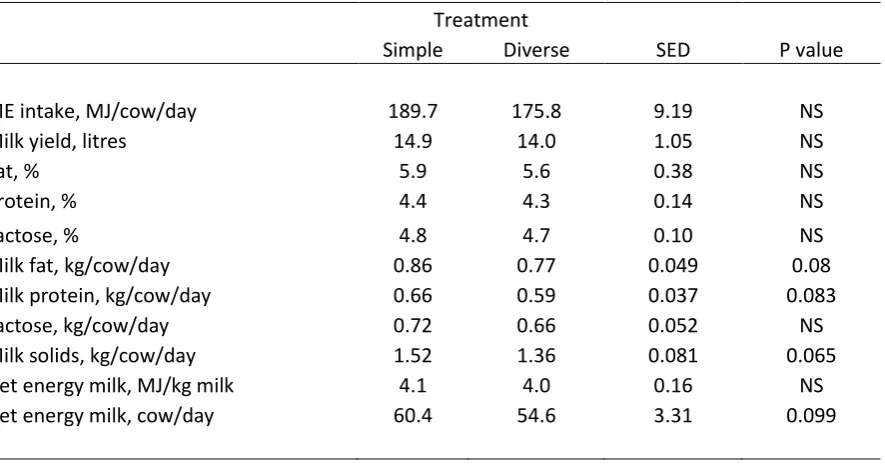
Table 4.5 Average metabolisable energy (ME) intake, milk yield composition and net energy in milk for cows grazing simple and diverse pastures in experiment 1 (n= 5) at Lincoln University Research Dairy Farm, March to April 2015.
Treatment
Simple Diverse SED P value
ME intake, MJ/cow/day 189.7 175.8 9.19 NS
Milk yield, litres 14.9 14.0 1.05 NS
Fat, % 5.9 5.6 0.38 NS
Protein, % 4.4 4.3 0.14 NS
Lactose, % 4.8 4.7 0.10 NS
Milk fat, kg/cow/day 0.86 0.77 0.049 0.08
Milk protein, kg/cow/day 0.66 0.59 0.037 0.083
Lactose, kg/cow/day 0.72 0.66 0.052 NS
Milk solids, kg/cow/day 1.52 1.36 0.081 0.065
Net energy milk, MJ/kg milk 4.1 4.0 0.16 NS
Net energy milk, cow/day 60.4 54.6 3.31 0.099
ME=metabolisable energy.
4.2.3
Nitrogen use efficiency
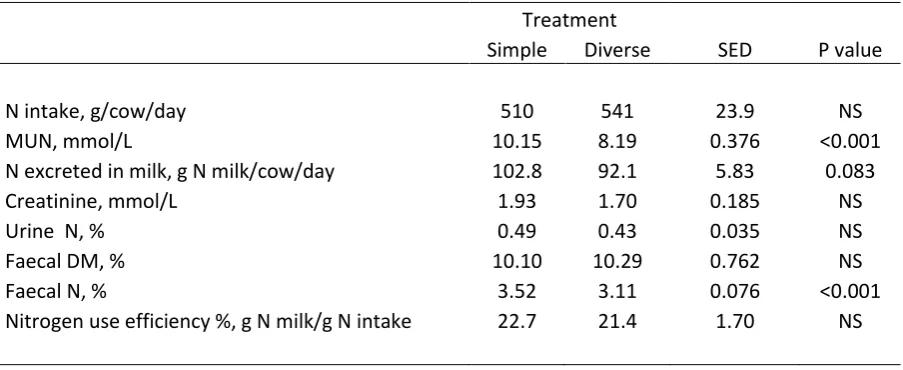
Partitioning of nitrogen for cows in the experiment is shown in Table 4.6. Forage nitrogen intake was not significantly different (P> 0.05) for cows grazing either a S or D pasture. Cows grazing the S pasture had a higher (P< 0.001) milk urea nitrogen (MUN) content (10.15 mmol/L) than cows grazing the D pasture (8.19 mmol/L). Total nitrogen excreted in milk tended to be higher (P= 0.083) for those cows grazing the S pasture (102.8 g/day) compared with cows grazing the D pasture (92.1
Table 4.6 Average nitrogen (N) intake, and nitrogen use efficiency of cows grazing simple and diverse pastures in experiment 1 (dung and faecal n=2; N in milk, MUN n=12) at Lincoln University Research Dairy Farm, March to April 2015.
Treatment
Simple Diverse SED P value
N intake, g/cow/day 510 541 23.9 NS
MUN, mmol/L 10.15 8.19 0.376 <0.001
N excreted in milk, g N milk/cow/day 102.8 92.1 5.83 0.083
Creatinine, mmol/L 1.93 1.70 0.185 NS
Urine N, % 0.49 0.43 0.035 NS
Faecal DM, % 10.10 10.29 0.762 NS
Faecal N, % 3.52 3.11 0.076 <0.001
Nitrogen use efficiency %, g N milk/g N intake 22.7 21.4 1.70 NS
N=nitrogen, MUN=milk urea nitrogen.
4.3
Experiment 2
4.3.1
Pasture
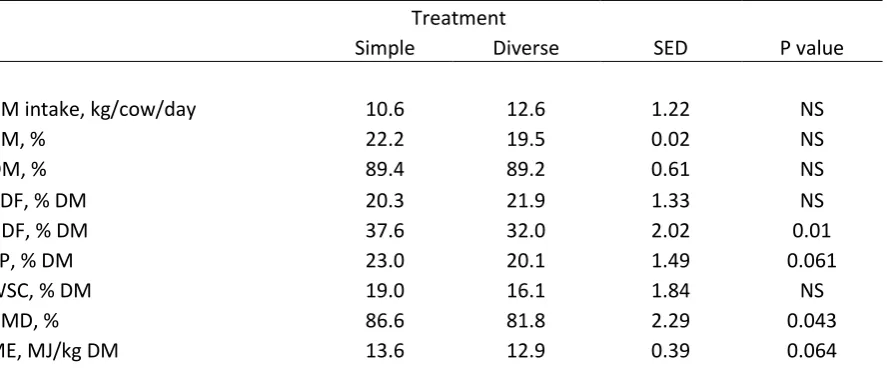
Table 4.7 Nutritive value of ingested feed of cows with monitors in experiment 2 grazing simple ryegrass-clover pastures compared with diverse pastures containing additional herbs and legumes at Lincoln University, April 2015.
Treatment
Simple Diverse SED P value
DM intake, kg/cow/day 10.6 12.6 1.22 NS
DM, % 22.2 19.5 0.02 NS
OM, % 89.4 89.2 0.61 NS
ADF, % DM 20.3 21.9 1.33 NS
NDF, % DM 37.6 32.0 2.02 0.01
CP, % DM 23.0 20.1 1.49 0.061
WSC, % DM 19.0 16.1 1.84 NS
DMD, % 86.6 81.8 2.29 0.043
ME, MJ/kg DM 13.6 12.9 0.39 0.064
DM=dry matter, OM=Organic matter, ADF=acid detergent fibre, NDF, neutral detergent fibre, CP=crude protein, WSC=water soluble carbohydrate, DMD=dry matter digestibility,
ME=metabolisable energy.
4.3.2
Animal
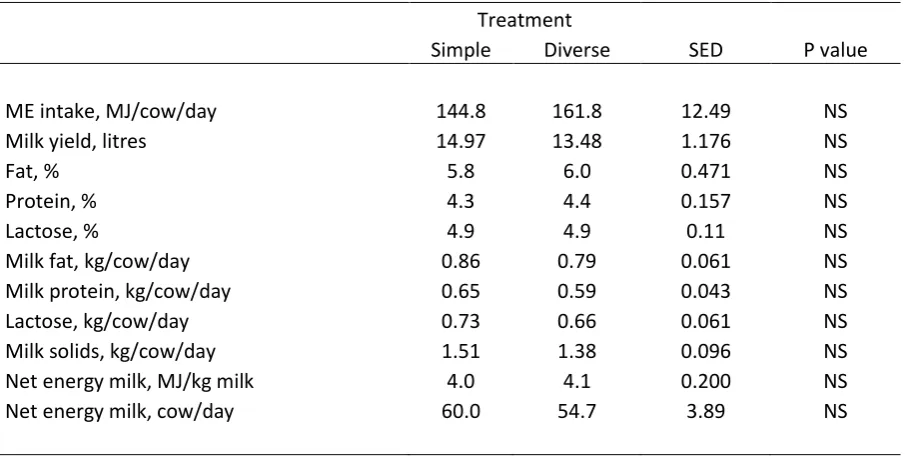
Table 4.8 Metabolisable energy (ME) intake and milk yield and composition for cows grazing simple and diverse pastures in experiment 2 (n= 4) at Lincoln University Research Dairy Farm, April 2015.
Treatment
Simple Diverse SED P value
ME intake, MJ/cow/day 144.8 161.8 12.49 NS
Milk yield, litres 14.97 13.48 1.176 NS
Fat, % 5.8 6.0 0.471 NS
Protein, % 4.3 4.4 0.157 NS
Lactose, % 4.9 4.9 0.11 NS
Milk fat, kg/cow/day 0.86 0.79 0.061 NS
Milk protein, kg/cow/day 0.65 0.59 0.043 NS
Lactose, kg/cow/day 0.73 0.66 0.061 NS
Milk solids, kg/cow/day 1.51 1.38 0.096 NS
Net energy milk, MJ/kg milk 4.0 4.1 0.200 NS
Net energy milk, cow/day 60.0 54.7 3.89 NS
ME=metabolisable energy.
4.3.3
Nitrogen use efficiency
Nitrogen partitioning for cows used in experiment two is shown in Table 4.9. Forage nitrogen intake (N) was not affected by pasture treatment (P>0.05). Milk urea nitrogen was higher (P= 0.01) for cows grazing the S pasture than those grazing the D pasture. Nitrogen excreted in milk was not
Table 4.9 Nitrogen intake and nitrogen use efficiency of cows grazing simple and diverse pastures in experiment 2 (n= 4) at Lincoln University Research Dairy Farm, April 2015.
Treatment
Simple Diverse SED P value
N intake, g/cow/day 410 414 58.0 NS
MUN, mmol/L 9.54 7.86 0.562 0.01
N excreted in milk, g N milk/cow/day 101.8 92.7 6.77 NS
Creatinine, mmol/L 2.25 1.85 0.284 NS
Urine N, % 0.58 0.39 0.047 0.001
Faecal DM, % 9.30 9.91 0.585 NS
Faecal N, % 3.35 3.14 0.069 0.009
Nitrogen use efficiency %, g N milk/g N intake 29.7 26.4 3.74 NS
N=nitrogen, MUN=milk urea nitrogen.
4.3.4
Feed conversion efficiency
Metabolisable energy intake was similar (P >0.05) for both treatments (Table 4.8). There was no significant difference in milk solids production (P >0.05). Both live weight and live weight change over the course of the experiment were not significantly different (Table 4.10).
Table 4.10 Grazing behaviour and energy balance of individually penned cows grazing simple and diverse pastures (n= 16) at Lincoln University Research Dairy Farm, April 2015.
Treatment
Simple Diverse SED P value
ME intake, MJ/cow/day 146 164 27.0 NS
N intake, g/cow/day 435 469 109.4 NS
MS, kg/cow/day 1.49 1.29 0.117 NS
Net energy milk, MJ/kg 3.91 4.13 0.232 NS
Net energy milk, cow/day 59.3 50.9 4.64 0.091
Live weight, kg/cow 534 521 19.1 NS
Live weight change, kg/cow/day 0.85 1.14 0.465 NS
NE in LWG, cow/day 1.34 1.81 0.732 NS
Total NE (milk and gain), MJ NE/cow/day 60.7 52.7 4.53 NS
FCE (MJ NE retained/MJ ME eaten 0.47 0.37 0.092 NS
Daily mins grazing, cow/day 583 583 21.7 NS
Daily mins ruminating, cow/day 383 417 15.1 0.039
Daily mins idle, cow/day 352 338 20.4 NS
Daily mins active, cow/day 80 66 15.01 NS
Daily mins high activity, cow/day 55 49 7.32 NS
Heartrate, Beats/min/day 82.2 82.8 2.62 NS
Total heat production, MJ cow/day 80.58 79.97 1.659 NS