Predicting fleece weight from the difference in live weight pre- and post-shearing
JM Galweya, CM Logan, AC Bywater and AW Greer*
Faculty of Agriculture and Life Sciences, P.O. Box 85084, Lincoln University 7647, Christchurch; aANZCO Foods Limited, 62C Dobson Street, PO Box 24, Ashburton 7740
*Corresponding author. Email: [email protected]
Abstract
Radio frequency identification (RFID) and automated weighing platforms facilitate the practicality and ease with which individual live weight (LW) can be recorded. This raises the possibility for the difference in recorded LW of sheep between pre- and post-shearing to provide an estimate of fleece weight (eFW) which, in turn, could allow selection pressure to be applied for improved wool production. The eFW of yearling ewes (n=98), yearling rams (n=274) and mixed-age ewes (n=305) were compared with their recorded fleece weight (FW). Positive linear correlations (P<0.001 for all stock classes) were observed between eFW and FW and also the eFW rank and FW rank. Although some variability between stock classes existed, for all data combined, FW rank was able to account for 42% of the variation in eFW rank. Further, selecting individuals on eFW was able to retain an average of 64% of the selection differential obtained using recorded FW. Overall, these results suggest eFW calculated from the difference in LW between pre- and post-shearing, in combination with RFID and automated weighing platforms, may provide a useful and practical tool to assist with selection for improved wool production in a commercial setting.
Keywords: Fleece weight; live weight; radio-frequency identification; selection
Introduction
Wool is an important revenue stream for many New Zealand sheep farmers. Selection of animals for improved wool production has many advantages in that it is a trait which is highly heritable and also repeatable throughout an animal’s lifetime (Ryder & Stephenson 1968; Hawker & Littlejohn 1986; Hawker et al. 1988; Sumner et al. 2007). To date, much of the genetic progress for improved wool production in commercial enterprises relies on the estimated breeding values for fleece weight from sires, with little consideration given to the capacity for wool production in replacement stock. In part, this is due to the impracticality of weighing and recording fleeces of individual animals in a commercial setting. Thus, developing techniques for evaluating the fleece weight of maternal stock that are practical for commercial farming systems may provide an opportunity to enhance the identification and selection of animals to improve wool production.
Wool contributes to the measured live weight of an animal. Therefore, it can be expected the difference in recorded live weight between pre- and post-shearing will reflect the fleece weight of any particular individual. The ability to measure an individual’s live weight has been greatly enhanced in recent years with the advent of radio frequency identification (RFID) and automated weighing platforms. Here we evaluate utilizing the difference in recorded animal live weight between pre- and post-shearing to estimate the fleece weight of individual sheep to aid selection decisions for improved wool production.
Materials and methods
General methodology
Recorded fleece weight (FW) of individual Coopworth sheep were compared with their estimated fleece weight (eFW) calculated from the difference between their pre- and post-shearing live weights. A total of 677 FW and eFW recordings were collected from animals of different classes with only one class of animal investigated at each time. Yearling ewes (n=98) were shorn with eight months of wool growth in October 2012. Yearling rams were shorn with five months of wool growth in July 2012 (n=142) and with six months of wool growth in August 2013 (n=132). Mixed-age (MA) ewes were shorn with six months of wool growth in May 2012 (n=305).
Weighing protocol
conclusion of their respective shearing run. All yearling ewes were shorn within a period of one hour, yearling rams were shorn within a period of six hours in 2012 and four hours in 2013 and MA ewes were shorn within four hours. The time of weighing for each pre- and post-shearing weight was recorded. No effort was made to influence the order in which animals were weighed. Post-shearing live weight was subtracted from pre-shearing live weight to provide eFW. Recorded FW, excluding oddments, for each individual was collected at the time of shearing and weighed to a sensitivity of 0.02 kg. The relationship between FW and eFW and the selection differential achieved if animal selection was performed using either FW or eFW was compared.
Statistical analysis
For yearling rams, data for 2012 and 2013 was analyzed both separately and combined. Correlations between FW and eFW for each class of animal and for all animals combined were calculated using the linear regression model in Minitab (Version 16, Minitab Inc 2010). The interval between pre- and post-shearing live weight recordings was found to have no effect on the observed relationships and was subsequently removed from the analysis. Animals were ranked from heaviest (1) to lightest (n) for both recorded FW and for eFW within respective stock classes and combinations. Spearman’s rank correlations between FW rank and eFW rank were performed using GenStat (Thirteenth Edition, VSN International Ltd 2010). Selection differentials were calculated from the difference between the mean FW of the initial population and the mean FW of the selected population when the top 10%, 20%, 25%, 30%, 40%, 50%, 60%, 70%, 75%, 80% and 90% of animals were selected using either FW or eFW and were regressed against each other as described above.
Results
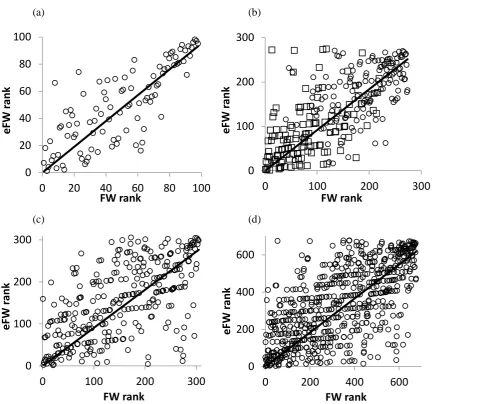
For all classes and combinations, FW and eFW demonstrated a positive linear correlation (P<0.001). Overall, eFW was able to account for 36% of the variation (r2) in FW, although this varied between stock classes, being 60% for yearling ewes, 22% for yearling rams in 2012, 21% for yearling rams in 2013, 40% for yearling rams in 2012+2013 combined and 35% for MA ewes. The relationship between FW rank and eFW rank for all stock classes is given in Figure 1. The correlation co-efficient (r2) between FW rank and eFW rank was 42%, 64%, 27%, 31%, 49% and 39% for all data combined, yearling ewes, yearling rams in 2012, yearling rams in 2013, yearling rams in 2012+2013 combined and MA ewes, respectively, (P<0.001 for all).
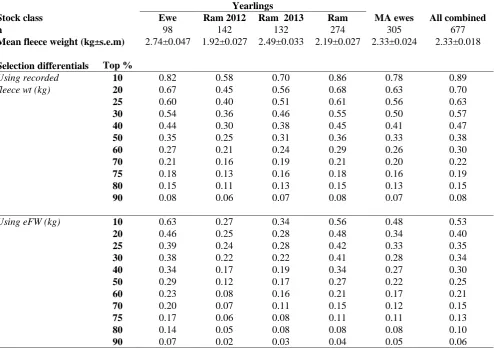
Mean FW and the selection differential for FW when the top 10%, 20%, 25%, 30%, 40%, 50%, 60%, 70%, 75%, 80% and 90% of individuals were selected based on either recorded FW or eFW for each stock class and combinations are shown in Table 1. The
selection differentials calculated for each increment of selection pressure between FW and eFW for each stock class and combination demonstrated a positive linear correlation (P<0.001 for all). Correlation coefficients (r2) between the selection differentials observed using either FW or eFW were 99% for all animals combined, 97% for yearling ewes, 95% for yearling rams in 2012, 98% for yearling rams in 2013, 98% for yearling rams in 2012+2013 combined and 99% for MA ewes. The proportion of the selection differential using recorded FW that was able to be achieved using eFW was greatest when the top 75% of yearling ewes were selected, being 0.96, and least when the top 90% of yearling rams in 2012 were selected, being 0.36. Overall, the mean proportion of potential selection differential able to be achieved using eFW was 0.64 for all data combined, 0.82 for yearling ewes 0.48 for yearling rams in 2012, 0.54 for yearling rams in 2013, 0.67 for yearling rams in 2012+2013 combined and 0.62 for MA ewes.
Discussion
(a) (b)
(c) (d)
Figure 1 Rank (1 = heaviest) of recorded fleece weight (FW) in relation to rank of estimated fleece weight (eFW) calculated from the difference in recorded live weight between pre- and post-shearing for (a) yearling ewes, (b) yearling rams in 2012 (circles) and 2013 (squares), (c) mixed-age ewes, (d) all data combined. Linear regression equations when the x intercept is set to 0 are y = 0.95x (r2 = 0.61) for yearling ewes, y = 0.88x (r2 = 0.10) for 2012 yearling rams (line not shown), y = 0.89x (r2 = 0.15) for 2013 yearling rams (line not shown), y = 0.93x (r2 = 0.42) for 2102+2013 yearling rams combined, y = 0.91x (r2 = 0.28) for mixed-age ewes and y = 0.91x (r2 = 0.33) for all data combined.
0
20
40
60
80
100
0
20
40
60
80
100
e
FW
r
an
k
FW rank
0
100
200
300
0
100
200
300
eF
W
r
an
k
FW rank
0
100
200
300
0
100
200
300
e
FW
r
an
k
FW rank
0
200
400
600
0
200
400
600
e
FW
r
an
k
FW rank
although the latter can be expected to be minimized by fasting (Galwey et al. 2013). As some of the measurement error may be fixed, it is possible it could have had a large influence on the variation between eFW and FW observed in the current study due to the relatively low mean FWs of between 1.92 kg and 2.74 kg. It seems worthy of further investigation to determine if the variation between eFW and FW is reduced in populations with a greater FW and in which the fixed errors would be expected to be proportionately less. Nevertheless, for the current study the fact that, for all data combined, FW was able to account for 35% of the variation in eFW and 42% of the variation in eFW rank, indicates that the difference between pre- and post-shearing live weight can provide an a useful estimate of wool production for an individual.
Table 1: Mean fleece weight (FW) of the initial population and the potential selection differential when the top 10% to 90% of animals are selected based on either recorded FW or estimated fleece weight (eFW) calculated from the difference in recorded live weight between pre- and post-shearing for yearling ewes, yearling rams in 2012, yearling rams in 2013, yearling rams in 2012+2013 combined, mixed-age (MA) ewes and all data combined.
Yearlings
Stock class Ewe Ram 2012 Ram 2013 Ram 2012+2013
MA ewes All combined
n 98 142 132 274 305 677
Mean fleece weight (kg±s.e.m) 2.74±0.047 1.92±0.027 2.49±0.033 2.19±0.027 2.33±0.024 2.33±0.018
Selection differentials Top % selected
Using recorded 10 0.82 0.58 0.70 0.86 0.78 0.89
fleece wt (kg) 20 0.67 0.45 0.56 0.68 0.63 0.70
25 0.60 0.40 0.51 0.61 0.56 0.63
30 0.54 0.36 0.46 0.55 0.50 0.57
40 0.44 0.30 0.38 0.45 0.41 0.47
50 0.35 0.25 0.31 0.36 0.33 0.38
60 0.27 0.21 0.24 0.29 0.26 0.30
70 0.21 0.16 0.19 0.21 0.20 0.22
75 0.18 0.13 0.16 0.18 0.16 0.19
80 0.15 0.11 0.13 0.15 0.13 0.15
90 0.08 0.06 0.07 0.08 0.07 0.08
Using eFW (kg) 10 0.63 0.27 0.34 0.56 0.48 0.53
20 0.46 0.25 0.28 0.48 0.34 0.40
25 0.39 0.24 0.28 0.42 0.33 0.35
30 0.38 0.22 0.22 0.41 0.28 0.34
40 0.34 0.17 0.19 0.34 0.27 0.30
50 0.29 0.12 0.17 0.27 0.22 0.25
60 0.23 0.08 0.16 0.21 0.17 0.21
70 0.20 0.07 0.11 0.15 0.12 0.15
75 0.17 0.06 0.08 0.11 0.11 0.13
80 0.14 0.05 0.08 0.08 0.08 0.10
90 0.07 0.02 0.03 0.04 0.05 0.06
achieved using eFW. Given that greasy fleece weight and clean fleece weight have correlation coefficients in excess of 90% (Hawker et al. 1988; Sumner et al. 2007), a large amount of the potential selection differential for clean fleece weight can be achieved through selection for greasy fleece weight (Ford 1961). Further, fleece weight is known to be highly heritable, because most estimates are in excess of 0.4 (Hawker et al. 1988; Sumner et al. 2007) and also repeatable, since individuals selected for greater fleece weight as yearlings maintain their advantage as adults (Ryder & Stephenson 1968; Hawker & Littlejohn 1986). As such, any improvement in the identification of individuals for wool production can be expected to have lasting benefits.
Although not all of the potential advantage in wool production is achieved, utilizing the difference between pre- and post-shearing live weights to provide an estimate of the relative ranking of fleece weight without recourse to individual weighing and recording of fleeces may provide a practical means for improving wool production for commercial flocks. In practice, it is not intended nor suggested that eFW may replace actual FW recording in sires, from which the
benefits of intensive recording in a few individuals outweigh the effort required. Rather, it is suggested the approach outlined here may be used to apply selection pressure for improved wool weight to commercial maternal animals through the identification of poorer performing individuals, leading to improved mean wool production. Given the relative insensitivity of the value of strong wool in relation to fibre diameter, increased product worth per animal can be expected. However, some caution may be needed for fine wool breeds in which product worth per animal does not always increase linearly with wool quantity. Further, the practicality of individual weight recording on a commercial scale is greatly enhanced with the use of RFID, thus improved wool production may be considered a direct on-farm advantage of the adoption of this technology.
Conclusion
individual. This information can be used to aid selection decisions for improved wool production in a commercial farming environment which retain a major proportion of the selection differential for wool weight if selection had occurred based on recorded fleece weight.
References
Burnham DL, Morel PCH, Kenyon PR, Morris ST, Stafford KJ 2009. Brief communication: The effect of fasting on live weight in hogget wethers and pregnant mature ewes. Proceedings of the New Zealand Society of Animal Production 69: 112-114.
Ford GH 1961. Relationship between greasy fleece weight and clean fleece weight in the South Australian merino. Australian Journal of Experimental Agriculture and Animal Husbandry 1: 34-39.
Galwey JM 2012. Change in live weight during shearing as a predictor of fleece weight in sheep. Unpublished Honours dissertation, Lincoln University.
Galwey JM, Logan, CM, Greer AW 2013. Brief communication: Can weighing multiple times
increase the accuracy of live weight recording? Proceedings of the New Zealand Society of Animal Production 73: 146-149.
Hawker H, Littlejohn RP 1986. Live weights, fleece weights and wool characteristics of screened high fleece weight and randomly selected Romney ewe hoggets. Proceedings of the New Zealand Society of Animal Production 46: 219-223.
Hawker H, Dodds KG, Andrews RN, McEwan JC 1988. Production and characteristics of wool from the hogget progeny of sheep intensively screened for fleece weight. Proceedings of the New Zealand Society of Animal Production 48: 207-212.
McDermott AK, Sumner RMW 2009. Realities of clip preparation for strong wool from adult sheep. Proceedings of the New Zealand Society of Animal Production 69: 85-89.
Ryder ML, Stephenson SK 1968. Wool growth. London, WI: Academic Press.
Sumner RMW, Clarke JN, Cullen NG 2007. Effect of divergent selection for wool bulk on live weight and wool characteristics in Perendale sheep. Proceedings of the New Zealand Society of