ISSN: 2231-5381
http://www.ijettjournal.org
Page 181Optimization of Tribological Performance of
Al6061T6/15% SiC/15% Al
2
O
3
/10% Graphite
HMMC using Taguchi Method and Grey
Relational Analysis
Vinod Kumar#1, Surender Sharma#2, Anup Verma#3
*Corresponding author, Astt. Prof. Mech. Engg. Deptt., SKIET, Kurukshetra, Haryana
**Astt. Prof. , Mech. Engg. Deptt., SKIET, Kurukshetra, Haryana
*** Astt. Prof. , Mech. Engg. Deptt.,SKIET, Kurukshetra, Haryana
Abstract
Optimization of tribological performance parameters of Al-6061T6 alloy reinforced with SiC, (Al2O3) 15% and graphite
particulates of weight percentage of 10%. The wear and frictional properties of the hybrid metal matrix composites was studied by performing dry sliding wear test using pin-on-disc wear tester based on Taguchi method and Grey relational analysis. A L27 orthogonal array was selected for analysis of the data. From the tests result, it is observed that parameter
applied load and sliding distance have significant contribution in controlling the friction and wear behaviour of hybrid composites. A confirmation test is also carried out to verify the accuracy of the result obtained through the optimization problem.
Keywords: Metal Matrix Composites (MMCs), Friction, Wear, Taguchi Method, Grey Relational Analysis, Analysis of Variance.
I. INTRODUCTION
Hybrid metal matrix composites (HMMCs) are engineering materials reinforced by a combination of two or more different type of substances in order to achieve the advantage of both of them. This gives rather a high degree of freedom in material design. Hybrid metal matrix composites offer considerable promise to help automotive engineers in the field of fuel economy, increasing styling options, enhancing performance and maintaining safety, quality and profitability are just a few of the challenges addressed daily by the automotive industry.
The particulate reinforced aluminum MMC’s are a preferred choice for weight critical application in the aerospace
and automotive industries due to their high specific strength, high specific stiffness, superior wear resistance and low density. The attainable improvements in the properties are dependent on the intrinsic properties of composite
constituents and the size, shape, orientation, volume/weight fraction and distribution of the reinforcing phase in the metal matrix. In selection of proper reinforcement is therefore crucial to obtaining the most optimum combination of properties at substantially low cost.
Venkatraman et al [14] concluded that the presence of a stable, thin and hard mechanically mixed layer will provide the best wear resistance even though the coefficient of friction will be high. Miyajima et al [2] concluded dry sliding
pin-on-disk wear test for 2024 Al-29% SiC / 26% Al2O3f. From the test they reported that wear resistance of MMC is
strongly dependent on the kind of reinforcement as well its volume fractions. Kaur et al [3] preferred dry sliding wear
for the effect of SiC reinforcement along with immiscible element in spray formed Al-Si base alloy. From the test all the samples (Al-Si, Al-Si/SiC, Al-Si-5Sn/SiC & Al-Si-10SiC) shows that the nature of wear changes
ISSN: 2231-5381
http://www.ijettjournal.org
Page 182The tribological behaviour of Al-7.5% SiCp MMC was studied for varying applied load, sliding speed and time using Taguchi orthogonal array design and grey relational grade. It is observed that time is the most significant parameter influencing the tribological behaviour of MMCs [1]. Siriyala et al [9] studied the wear behaviour for Al alloy-5% SiCp MMC and optimized the testing parameter using Taguchi and grey relational method. In another Sahin [13] performed abrasive wear test of Al-15% SiC at different loads, sliding distances and reinforcement particles size. Radhika et al [8] performed a wear test of Al/Al2O3/Graphite hybrid metal matrix composite at different operating
parameters using Taguchi’s method. In this study sliding distance has the highest influence on wear rate followed by applied load and sliding speed as well as incorporation of graphite as primary reinforcement increases the wear resistance of composites. Mishra et al [7] observed that wear rate decreases with increasing weight percentage of reinforcement for different mesh size of SiC. Similar work has performed and presented that sliding distance has the highest influence on wear rate for Al6061/ 10% SiC metal matrix composites [10]. Basvarajappa et al [6] studies the application of Taguchi technique to dry sliding behavior of Al/SiC/Graphite MMCs and reported that graphite particles increases the wear resistance of the composites and sliding distance is the wear factor that has the highest influence on the wear of composites. Wang et al [5] conducted wear test on pin-on-disk wear test for MMCs and reported that different orientation of reinforcement gives the better result. The friction performance of Al-10% SiCp MMCs against steel was studied for varying tribological test parameters. Applied load is the most important factor which is influencing the friction performance.
For the present tribological study Al-6061T6 is used as base metal and Silicon Carbide (SiC), Alumina (Al2O3) and
Graphite(Gr) is used as reinforcements. The MMC is synthesized by stir casting process in liquid metallurgy route where silicon carbide, alumina (15% by weight) and graphite(10% by weight)is introduced into the Al-6061T6 alloy . The tribological tests are conducted on the material to study the friction and wear properties of materials. The result data are generalized to grey relational grade and analyzed by Taguchi Method. A statistical analysis of variance (ANOVA) is performed. Finally confirmation test is carried out to verify the optimal process parameters combination.
II. TAGUCHI METHOD
The Taguchi’s method [15-16] is a powerful method for designing high quality systems based on orthogonal array (OA) experiments that provide much reduced performance for the experiments with an optimum setting for process control parameters. This method achieves the integration of design of experiments (DOE) [17] with the parametric optimization of the process yielding the desired results. Design of experiment is one of the important and powerful statistical techniques to study the effect of multiple variables simultaneously and involves a series of steps which must
follow a certain sequence for the experiment to yield an improved understanding of process performance. All designed experiments require a certain number of combinations of factors and levels be tested in order to observe
the results of those test conditions. Taguchi approach relies on the assignment of factors in specific orthogonal arrays to determine those test conditions.
Analysis of the experimental setup results uses a signal to noise (S/N) ratio to aid in the determination of the best process designs which are logarithmic functions of desired output to serve as objective functions for optimization. The S/N ratio takes both the mean and the variability into account and is defined as the ratio of mean (Signal) to the standard deviation (noise). The ratio depends on the quality characteristics of the product / process to be optimized. The three categories of S/N ratios are used: lower the better (LB), higher the better (HB), and nominal the best (NB). For the case of minimization of wear, LB characteristic needs to be used. This technique has been successfully used by researchers in the study of dry sliding wear behavior of composites [12]. These methods focus on improving the design of manufacturing processes.
III. GREY RELATIONAL ANALYSIS
ISSN: 2231-5381
http://www.ijettjournal.org
Page 183As a result, optimization of the complicated multiple performance characteristic is converted into optimization of a single grey relational grade. The optimal level of the process parameters is the level with the highest grey relational
grade. The aim of the present paper is to optimize the tribological test parameters to minimize friction & wear of Al
6061 T6 / 15% SiC / 15% Al2O3/10%Gr.
Furthermore, analysis of variance (ANOVA) is performed to predict the importance and significance of each process parameter and their interaction on the tribological properties of Al 6061T6 / 15% SiC / 15% Al2O3/10% MMCs.
Finally confirmation test is performed to verify the optimal combination of process parameters obtained from the analysis.
IV. EXPERIMENTAL DETAIL
(a) Fabrication Process
In the present investigation Al-6061T6 alloy was choosen as the base matrix and which is reinforced with Silicon
Carbide, alumina and graphite. The chemical composition of the matrix metal Al-6061T6 is given in Table 1. Silicon Carbide and Alumina being hard and brittle in nature gets accommodated in soft ductile aluminium base
matrix, enhancing the overall stiffness and strength of the hybrid metal matrix composites (HMMC). In order to achieve high level of mechanical properties in the composite, a good interfacial bonding between the dispersed phase and the liquid matrix has to be obtained. To increase the wettebility of the liquid metal 2% by weight cerium is added.
The silicon carbide and alumina are pre heated at 5000C for 1 hour before mixing in the molten metal. Care was taken
to maintain an optimum casting parameters stirring speed (350 rpm), stirring time (4-5 min) and pouring temperature
(7000C). The molten metal was then poured into green silica sand mould of diameter 14 mm and length 120 mm. And
after cooling the samples required for tribological testing are prepared by different machining processes.
TABLE I CHEMICAL COMPOSITION OF MATRIX Al-6061T6
Chemical Composition
Si Fe Cu Mn Mg Cr Zn Ti Al
% 0.4-0.8 0.7 0.15-0.40 0.15 0.8-1.2 0.04-0.35 0.25 0.2 Balance
(b) Plan of Experiments
Dry sliding wear test was performed with three parameters applied load(L), sliding speed(S) and sliding distance(D) and varying them for three levels as shown in Table 2. According to the rule that degree of freedom for an orthogonal
array should be greater than or equal to sum of those wear parameters, a L27 Orthogonal array(OA) which has 27 rows
and 13 columns was selected as shown in Table 3. To check the degree of freedom (DOF) in the experiment design for the three level test, the three main factors take 6[3x(3-1)] DOFs. The DOFs for three second order interactions (LxS,LxT,SxT) is 12[3x(3-1)x(3-1)] and the total DOFs required is 18. As per the Taguchi method, the total DOFs of selected OA must be greater than or equal to the total DOFs required for the experiment and hence L27 OA has
selected. The response for the modal is wear rate and coefficient of friction. In orthogonal array, first column is assigned to the applied load, second column is assigned to sliding speed and fifth column is assigned to sliding distance and remaining columns are assigned to their interactions. The objective of the model is to minimize wear rate and coefficient of friction. The responses were tabulated and results were subjected to Analysis of Variance (ANOVA). The S/N ratio for wear rate and coefficient of friction using ‘smaller the better’ characteristic given by Taguchi, is as follows:
=−10 log ∑
ISSN: 2231-5381
http://www.ijettjournal.org
Page 184 Table II Process parameters and levels used in experimentLevel Load (N) Sliding Speed (m/s) Sliding Distance (m)
1 25 1.5 700
2 30 2.00 1400
3 35 2.50 2100
(c) Wear Test
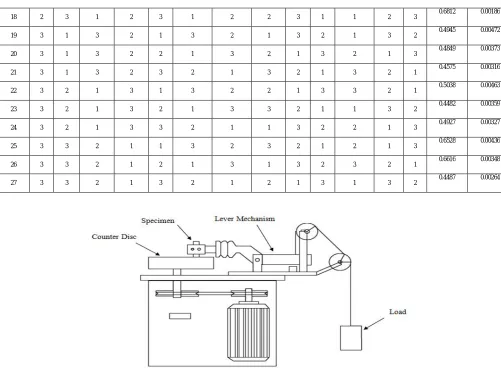
A pin-on-disc test apparatus was performed to determine the sliding wear characteristics of the hybrid composite. The tribological tests are carried out on pin-on-disc testin machine TR20CH(Ducom, India) (Figure 1& 2) under dry non
lubricated condition and at ambient temperature(300C). It uses a pin-on-disc configuration where EN32 steel disc is
used. The composite samples dia. 12mm and 30mm length are pressed against a rotating steel disc of hardness 65HRC. The track diameter was varied for each batch of experiments in the range of 50 mm to 160 mm and parameters such as the load, sliding speed and sliding distance were varied in the range given in Table 2.
A LVDT(load cell) on the lever arm helps determine the wear at any point of time by monitoring the movement of the arm. Once the surface in contact wears out, the load pushes the arm to remain in contact with the disc. This movement of arm generates a signal which is used to detemine the maximum wear and coefficient of friction is monitored continuously as wear occurs. Weight loss of each specimen was obtained by weighing the specimen befor and after the experiment by a singal pan electronic weghing machine with an accuracy of 0.0001g after thorough cleaning with aceton solution.
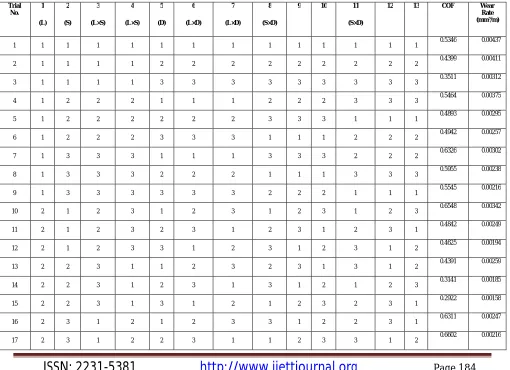
TABLE III L27 ORTHOGONAL ARRAY WITH PROCESSES PARAMETERS AND INTERACTIONS ASSIGNED
Trial No.
1 (L)
2 (S)
3 (L×S)
4 (L×S)
5 (D)
6 (L×D)
7 (L×D)
8 (S×D)
9 10 11
(S×D)
12 13 COF Wear
Rate (mm3/m)
1 1 1 1 1 1 1 1 1 1 1 1 1 1
0.5346 0.00437 2 1 1 1 1 2 2 2 2 2 2 2 2 2 0.4399 0.00411 3 1 1 1 1 3 3 3 3 3 3 3 3 3 0.3511 0.00312 4 1 2 2 2 1 1 1 2 2 2 3 3 3
0.5464 0.00375 5 1 2 2 2 2 2 2 3 3 3 1 1 1 0.4893 0.00295 6 1 2 2 2 3 3 3 1 1 1 2 2 2 0.4942 0.00257 7 1 3 3 3 1 1 1 3 3 3 2 2 2
0.6326 0.00302 8 1 3 3 3 2 2 2 1 1 1 3 3 3 0.5955 0.00238 9 1 3 3 3 3 3 3 2 2 2 1 1 1 0.5545 0.00216 10 2 1 2 3 1 2 3 1 2 3 1 2 3 0.6548 0.00342 11 2 1 2 3 2 3 1 2 3 1 2 3 1 0.4842 0.00249 12 2 1 2 3 3 1 2 3 1 2 3 1 2
ISSN: 2231-5381
http://www.ijettjournal.org
Page 18518 2 3 1 2 3 1 2 2 3 1 1 2 3 0.6812 0.00186 19 3 1 3 2 1 3 2 1 3 2 1 3 2
0.4945 0.00472 20 3 1 3 2 2 1 3 2 1 3 2 1 3 0.4849 0.00373 21 3 1 3 2 3 2 1 3 2 1 3 2 1 0.4575 0.00316 22 3 2 1 3 1 3 2 2 1 3 3 2 1 0.5038 0.00463 23 3 2 1 3 2 1 3 3 2 1 1 3 2 0.4482 0.00359 24 3 2 1 3 3 2 1 1 3 2 2 1 3 0.4927 0.00327 25 3 3 2 1 1 3 2 3 2 1 2 1 3
0.6528 0.00436 26 3 3 2 1 2 1 3 1 3 2 3 2 1 0.6616 0.00348 27 3 3 2 1 3 2 1 2 1 3 1 3 2
0.4487 0.00264
Fig. 1 Layout of Pin-on-disc Tribotester
ISSN: 2231-5381
http://www.ijettjournal.org
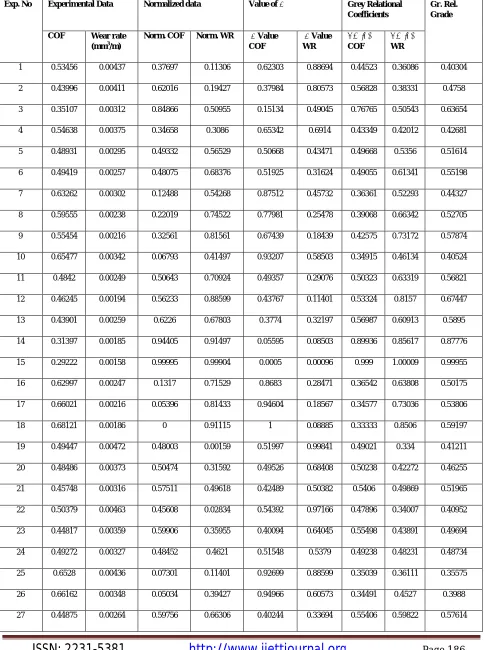
Page 186TABLE IV COMPUTATION OF GREY RELATIONAL GRADE
Exp. No Experimental Data Normalized data Value of ∆ Grey Relational
Coefficients
Gr. Rel. Grade
COF Wear rate (mm3/m)
Norm. COF Norm. WR ∆ Value COF
∆ Value WR
ξ value COF
ξ value WR
1 0.53456 0.00437 0.37697 0.11306 0.62303 0.88694 0.44523 0.36086 0.40304
2 0.43996 0.00411 0.62016 0.19427 0.37984 0.80573 0.56828 0.38331 0.4758
3 0.35107 0.00312 0.84866 0.50955 0.15134 0.49045 0.76765 0.50543 0.63654
4 0.54638 0.00375 0.34658 0.3086 0.65342 0.6914 0.43349 0.42012 0.42681
5 0.48931 0.00295 0.49332 0.56529 0.50668 0.43471 0.49668 0.5356 0.51614
6 0.49419 0.00257 0.48075 0.68376 0.51925 0.31624 0.49055 0.61341 0.55198
7 0.63262 0.00302 0.12488 0.54268 0.87512 0.45732 0.36361 0.52293 0.44327
8 0.59555 0.00238 0.22019 0.74522 0.77981 0.25478 0.39068 0.66342 0.52705
9 0.55454 0.00216 0.32561 0.81561 0.67439 0.18439 0.42575 0.73172 0.57874
10 0.65477 0.00342 0.06793 0.41497 0.93207 0.58503 0.34915 0.46134 0.40524
11 0.4842 0.00249 0.50643 0.70924 0.49357 0.29076 0.50323 0.63319 0.56821
12 0.46245 0.00194 0.56233 0.88599 0.43767 0.11401 0.53324 0.8157 0.67447
13 0.43901 0.00259 0.6226 0.67803 0.3774 0.32197 0.56987 0.60913 0.5895
14 0.31397 0.00185 0.94405 0.91497 0.05595 0.08503 0.89936 0.85617 0.87776
15 0.29222 0.00158 0.99995 0.99904 0.0005 0.00096 0.999 1.00009 0.99955
16 0.62997 0.00247 0.1317 0.71529 0.8683 0.28471 0.36542 0.63808 0.50175
17 0.66021 0.00216 0.05396 0.81433 0.94604 0.18567 0.34577 0.73036 0.53806
18 0.68121 0.00186 0 0.91115 1 0.08885 0.33333 0.8506 0.59197
19 0.49447 0.00472 0.48003 0.00159 0.51997 0.99841 0.49021 0.334 0.41211
20 0.48486 0.00373 0.50474 0.31592 0.49526 0.68408 0.50238 0.42272 0.46255
21 0.45748 0.00316 0.57511 0.49618 0.42489 0.50382 0.5406 0.49869 0.51965
22 0.50379 0.00463 0.45608 0.02834 0.54392 0.97166 0.47896 0.34007 0.40952
23 0.44817 0.00359 0.59906 0.35955 0.40094 0.64045 0.55498 0.43891 0.49694
24 0.49272 0.00327 0.48452 0.4621 0.51548 0.5379 0.49238 0.48231 0.48734
25 0.6528 0.00436 0.07301 0.11401 0.92699 0.88599 0.35039 0.36111 0.35575
26 0.66162 0.00348 0.05034 0.39427 0.94966 0.60573 0.34491 0.4527 0.3988
ISSN: 2231-5381
http://www.ijettjournal.org
Page 187V. RESULT AND DISCUSSION
The aim of present study is to minimze friction and wear for Al6061T6/15%SiC/15%Al2O3/10% Gr metal matrix
composite using Taguchi method. The experimental plan is to find the important control parameters viz applied load,
sliding speed and sliding distance which is influencing the wear process to achieve minimum friction and wear. The experimental results for friction and wear tests are shown in Table 3. Grey relational analysis is carried out
following the step mentioned earlier. Table 4 shows the calculated values for each steps of grey relational analysis.
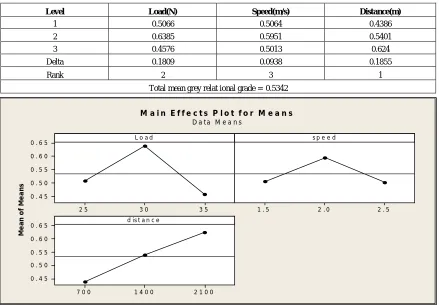
(a) Analysis of S/N ratio for Grey Relational Grade
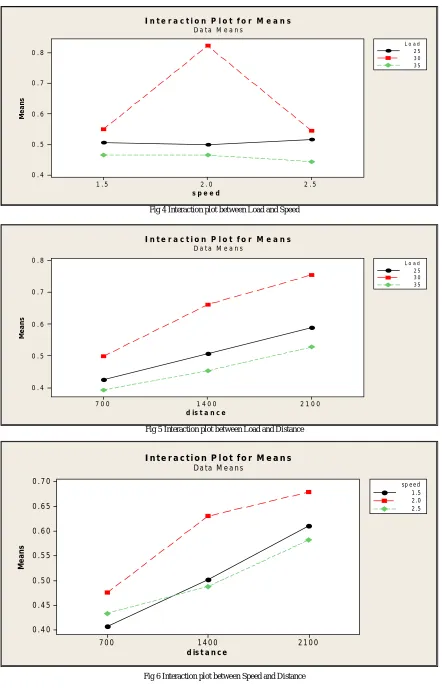
The desirable factor levels are calculated by the S/N ratio analysis in this study the friction coefficient and wear depth as the performance index. In response table (Table 5) the mean S/N ratio for each level of the controlling factors are shown. All calculations are performed using Minitab Software. The response table includes ranks based on delta value (highest minus lowest), rank 1 is assigned to the parameter with highest delta value, rank 2 to second highest delta value and so on. In this case sliding distance has the highest delta value thus rank 1 is assigned to sliding distance. The corresponding main effect is shown in Figure 3. The interaction plots for parameters applied load, sliding speed and sliding distance are given in Figure 4,5 and 6. In main effect plot, the significance of each parameter can be judged by the inclination of plot. From the main effect plot, it is seen that the parameter sliding distance (D) is the most signifcant parameter while other parameters load and speed are also significant paremeters in controlling the tribological behaviour of the HMMC. From the interaction plots in Figure 4, 5 and 6, it can be seen that the lines are intersecting each other. From present analysis, it is observed that sliding distance (D) is the most influencing
parameter for tribological characteristics of Al6061T6/15%SiC/15%Al2O3/10%Gr hybrid composites followed by
applied load and sliding speed respectively. The optimal process parameter combination is the one that yields maximunm mean value and thus it is found to be L2S2D3, i.e. the highest level of applied load along with the lowest level of sliding speed and highest level of sliding distance within the experimental domain considered in the present study
TABLE V RESPONSE TABLE FOR GREY RELATIONAL GRADE
Fig 3 Main effects plot for grey relational grade
Level Load(N) Speed(m/s) Distance(m)
1 0.5066 0.5064 0.4386
2 0.6385 0.5951 0.5401
3 0.4576 0.5013 0.624
Delta 0.1809 0.0938 0.1855
Rank 2 3 1
Total mean grey relat ional grade = 0.5342
3 5 3 0
2 5 0 . 6 5
0 . 6 0
0 . 5 5
0 . 5 0
0 . 4 5
2 . 5 2 . 0
1 . 5
2 1 0 0 1 4 0 0
7 0 0 0 . 6 5
0 . 6 0
0 . 5 5
0 . 5 0
0 . 4 5
L o a d
M
e
a
n
o
f
M
e
a
n
s
s p e e d
d is t a n c e
ISSN: 2231-5381
http://www.ijettjournal.org
Page 188Fig 4 Interaction plot between Load and Speed
Fig 5 Interaction plot between Load and Distance
Fig 6 Interaction plot between Speed and Distance
2 . 5 2 . 0
1 . 5 0 . 8
0 . 7
0 . 6
0 . 5
0 . 4
s p e e d
M
e
a
n
s
2 5 3 0 3 5 L o a d
D a t a M e a n s
2 1 0 0 1 4 0 0
7 0 0 0 . 8
0 . 7
0 . 6
0 . 5
0 . 4
d is t a n c e
M
e
a
n
s
2 5 3 0 3 5 L o a d
I n t e r a c t i o n P l o t f o r M e a n s
D a t a M e a n s
2 1 0 0 1 4 0 0
7 0 0 0 . 7 0
0 . 6 5
0 . 6 0
0 . 5 5
0 . 5 0
0 . 4 5
0 . 4 0
d is t a n c e
M
e
a
n
s
1 .5 2 .0 2 .5 sp e e d
I n t e r a c t i o n P l o t f o r M e a n s
ISSN: 2231-5381
http://www.ijettjournal.org
Page 189(b) Analysis of variance for Grey Relational Grade
The results for various combinations of parameters were obtained by conducting the experiment as per the Orthogonal Array. The measured results were analyzed using the Minitab 15 Software which is downloaded from internet for design of experiment applications. Using Minitab, ANOVA is performed to determine which parameter and interaction significantly the performance characteristics.
TABLE VI RESULTS OF ANOVA FOR GREY RELATIONAL GRADE
Table 6 shows the ANOVA result for tribological behaviour of Al6061T6/SiC/Al2O3/Gr hybrid Metal Matrix Composites. ANOVA calculates the F-Ratio, which is the ratio between regression mean square and mean square error. The F-ratio is also called variance ratio, is the ratio of variance due to the effect of a factor and variance due to the error term. In general when the F-value increases, the significance of the parameter also increases. The ANOVA table shows the percentage contributon of each parameter. From ANOVA table it is seen that sliding distance (D) is the most significant parameter influencing the tribological behaviour while parameters applied load and sliding speed are significant. The interactions of parameters have slightly influence of friction and wear property of hybrid composite.
(c) Confirmation Test
After the optimal level of testing parameters have been found, it is necessary that verification tests are carried out in order to evaluate the accuracy of the analysis and to validate the experimental results. The estimated S/N ratio η using the optimal level of the testing parameters can be calculated as
̂= + ( − )
Where, ηm is the total mean S/N ratio, ηi Is the mean S/N ratio at optimal testing parameter level and O is the number
of main design process parameters that significantly affect the friction and wear performance of
Al6061T6/15%SiC/15%Al2O3 HMMC.
TABLE VII RESULTS OF CONFIRMATION TEST OF MULTIPLE PERFORMANCE
Level
Initial Parameter Optimal Parameter Experimental
L1S1D2 L2S2D3 L2S2D3
Wear 0.00411 0.00158
COF 0.4399 0.2922
Grade 0.4758 0.9995 0.9995
Improvement of grey relational grade = 0.5237
Source DF Seq SS Adj SS Adj MS F P %
Load(N) 2 0.157514 0.157514 0.078757 17.92 0.001 30.03751
Speed(m/s) 2 0.050043 0.050043 0.0250215 5.69 0.029 9.54307
Distance(m) 2 0.155297 0.155297 0.0776485 17.67 0.001 29.614734
Load(N)*speed(m/s) 4 0.103357 0.103357 0.0258393 5.88 0.017 19.709911
Load(N)*distance(m) 4 0.013983 0.013983 0.0034958 0.8 0.56 2.6665217
Speed(m/s)*distance(m) 4 0.009037 0.009037 0.0022593 0.51 0.728 1.7233324
Residual Error 8 0.035161 0.035161 0.0043951
ISSN: 2231-5381
http://www.ijettjournal.org
Page 190Table 7 shows the comparison of the estimated grey relational grade with the actual grey relational grade from initial to optimal condition is 0.09995. Thus there is an improvement of 16.56% in grey relational grade.
VI. CONCLUSION
Following are the conclusions drawn from the study on dry sliding friction and wear test for
Al6061T6/15%SiC/15%Al2O3 /10%Gr HMMC using Taguchi and Grey relational grade.
Applied Load(30.23%) has the highest influence on tribological behaviour followed by sliding distance and
sliding speed. The interaction set the parameters have slightly influence on friction and wear property of hybrid composite.
From the Taguchi analysis the optimal combination of process parameter for minimum wear and friction is
found to be L2S2D3, i.e., the highest level of applied load and sliding distance along with highest level of sliding speed.
Incorporation of SiC, Al2O3 and Gr particulate increase the wear resistance of hybrid composites by
performing a protective layer between pin and counterface has a significant effect on the friction and wear depth.
Confirmation experiment was carried out and made a comparision between initial and optimal experimental
parameters values which shows wear depth is reduced by (61.5%) and friction is decreased by (33.5%).
REFERENCES
[1] Ghosh, S., Sahoo, P., Sutradhar, G., 2013. Tribological performance optimization of Al-7.5% SiCp Composites using Taguchi’s method & grey relational analysis, Hindawi Publishing Corporation, Journal of Composites, Vol.-2013.
[2] Miyajima, T., Iwai, V., 2003. Effect of reinforcements on sliding behaviour of aluminium matrix composites, wear 255, 606-616
[3] Kaur, K., Anant,R., Pandey, O. P., 2011.Tribological Behaviour of SiC Particle Reinforced Al-Si Alloy,Tribol lett 44: 41-58
[4] Ghosh, S., Sahoo, P., Sutradhar, G., 2013. Friction Performance of Al-10% SiCp Reinforced MMCs Using Taguchi Method, ISRN Tribology Vol. 2013.
[5] Wang, Y. Q., Afsar, A.M., Song, J.I., Tribological Behaviour of Al2O3/SiCp Hybrid MMCs.
[6] Basavarajappa, S., Chandramohan, G., Paulo Davim, J., 2007. Applications of Taguchi techniques to study dry sliding wear behaviour of metal matrix composites, Materials & Design 1393-1398.
[7] Mishra, A. K., Yadav, R., Srivastva, R. K., 2013.Wear behaviour of Al-6061 with different reinforcement & particle size of SiC MMCs, Europian Journal Of Scientific Research Vol. 98 No.4.
[8] Radhika, N., Subramanian, R., Prasat, S., 2011. Tribological Behaviour of Aluminium/Alumina/Graphite Hybrid MMC Using Taguchi’s Techniques, Journal of Minerals & Materials Characterization & Engg., Vol. 10 No. 5, PP. 527-443.
[9] Siriyala, R., Alluru, G. P., Penmetsa, R. M. R., Dmaiselvam, M., 2012. Application of grey–taguchi method for optimization of dry sliding wear properties of Aluminium MMCs, Front. Mech. 7(3): 279 – 287.
[10] Mishra, A. K., Sheokand, R., Srivastava, R. K., 2012. Tribological Behaviour of Al-6061/SiC MMCs by Taguchi’s Techniques, IJSRP Vol. 2.Issue 10.
[11] Taguchi, G., 1990. Introduction to quality engineering. Tokyo: Asian Productivity Organisation.