Reply to: “Neutral tumor evolution?”
Timon Heide1,*, Luis Zapata1,*, Marc J. Williams2,4,*, Benjamin Werner1,*, Giulio Caravagna1, Chris P. Barnes3,5, Trevor A. Graham2,^ & Andrea Sottoriva1,^
1
Evolutionary Genomics & Modelling Lab, Centre for Evolution and Cancer, The Institute of Cancer Research, London,
UK. 2
Evolution and Cancer Laboratory, Barts Cancer Institute, Queen Marry University of London, London, UK. 3
Department of Cell and Developmental Biology, University College London, London, UK. 4
Centre for Mathematics and Physics in the Life Sciences and Experimental Biology (CoMPLEX), University College
London, London, UK. 5
Department of Genetics, Evolution and Environment, University College London, London, UK.
* These authors contributed equally to this work
^ For correspondence: [email protected] and [email protected]
We thank Tarabichi and colleagues for the constructive criticism of our Williams et al. 20161 work. Their critique has four main points that we address below.
1. Impact of clonal copy number alterations
In Williams et al. 20161, we assessed the cumulative variant allele frequency (VAF) distribution M(f) over the frequency range f=[0.12,0.24] to restrict our analysis to subclonal variants within a
range applicable to the diverse datasets we considered. Tarabichi and colleagues note that
tumours with a tetraploid genome will have an additional ‘peak’ of clonal mutations at f~0.25
(mutations in a single allele, Supplementary Figure 1A), thus causing incorrect rejection of
neutrality (Supplementary Figure 1B). The integration range that we chose was based on a triploid
tumour with read depth of 100X, giving an upper threshold of 0.26 (see Supplementary Methods).
Although this is suitable for most cases, it is not for a tetraploid tumour, suggesting that the number
of tumours consistent with neutral evolution could be larger than we reported. In Supplementary
Figure 1C we show how this problem can be avoided by adjusting the range for tetraploid tumours.
We do acknowledge that the 1/f integration method is more accurate when applied to the whole
VAF spectrum of subclonal mutations only. Moreover, we have recently developed a Bayesian
model selection framework that compares the neutral model against models with selection, using
2. Interpretation of the 1/f statistical test
Tarabachi and colleagues correctly note that failing to reject the null is not necessarily evidence for
it. While this is true, hypothesis-driven evolutionary analysis of cancer genomic data requires a
sensible null. Analysing data without knowing what to expect in the simplest scenarios may lead to
wrong conclusions, as we have highlighted3. We have proposed neutrality, the null model of molecular evolution4, as a sufficient explanation of the available data from a proportion of tumours. The test we applied quantifies the deviation from the null distribution in terms of a change in the
model parameter (s=0 vs s>0). This structure arises from a frequentist approach and arguments
for setting up the test in any other way are arbitrary and impractical. There are an infinite number
of models of selection, some producing vanishingly small and so unmeasurable deviations from
neutrality (e.g. weak selection), while others are biologically unrealistic (e.g. every mutation is a
driver, constant population size in cancer). This is why in molecular evolution neutrality is a
suitable null4. In our view, selection is arguably the most important force in cancer, but a sensible null model avoids over-interpreting data.
Tarabichi and colleagues state that the M(f)~1/f deterministic solution we reported in our
manuscript (Eq.7) relies on the strong assumption of synchronous cell divisions. That is not the
case: Eq.7 is the convergent solution of a continuous-time stochastic branching process for large
number of cells5. Simulations based on Gillespie algorithm that explicitly model asynchronous cell divisions agree with the solutions of the stochastic branching process. Tarabichi et al. also state
that simulating stochastic processes is more realistic. This is indeed what we did in our original
manuscript (Fig S9-S11 in Williams et al. 2016), demonstrating the convergence to the
deterministic solution. A comprehensive analysis of the underlying stochastic Luria-Delbrück model
shows that the scaling behaviour of the stochastic branching process (1/f tail) remains unchanged
even in the explicit presence of stochastic cell death6. In Tarabichi’s letter Figure 1b, the claim that a stochastic neutral model does not imply 1/f is therefore incorrect, as also demonstrated by others
before us5-7. Moreover, in the beginning of their letter Tarabachi and colleagues argue that the 1/f tail is solely due to drift. This is true only in populations of constant size. In exponentially growing
populations that start from a single cell such as cancer, the 1/f subclonal tail emerges instead from
somatic mutations acquired at different times during growth.
3. Insights from simulated tumours
Tarabichi and colleagues use a stochastic branching process, similar to our previous
implementation1,2, to generate synthetic genomic data and test our method. In their Figure 1, Tarabichi et al. present a synthetic analysis of the 1/f test using the analytical deterministic solution
at a certain fixed time point. First, we note that Tarabichi’s Figure 1a is different from 1b, which
contradicts mathematical theory1,5-8.
The parameters used in Tarabachi‘s simulations are also rather extreme. In their model the
emergence of a subclonal driver increases the net-growth rate (advsubclone, selective advantage),
andmodifies the mutation rate at the same time. Curiously, the mutation rate can decrease by a
factor of 8, or increase by a factor 100. A rate of 1024 new mutations per cell division (Tarabichi’s
Figure 1a, x-axis, 𝜇𝑠𝑢𝑏𝑐𝑙𝑜𝑛𝑒=210) pertains only to a very small set of colorectal and uterine cancers with POLE/POLD mutations. A POLE subclone arising within a POLE wild-type background is a
very rare event9. Thus, we urge caution when considering the implications of the parameters at the extremities of the range considered by Tarabichi et al.
To address the authors’ criticism, we have reproduced their Figure 1b with our stochastic
branching process (Figure 1A, see Supplementary Methods). We systematically found that when a
subclone with fsubclone≥10% is selected (selective advantage 𝑎𝑑𝑣𝑠𝑢𝑏𝑐𝑙𝑜𝑛𝑒> 0.5), the 1/f test identifies
it correctly (neutrality is rejected; top left quadrant of Figure 1A, example in 1B). When the new
subclone is instead very small (weak selection), the 1/f test fails to reject neutrality (𝑎𝑑𝑣𝑠𝑢𝑏𝑐𝑙𝑜𝑛𝑒< 0.5, bottom half of Figure 1A, example in 1C). Figure 1D illustrates the relationship between the
selective advantage and the subclone cell fraction in the final tumour, highlighting the issue of the
limit of detectability (LOD). We have subsequently quantified this effect2, identifying a ‘wedge of selection’ that describes the detectability problem in cancer genomic data at current resolution. If
subclonal selection does not significantly change the clonal composition of the tumour, the
signature of neutral growth (‘1/f tail’) will still dominate the detectable VAF spectrum (bottom part of
Figure 1A).
Notably, for a hypermutant subclone with strong selective advantage (𝜇𝑠𝑢𝑏𝑐𝑙𝑜𝑛𝑒64, top right-hand side of Figure 1A,), the analysis showed a massive 1/f tail containing thousands of the subclone’s
private mutations. These mutations dominate the entire VAF distribution and obscure the
underlying subclonal structure (Figure 1A, example in 1E). It is not surprising that our test, or any
other test, would struggle to detect any subclonal cluster or deviation from 1/f in these cases.
Curiously, for moderate values of selection (advsubclone~0.5), a change in mutation rate from normal
to hypermutant could be detected, leading to rejection of neutrality (mid-right area in Figure 1A,
example in 1F, see also Fig S11H in Williams et al. 2016). For weak selection and a hypermutator
subclone, the new subclone did not reach a detectable size and therefore neutrality could not be
rejected (Figure 1C).
Importantly, we note that the lack of discriminatory power in these peculiar scenarios does not
compare our method with the extended integration range (Figure 1G) to DPclust, a method to
detect subclones based on Dirichlet Process clustering10 proposed by some of the authors of the letter (see Supplementary Methods). Even under optimal circumstances (strong selection), the
sensitivity of DPclust is suboptimal in the vast majority of cases (Figure 1H).
We are pleased however that Tarabichi and colleagues confirmed that 1/f tails are pervasive in
cancer genomic data. Neutral tails are a simple consequence of clonal growth, and appear within
each individual clone during its expansion1,2.
4. Analysis of subclonal selection using dN/dS ratios
Using a test inspired by the classical dN/dS method, Tarabichi et al. argue to find evidence of
subclonal selection in tumors classified by our test as neutral. Specifically, the authors pool
together subclonal mutations in known cancer genes from multiple patients, and calculate a dN/dS
value for neutral and non-neutral groups. Their criticism is that subclonal mutations in the neutral
group should lack evidence of selection (dN/dS~1).
First, we note that it is wrong to draw conclusions about individual samples from such a
population-level statistic. Instead, discrepancies between the dN/dS value and our 1/f test results could simply
mean that our method may have misclassified one, or more, patients. To investigate this, we
reproduced their analysis using the same dN/dS method11 and measured global dN/dS for 369 driver genes11 in colorectal and gastric cancers analysed in our original manuscript1. Tarabichi’s TCGA pan-cancer analysis used CAVEMAN calls that are not publicly available, so instead we
reanalysed the pan-cancer TCGA variant calls publicly available from the GDC data portal (see
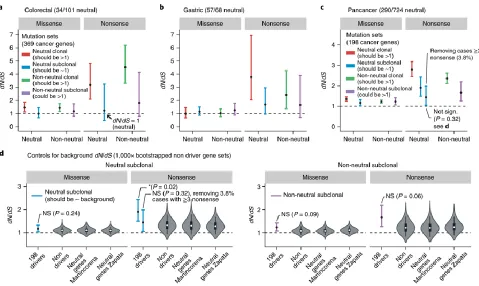
Supplementary Methods). We found that in all three cohorts, dN/dS of subclonal missense
mutations in neutral-classified tumours was not significantly different from 1, thus confirming our
findings (Figure 2A-C, missense mutations on the left, blue bars).
Interestingly, we found a small group of neutrally classified patients with an unusually high number
of subclonal nonsense mutations in putative driver genes. 1/57 gastric cases (1.7%) and 11/290
(3.8%) of pan-cancer cases had 3 or more subclonal nonsense mutations. We manually examined
these patients (Supplementary Figure 2) and found that these were affected by clonal mutations
‘bleeding’ into the subclonal integration range, misclassification caused by ploidy measurement
errors, and possibly the presence of selected subclones hidden underneath 1/f tails. We care to
stress that these tumours had been classified with our original limited integration range. After
removing patients with 3 or more nonsense mutations (e.g. leaving 96.2% of putatively neutral
cases in the pan-cancer cohort), the dN/dS value for nonsense was not significantly different from
dN/dS values for ‘control sets’ (background) of passenger genes using bootstrapping of 1,000
random sets of 198 non-driver genes12 as well as neutral genes (Figure 2D). This analysis indicates a systematic positive bias for the estimation of dN/dS. This could be due to public GDC
calls being depleted of synonymous somatic mutations present in dbSNP, skewing dN/dS values
as mentioned in Martincorena et al. 2017. Interestingly, subclonal dN/dS values were consistently
higher in non-neutral versus neutral cases, although this was not significant (Figure 2D).
We care to highlight that dN/dS analysis at the cohort-level combines mutations from different
patients, whereas the neutrality test is patient-specific. Even a single misclassified patient carrying
multiple nonsense mutations in driver genes significantly alters the dN/dS value of a whole cohort.
While dN/dS can reveal an excess or depletion of mutations in a cohort, Tarabichi et al’s analysis
cannot differentiate whether this is coming from one or multiple patients.
Summary
We thank Tarabachi and colleagues for providing some valid constructive criticism of our original
manuscript. In our assessment of their critique however, our original conclusion remains valid: that
neutral evolution provides an entirely adequate description of the pattern of intra-tumour
heterogeneity that has been observed to date across many tumours. We are also grateful to
Tarabichi and co-authors because they led us to the finding that VAF distribution analyses applied
to single patients, like our neutrality test, can be carefully combined with cohort-level statistics like
dN/dS to increase the power to discriminate between neutral dynamics and selection in cancer.
Contributions
TH performed simulation and bioinformatic analyses. LZ performed dN/dS analysis. MW performed
additional simulation analysis. BW performed mathematical analysis. GC provided expertise on
clustering analysis. CB, TAG and AS conceived and led the study. All authors addressed the
criticism and wrote the response.
Acknowledgements
A.S. is supported by The Chris Rokos Fellowship in Evolution and Cancer and by Cancer
Research UK (A22909). T.A.G. is supported by Cancer Research UK (A19771). C.P.B. is
supported by the Wellcome Trust (097319/Z/11/Z). B.W. is supported by the Geoffrey W. Lewis
Post-Doctoral Training fellowship. A.S. and T.A.G. are jointly supported by the Wellcome Trust
(202778/B/16/Z and 202778/Z/16/Z respectively). M.J.W is supported by a Medical Research
Council student scholarship.
Competing financial interests
Figure 1. Insights from stochastic simulations of cancer growth. (A) Heatmap recapitulating
Tarabichi’s Figure 1b with same parameter set and showing proportion of simulations where
neutrality was rejected (200 cases per parameter combination). (B) Example VAF distribution with
a detectable subclonal cluster (dashed line indicates subclone frequency). The 1/f test rejects
neutrality in favour of selection (R2 reported). (C) Example VAF distribution with a weakly-selected subclone that remains below the limit of detection (100X depth). (D) Subclone cell fraction in the
final tumour as a function of fitness advantage, for advsubclone<0.5 the subclone rarely reaches
detectable size of ~10% cell fraction (assuming 100x depth). (E) Example VAF distribution for a
subclone with selective advantage and, at the same time, high mutation rate. (F) Example VAF
distribution for a selected and extreme mutator subclone. (G) Sensitivity of the 1/f test applied to
subclonal mutations in the extended range of VAF=[0.025,0.45] from the simulations in panel A,
numbers report proportion of cases where neutrality was rejected (R2<0.98). (H) Sensitivity of subclone detection of DPclust, a Dirichlet subclonal clustering method, when applied to the same
simulated data. Numbers report proportion of cases (20 cases per combination) where the correct
subclone has been identified within a 5% CCF error with respect to true position.
Figure 2. Detecting subclonal selection with dN/dS analysis. dN/dS analysis using
Martincorena et al. 2017 method applied to colorectal cancers (A), gastric cancers from ref13
analysed in Williams et al. 2016 (B), and TCGA pan-cancer cases using newly available GDC calls
to reproduce Tarabichi’s dN/dS analysis (C). Cancers were classified as neutral or non-neutral
(split between clonal/subclonal and missense/nonsense). (D) Comparison of the dN/dS estimates
obtained for the 198 driver genes (black dot: point estimate, error bars: 95% CI) with the
distribution of 1,000 random subsets from three control sets of non-driver genes demonstrates a
general positive bias of estimated dN/dS values (white dot: median, box: interquartile range,
whiskers: 90% prediction interval). After removing 3.8% of pan-cancer cases with 3 subclonal
nonsense mutations in driver genes, both missense and nonsense dN/dS in neutral cancers were
not significantly different from the neutral expectation.
References