www.astrophys-space-sci-trans.net/7/195/2011/ doi:10.5194/astra-7-195-2011
© Author(s) 2011. CC Attribution 3.0 License. Astrophysics and Space Sciences
Transactions
An air shower array for LOFAR: LORA
S. Thoudam1, G. v. Aar1, M. v. d. Akker1, L. B¨ahren1, A. Corstanje1, H. Falcke1,2, J. R. H¨orandel1, A. Horneffer1,
C. James1, M. Mevius3, O. Scholten3, K. Singh1,3,4, and S. ter Veen1
1Department of Astrophysics, IMAPP, Radboud University Nijmegen, The Netherlands 2ASTRON, 7990 AA Dwingeloo, The Netherlands
3Kernfysisch Versneller Instituut, NL-9747 AA Groningen, The Netherlands 4IIHE, Vrije Universiteit Brussel, B-1050 Brussel, Belgium
Received: 28 October 2010 – Revised: 21 January 2011 – Accepted: 24 January 2011 – Published: 9 June 2011
Abstract. LOFAR is a new form of radio telescope which
can detect radio emission from air showers induced by very high-energy cosmic rays. It can also look for radio emission from particle cascades on the Moon induced by ultra high-energy cosmic rays or neutrinos. To complement the radio detection, we are setting up a small particle detector array LORA (LOfar Radboud Air shower array) within an area of
∼300 m diameter in the LOFAR core. It will help in trigger-ing and confirmtrigger-ing the radio detection of air showers with the LOFAR antennas. In this paper, we present a short overview about LORA and discuss its current status.
1 Introduction
LOFAR (the LOw Frequency ARray) is a new kind of ra-dio telescope for astronomical observations in the frequency range of ≈(10−240)MHz with high sensitivity and high spatial resolution (http://www.lofar.org). It uses a large num-ber of simple dipole antennas instead of the traditional big parabolic dishes. It consists of 40 stations in the Nether-lands, 5 in Germany and one each in Great Britain, France and Sweden covering a total area of more than 1000 km in diameter.
Though primarily design as an astronomical telescope, LOFAR can also be used for the detection of very high-energy cosmic rays (CRs) in the interesting high-energy region above 1016eV where the transition of galactic to extra-galactic CRs is expected (H¨orandel et al., 2009; Horneffer et al., 2010). This will be done by looking at extensive air showers which are essentially cascades of energetic sec-ondary particles produce by the interaction of CR primaries with the nuclei present in the atmosphere. A large fraction of
Correspondence to: S. Thoudam ([email protected])
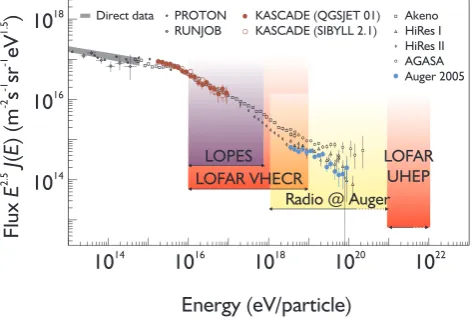
Fig. 1. Detectable CR energy ranges for LOFAR. LOFAR VHECR
refers to the detection using air showers and UHEP to the detection using the Moon. Also shown are the energy ranges for the LOPES and the Auger radio experiments.
these secondaries are electrons and positrons which produce radio synchrotron emission in the presence of the Earth’s magnetic field (Falcke et al., 2005). Due to coherence ef-fects, this emission can give strong signals on the ground in the frequency range of ≈(10−80)MHz detectable by the LOFAR low band antennas.
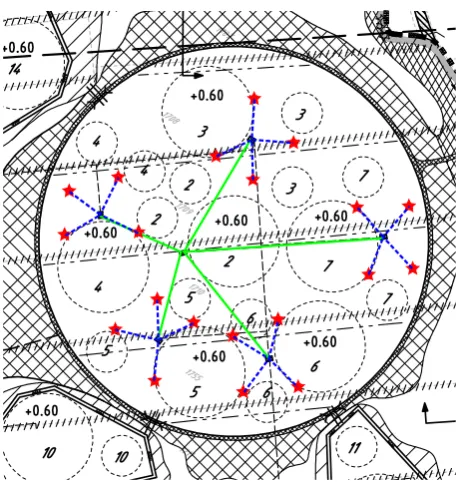
0m 30m 60m 90m 120m
Fig. 2. Layout of the LOfar Radboud Air shower array (LORA) in
the LOFAR core. The red stars denote the positions of the particle detectors and the circles denote the positions of the antenna fields. The detectors are contained within an area of∼300 m diameter with relative spacings of∼(50−100)m.
Energy Particles) refers to that using the Moon. Figure 1 also shows the energy ranges for the LOPES (LOFAR Proto-type Station) experiment which is located at the KASCADE-Grande experimental site (Apel et al., 2010) and the currently building AERA (Auger Engineering Radio Array) experi-ment at the Pierre Auger Observatory (van den Berg et al., 2009).
One important goal of the LOFAR CR experiment is to push the radio detection technique towards an independent way of detecting very high energy CRs. By detecting the ra-dio signals with better sensitivity and better spatial resolution in a wider frequency range, we strongly believe that LOFAR will provide better understanding of the measured signals, their emission mechanisms and their relations with the air shower parameters, thereby leading to better estimates of the properties of the primary particle. Compared to the LOPES (30 antennas) and the CODALEMA (24 antennas) experi-ments (Ardouin et al., 2005), LOFAR has 18 stations in its core (an area of≈2×3 km2) with each station consisting of 96 low band antennas and 48 high band antennas. However, at this stage, it is still quite early for radio detection experi-ments to do a stand-alone study on CRs. Therefore, we are also setting up a small particle detector array called LORA (LOfar Radboud Air shower array). Its main role will be to trigger and confirm the radio detection of air showers with the LOFAR antennas. It will also help in the reconstruction of several important air shower parameters like the primary
Time (nsecs)
0 1000 2000 3000 4000 5000 6000 7000 8000 9000 10000
ADC counts
0 50 100 150 200 250
Fig. 3. Example of a signal trace when a charged particle passes
through one of our detectors.
energy, the shower core location, the arrival direction, the lateral density distribution etc.
2 LORA set-up
LORA is setting up inside the LOFAR core within an area of∼300 m diameter. It consists of 5 stations with 4 parti-cle detectors each, placed at a separation of∼(50−100)m between them. It is expected to detect CRs with energies greater than ∼1015eV at an event rate of around once ev-ery few minutes. Detailed simulations about LORA as well as combined studies including the LOFAR radio data will be carried out as soon as possible. The schematic layout of the LORA detectors arrangement is shown in Fig. 2 where the red stars represent the positions of the detectors and the circles denote the positions of the LOFAR antennas fields. Data collection in individual stations are controlled locally by station computers which are then controlled by a master computer where the overall data processing is done.
2.1 Detectors
The detectors for LORA are taken over from the KAS-CADE experiment (Antoni et al., 2003). Each detector is of (98×125)cm in size and consists of two slabs of 3 cm thick plastic scintillators. When a charged particle passes through a scintillator slab, the light which are produced are collected into a photomultiplier tube (PMT) through a wave-length shifter bar. The electrical signals from the PMTs (one PMT for each slab) are then combined and fed into the elec-tronics where they are converted into digital signals.
2.2 Electronics
chan-nels (one channel corresponds to one detector) and there are two units per station (a master and a slave). The master sets the event trigger condition and also provides the time stamp with a GPS receiver along with a 200 MHz clock counter. Data in each channel are handled by two 12-bit ADCs (so there are 4 ADCs per HISPARC unit) which can measure voltages in the range of(0−2)V. Event data (signal) in a channel are sampled with a time resolution of 2.5 ns and are stored in a total time window of 10 µs. Figure 3 shows a typ-ical signal of a charged particle passing through one of our detectors. Data from the electronics are sent to the station computer through USB.
Each HISPARC unit has a FPGA circuit built into it. This gives an observer control over several parameters required by the electronics as well as the detectors. For instance, one can set the trigger thresholds, high voltages, trigger condi-tion, coincidence time window etc. at any time during the observation through a user software running at the station computer.
2.3 Data acquisition
All the PMTs are gain calibrated by adjusting their voltages to match the response for single muons. When the signals in the two HISPARC units in a station satisfy some minimum trigger condition, the signals are sent to the station computer which then sends them to the master computer. The master computer combines the signals from all stations and checks for good air shower events. When an air shower candidate is found, a first-level online analysis is performed to calculate shower parameters like the arrival direction, shower core po-sition, event size etc., and a trigger information will be sent to the LOFAR antenna to dump the corresponding radio data for the air shower. The master computer takes less than 10 ms to process an event. This is necessary because the antennas have to dump their radio data corresponding to a particular event before they are overwritten in a memory ring-buffer, known as Transient Buffer Board (TBB).
The DAQ software for LORA is developed in C/C++ lan-guage for Linux based operating systems. The software (par-ticularly the online monitoring tool) uses several features of the ROOT package (http://root.cern.ch). On the monitoring panel, important information is displayed which is useful to monitor the performance of the system electronics and of the detectors during observations.
The final data are stored in ROOT format and they con-sist of four kinds of data. The first are the event data which are generated whenever an air shower event is detected. The data contain the event time stamp for each station and the signal trace in ADC counts for each detector. The second kind of data stores the so-called one second messages from the HISPARC unit. This data is generated every second by the master device and it contains information about the num-ber of times the analog signal went over the threshold in the last second for each of the four channels. It also has
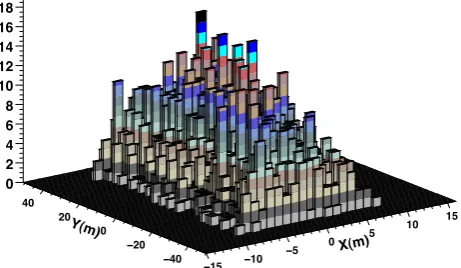
X(m)
−15 −10
−5 0
5 10
15 Y(m)
−40 −20 0 20 40 0 2 4 6 8 10 12 14 16 18
Fig. 4. Reconstructed air shower core distribution for 5463 events
collected with the LORA prototype.
tant timing information which can be used for calculating an event time stamp with nanosecond accuracy. The third data kind comprises several control parameters for the observa-tion run. This data is stored every interval of time fixed by the observer at the start of the run. The fourth kind of data contains information about the noise level in each channel averaged over some fixed interval of time.
The DAQ software and a preliminary data analysis soft-ware have been tested successfully on a LORA prototype in-stalled at Radboud University (RU) Nijmegen. The results from the prototype are presented in the following section.
3 Results from the LORA prototype
0 20 40 60 80
0 45 90
135
180
225
270
315
Fig. 5. Arrival direction distribution(θ,φ)for the 5463 events col-lected with the LORA prototype.
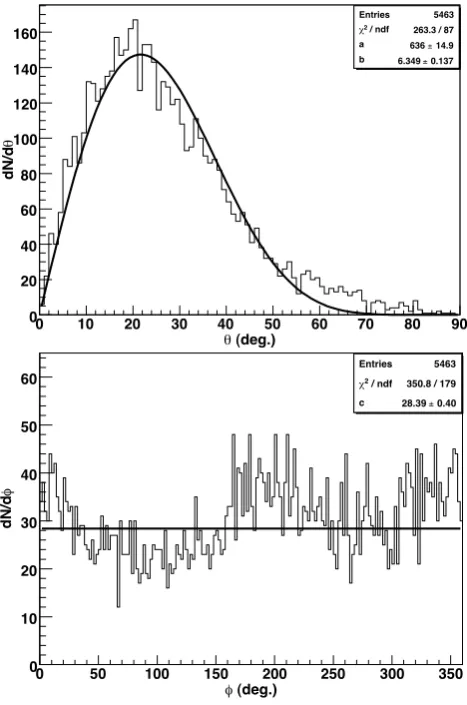
In Figs. 4 and 5, we show the distributions of the recon-structed core positions and the arrival directions (θ,φ) re-spectively. In Fig. 6, we plot theθ(top) and theφ(bottom) distributions separately. Theθdistribution is fitted using the following function,
dN
dθ =asinθcos
bθ. (1)
The fit parameters are found to bea=636±14.9 and b=
6.35±0.14. For theφdistribution, we fit it to a constant as
dN
dφ =c. (2)
Equation (2) is expected if the arrival direction of the CRs are isotropic. However, in our case we see a sinusoidal distribu-tion with two dips one at∼90◦and the other at∼270◦which are due to the narrow arrangement of our detector set-up.
It should be mentioned that at this stage, we do not aim to perform a detailed analysis and derive a final set of fit pa-rameters which determine important properties of the CRs. As already mentioned, our primary aim was to test our elec-tronics and the DAQ software. The preliminary results from the prototype are in general consistent with what we expect from CR observations with air shower arrays.
4 Current status and future plans
The electronics and the DAQ software for LORA have been tested successfully. The installation of all the LORA stations in the field is already completed and the set-up is currently under testing. On the other hand, the LOFAR CR pipeline software is under development and we are expecting to start the simultaneous observation of CRs with the radio antennas before summer 2011.
Entries 5463
/ ndf 2
! 263.3 / 87
a 636 ± 14.9
b 6.349 ± 0.137
(deg.) "
0 10 20 30 40 50 60 70 80 90
"
dN/d
0 20 40 60 80 100 120 140 160
Entries 5463
/ ndf 2
! 263.3 / 87
a 636 ± 14.9
b 6.349 ± 0.137
Entries 5463 / ndf 2
! 350.8 / 179 c 28.39 ± 0.40
(deg.) "
0 50 100 150 200 250 300 350
"
dN/d
0 10 20 30 40 50 60
Entries 5463 / ndf 2
! 350.8 / 179 c 28.39 ± 0.40
Fig. 6. Zenithθ(top) and azimuthal anglesφ(bottom) distribution for the measured showers. Theθdistribution is fitted with a func-tion given by Eq. (1). Theφdistribution is fitted with a constant.
Acknowledgements. The authors are deeply thankful to the
KASCADE collaboration for kindly providing us some of the scintillators previously used for their experiment. The authors are also grateful to both the anonymous referees for constructive comments.
Edited by: R. Vainio
Reviewed by: A. Chilingarian and another anonymous referee
References
Antoni T., Apel, W. D., Badea, F., et al.: The cosmic-ray experiment KASCADE, Nucl. Instrum. Meth. A, 513, 490, 2003.
Apel, W. D., Arteaga, J. C., Asch, T., et al.: Lateral distribution of the radio signal in extensive air showers measured with LOPES, Astropart. Phys., 32, 294, 2010.
Falcke, H., Apel, W. D., Badea, A. F., et al.: Detection and imag-ing of atmospheric radio flashes from cosmic ray air showers, Nature, 435, 313, 2005.
H¨orandel, J. R.: Cosmic Rays from the Knee to the Second Knee:. 1014 to 1018 eV, Mod. Phys. Lett. A, 22, 1533, 2007.
H¨orandel, J. R., B¨ahren, L., Buitink, S., et al.: LOFAR - A new experiment to record radio emission from cosmic particles, Nucl. Phys. B, 196, 289, 2009.
Horneffer, A., B¨ahren, L., Buitink, S., et al.: Cosmic ray and neu-trino measurements with LOFAR, Nucl. Instrum. Meth. A, 617, 482, 2010.
Scholten, O.: Ultra-high-energy cosmic ray and neutrino physics using the Moon, J. Phys. Conf. Ser., 239, 012003, 2010. van den Berg, A. M. for the Pierre Auger Collaboration: Radio