R E S E A R C H A R T I C L E
Open Access
TREM2 brain transcript-specific studies in
AD and TREM2 mutation carriers
Jorge L. Del-Aguila
1,2,3, Bruno A. Benitez
1,2,3, Zeran Li
1,2,3, Umber Dube
1,2,3, Kathie A. Mihindukulasuriya
1,2,
John P. Budde
1,2,3, Fabiana H. G. Farias
1,2,3, Maria Victoria Fernández
1,2,3, Laura Ibanez
1,2,3, Shan Jiang
1,3,
Richard J. Perrin
3,4,5, Nigel J. Cairns
3,4,5,6, John C. Morris
4,5, Oscar Harari
1,2,3,4and Carlos Cruchaga
1,2,3,4*Abstract
Background:Low frequency coding variants in TREM2 are associated with Alzheimer disease (AD) risk and
cerebrospinal fluid (CSF) TREM2 protein levels are different between AD cases and controls. Similarly, TREM2 risk variant carriers also exhibit differential CSF TREM2 levels. TREM2 has three different alternative
transcripts, but most of the functional studies only model the longest transcript. No studies have analyzed TREM2 expression levels or alternative splicing in brains from AD and cognitively normal individuals. We wanted to determine whether there was differential expression of TREM2 in sporadic-AD cases versus AD-TREM2 carriers vs sex- and aged-matched normal controls; and if this differential expression was due to a particular TREM2 transcript.
Methods: We analyzed RNA-Seq data from parietal lobe brain tissue from AD cases withTREM2variants (n= 33), AD cases (n= 195) and healthy controls (n= 118), from three independent datasets using Kallisto and the R package tximport to determine the read count for each transcript and quantified transcript abundance as transcripts per million. Results:The threeTREM2transcripts were expressed in brain cortex in the three datasets. We demonstrate for the first time that the transcript that lacks the transmembrane domain and encodes a soluble form of TREM2 (sTREM2) has an expression level around 60% of the canonical transcript, suggesting that around 25% of the sTREM2 protein levels could be explained by this transcript. We did not observe a difference in the overallTREM2expression level between cases and controls. However, the isoform which lacks the 5′exon, but includes the transmembrane domain, was significantly lower inTREM2- p.R62H carriers than in AD cases (p= 0.007).
Conclusion:Using bulk RNA-Seq data from three different cohorts, we were able to quantify the expression level of the threeTREM2transcripts, demonstrating: (1) all three transcripts of them are highly expressed in the human cortex, (2) that up to 25% of the sTREM2 may be due to the expression of a specific isoform and not TREM2 cleavage; and (3) thatTREM2risk variants do not affect expression levels, suggesting that the effect of theTREM2variants on CSF levels occurs at post-transcriptional level.
Keywords:TREM2, RNAseq, Soluble TREM2, R47H, Alzheimer’s disease, Brain transcripts, Risk variants
© The Author(s). 2019Open AccessThis article is distributed under the terms of the Creative Commons Attribution 4.0 International License (http://creativecommons.org/licenses/by/4.0/), which permits unrestricted use, distribution, and reproduction in any medium, provided you give appropriate credit to the original author(s) and the source, provide a link to the Creative Commons license, and indicate if changes were made. The Creative Commons Public Domain Dedication waiver (http://creativecommons.org/publicdomain/zero/1.0/) applies to the data made available in this article, unless otherwise stated.
* Correspondence:[email protected];[email protected] 1Department of Psychiatry, Washington University School of Medicine, St.
Louis, MO, USA
2
NeuroGenomics and Informatics, Washington University School of Medicine, St. Louis, MO, USA
Introduction
The Triggering Receptor Expressed in Myeloid cells 2 (TREM2) is a type 1 transmembrane receptor protein
expressed on myeloid cells including microglia,
monocyte-derived dendritic cells, osteoclasts and
bone-marrow derived macrophages [1, 2]. TREM2
pos-sesses an immunoglobulin-like extracellular domain, a transmembrane region and a short cytoplasmatic tail. In the brain, it is primarily expressed by microglia and has been shown to control two signaling pathways: regula-tion of phagocytosis and suppression of inflammatory reactivity [3, 4]. In the case of phagocytosis, there is a very strong relationship between TREM2 and the adaptor protein DAP12, also called TYROBP [5].
Homo-zygous loss-of-function mutations in TREM2or DAP12
cause a rare and fatal disease known as Nasu-Hakola disease (NHD) or polycystic lipomembranous osteodys-plasia with sclerosing leukoencephalopathy (PLOSL) which is characterized by an early-onset frontotemporal dementia-like phenotype and bone cysts [6, 7]. One of the leading hypotheses to explain the pathology
associ-ated with NHD is that lack of activity of TREM2 or
DAP12causes microglia inactivation and the accumula-tion of necrotic debris from apoptotic neurons [8].
This relationship with NHD prompted an effort to identify allelic variants in theTREM2coding region that could also confer risk to Alzheimer’s disease. In 2013, several studies found that heterozygous expression of
TREM2 p.R47H [9–24] and p.D87N [15] variants were significantly associated with AD risk. Other variants as-sociated with the risk of AD include p.D87N [13, 15], p.R62H [17,24], p.L211P, p.T96K and p.H157Y [16,17]. Among all these variants, p.R47H was validated in neuropathological-confirmed cases [25] and was shown to increase the risk for late onset AD to a similar extent as the ApoE ɛ4 allele [15, 18]. However, the functional impact of the variant is not completely understood. In in-vitro studies, p.R47H has been shown to reduce the
binding of Aβ oligomers, APOE and phosphatidylserine
due to structural changes in TREM2 [26–29]. In in-vivo
studies, the expression of human p.R47H in Trem2
knockout mice suggested that the mutation confers a loss-of-function phenotype [30]. In 2018, two
independ-ent studies [31, 32] generated Trem2 R47H knock-in
mice using CRISPR/Cas 9 technology. Both mice showed
reduced Trem2 mRNA and protein levels, however the
study from Xinag et al. [32] found that TREM2 mRNA
level in IPSC-derived human microglia-like cells and in patients’brains with p.R47H were normal.
Most of TREM2 AD-risk variants are located in exon
2, which codes for the Ig-like V type domain, suggesting a possible modification in the interaction between TREM2 and its ligands. Only two other risk variants as-sociated to AD are located in different exons, p.H157Y
in exon 3 and p.L211P in exon 4 of the transcript that encodes the soluble form of TREM2 [15]. Kober et al. [33], presents an interesting hypothesis regarding loss of
function in TREM2. In NHD, the TREM2 protein is not
expressed, or it is expressed in a misfolded form that does not appear in the membrane; either scenario leads to a complete loss of function and a severe early-onset dementia. In AD, the risk variants are expressed in the cell membrane, but their binding capacity is lower than that of the WT, leading to a partial loss of function caus-ing a less severe late-onset dementia. This hypothesis could explain why heterozygous NHD variants, includ-ing p.Q33X, p.Y38C, and p.T66 M, have been found in rare AD cases in heterozygous sate [15].
In 2014, it was reported that there are at least three
TREM2 transcripts that are expressed in human brain [17]. The first isoform, ENST00000373113, is the canon-ical and the longestTREM2transcript which consists of five exons. This transcript has a transmembrane domain, and it is the transcript that is normally modeled in func-tional studies. The second isoform, ENST00000373122, lacks exon 5, is the second longest transcript, and also includes the transmembrane domain. Both isoforms are anchored to the cell membrane due to their transmem-brane domain, and both isoforms can undergo a sequential proteolytic processing by disintegrin and metalloprotein-ase domain-containing protein (ADAM) family, including ADAM10 and ADAM17, leading to the shedding of the ectodomain and producing a soluble TREM2 [34,35]. The third isoform, ENST00000338469, is the shortest with an alternative spliced isoform that excludes exon 4. This
iso-form most likely encodes a soluble iso-form of TREM2
(sTREM2) due to the lack of exon 4 which encodes the transmembrane domain of the receptor.
A recent study [36] has shown the relevance of
cere-brospinal fluid (CSF) sTREM2 as a biomarker for AD
progression due to its elevation in AD patients. It is un-known whether the sTREM2 is only the cleavage prod-uct of the cell-surface expressed protein or also the expression of the shortest soluble form.
The goal of this study is to quantify the expression level of the threeTREM2transcripts in AD and control brains, to determine whether there is differential
expres-sion of TREM2 in the three groups, sporadic-AD cases
(cases), AD-TREM2 (TREM2-carriers) carriers and con-trols (concon-trols) and finally to determine whether these differences are due to the differential expression of a
particularTREM2isoform.
Materials and methods
Subjects and samples
MSBB-BM36, (132 participants) and MCBB (162 partici-pants) all of whom were European-Americans. Briefly, the Knight-ADRC cohort included 15 participants with late-onset AD (NIA-AA criteria: intermediate or high) [37]
with known risk variants in TREM2 gene (Table 2), 12
non-demented controls and 39 sporadic late-onset AD cases. Because the variants p.D87N and p.R136W were as-sociated with NHD and likely lead to neurodegeneration through a different mechanism from that of the AD risk variants, they were not used in the meta-analysis for
TREM2 carriers. For MSBB-BM36, the number of non-demented control and sporadic late-onset AD cases were 28 and 93, respectively, and a total of 11 AD cases car-ried a TREM2 risk variant (see Table 2). In the case of MSBB-BM36, there were 78 non-demented controls, 77 sporadic late-onset AD, and 7 AD cases with a TREM2 risk variant (see Table 2). The RNA quality for samples in the study was good, with an average RNA integrity (RIN) num-ber over five in all the cohorts. The age of death was also consistent in all cohorts, with a mean over 80 years old.
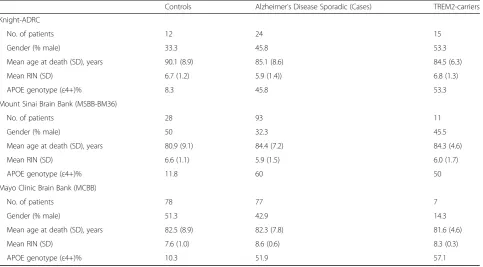
Table 1Demographic Characteristics of study participants
Controls Alzheimer’s Disease Sporadic (Cases) TREM2-carriers
Knight-ADRC
No. of patients 12 24 15
Gender (% male) 33.3 45.8 53.3
Mean age at death (SD), years 90.1 (8.9) 85.1 (8.6) 84.5 (6.3)
Mean RIN (SD) 6.7 (1.2) 5.9 (1.4)) 6.8 (1.3)
APOE genotype (ε4+)% 8.3 45.8 53.3
Mount Sinai Brain Bank (MSBB-BM36)
No. of patients 28 93 11
Gender (% male) 50 32.3 45.5
Mean age at death (SD), years 80.9 (9.1) 84.4 (7.2) 84.3 (4.6)
Mean RIN (SD) 6.6 (1.1) 5.9 (1.5) 6.0 (1.7)
APOE genotype (ε4+)% 11.8 60 50
Mayo Clinic Brain Bank (MCBB)
No. of patients 78 77 7
Gender (% male) 51.3 42.9 14.3
Mean age at death (SD), years 82.5 (8.9) 82.3 (7.8) 81.6 (4.6)
Mean RIN (SD) 7.6 (1.0) 8.6 (0.6) 8.3 (0.3)
APOE genotype (ε4+)% 10.3 51.9 57.1
Table 2Number of subjects with the TRME2 variants in each study
TREM2 Variants Knight-ADRC Mount Sinai Brain Bank (MSBB-BM36) Mayo Clinic Brain Bank (MCBB)
p.D87Na 1 0 0
p.G219C 0 0 0
p.R62C 0 1 0
p.E151K 0 0 0
p.H157Ya 1 0 0
p.L211P_T96K 1 0 0
p.R136Wa 1 0 0
p.R52H 1 0 0
p.L133 L 0 1 1
p.R47H 4 6 1
p.R62H 8 3 5
a
Washington University in St. Louis knight-ADRC brain bank
Brain tissue was provided by the Washington University in St. Louis Charles F. and Joanne Knight Alzheimer’s Disease Research Center Brain Bank (Knight ADRC), all cases were recruited as research participants and under-went a standard battery of tests [38]. Clinical Dementia Rating (CDR) scores were obtained and the estimated CDR at the time of death was determined by telephone interview [39]. Neuropathological assessment was under-taken by NJC and RJP, with each case assessed using the NIA-AA neuropathologic diagnostic criteria. Additional postmortem data including post-mortem interval and brain weight were also available [40].
From these clinically and neuropathologically well-characterized cases [41], one to two grams of frozen (−80C) parietal lobe tissue (inferior parietal lobe) was dissected and made available for this study. For each case, post-mortem consent for a brain-only autopsy brain was obtained and was approved by Washington University in St. Louis institutional review board. Briefly, RNA was extracted from frozen brain tissues using the Tissue Lyser LT and RNeasy Mini Kits (Qiagen, Hilden,
Germany) following the manufacturer’s instructions.
RIN and DV200 were measured with the RNA 6000 Pico Assay on the Bioanalyzer 2100 (Agilent Technologies). The RIN is determined by the Bioanalyzer, taking into account the entire electrophoretic trace of the RNA in-cluding the presence or absence of degradation products. All the RIN values were acceptable for further analysis. The DV200 value is defined as the % of nucleotides greater than 200 nt. Each sample yield was determined by the Quant-iT RNA Assay (Life Technologies) on the Qubit Fluorometer (Fisher Scientific). The cDNA librar-ies were prepared with the TruSeq Stranded Total RNA Sample Prep with Ribo-Zero Gold kits (Illumina) and then sequenced by HiSeq 4000 (Illumina) at the McDon-nell Genome Institute, Washington University in St. Louis. RNA-seq paired end reads with a read length of 2 × 150 bp were generated using Illumina HiSeq 4000 with a mean coverage of 80 million reads per sample.
Mayo Clinic brain Bank (MCBB)
Mayo Clinic Brain Bank RNA-seq data was downloaded from the AMP-AD portal (synapse ID = 5,550,404; accessed January 2017). Paired end reads of 2 × 101 base pairs were generated by the Illumina HiSeq 2000 sequencer, for an average of 134.9 million reads per sam-ple. RNA-seq based transcriptome data was generated from post-mortem brain tissue collected from the cere-bellum (273 samples) and temporal cortex (275 samples) of Caucasian subjects. For this study, the temporal cortex samples were chosen. RNA was extracted using Trizol® and cleaned with the Qiagen RNeasy kit. RIN
measurements were performed with Agilent Technolo-gies 2100 Bioanalyzer. Libraries were prepared by the Mayo Clinic Medical Genome Facility Gene Expression and Sequencing Cores with the TruSeq RNA Sample Prep Kit (Illumina).
Mount Sinai brain Bank (MSBB)
Mount Sinai Brain Bank RNA-seq data was downloaded from the AMP-AD portal (synapse ID = 3,157,743; accessed January 2017). Single end reads of 100 nucleo-tides were generated by the Illumina HiSeq 2500 System (Illumina, San Diego, CA), for an average of 38.7 million reads per sample. (Bank, 2016 #3723). It contains 1030 samples collected from four post-mortem brain regions of 300 subjects: the anterior prefrontal cortex (BM10), the superior temporal gyrus (BM22), parahippocampal gyrus (BM36), and the inferior frontal gyrus (BM44). RNA-seq was generated using the TruSeq RNA Sample Preparation Kit v2 and Ribo-Zero rRNA removal kit
(Illumina, San Diego, CA) [https://www.synapse.org/
#!Synapse:syn3157743]. The parahippocampal gyrus (BM36) is a cortical region in the medial temporal lobe that projects to surrounds the hippocampus and plays an important role in both spatial memory [42] and navi-gation [43, 44]. For this reason, BM36 was selected for further analysis for this study.
TREM2 variant calling
For Knight ADRC, TREM2 was sequenced using
pooled-DNA sequencing designed as described previ-ously [45]. All polymorphisms were validated by Seque-nom and KASPar genotype for each individual included in the pool. For Mayo and the Mount Sinai datasets,
TREM2variant calling was performed separately for 30X WGS as described before [46–48], following GATK’s 3.6 Best Practices (https://www.broadinstitute.org/gatk/) Variants were called in a region defined by the capture targets of the Agilent SureSelect Human All Exon V5 Kit, plus 100 bp of padding added to each capture target end. WGS data was filtered to remove low complexity regions, and regions with excessive depth. Only those variants that scored above the 99.5% confidence thresh-old were considered for analysis; additional variant filters included allele-balance (AB = 0.3–0.7). We also per-formed variant calling in the RNA-seq to determine if the TREM2 variants were expressed. We confirm that in all cases the alternative allele is expressed validating the genotypes for all individuals.
RNA-seq expression quantification
(ver 2.8.2) to examine read distribution across the gen-ome. We employed Kallisto (v0.42.5) [50] and tximport [51] to determine the read count for each transcript and quantified transcript abundance as transcripts per kilobase per million reads mapped (TPM), using gene annotation ofHomo sapiensreference genome (GENCODE GRCh37) for each participant from Knight-ADRC, MCB and MSBB-BM36 independently, with the following parame-ters: -t 10 -b 100. Then we summed the read counts and TPM of all alternative splicing transcripts of a gene to obtain gene expression levels. Due to the positive skew-ness of TPM values, we calculate their logarithm10 (log10TPM) for further analysis.
Immunoprecipitation
Immunoprecipitation was performed as previously de-scribed [52]. In brief, brain tissue were lysed in T-PER buffer (Thermo Scientific) and 1X Protease Inhibitor Cocktail (Sigma-Aldrich). Brain homogenate were pre-cleared for 1 h at 4 °C with 20 uL of Pierce™ Protein G Agarose (Thermo Scientific). TREM2 protein was immunoprecipitated overnight at 4 °C with 5μg of puri-fied mouse monoclonal anti-TREM2 antibodies directed against the extra-cellular portion of human TREM2 pro-tein (clone 20G2 and 29E3). 20μL of Protein G agarose were added to the antigen-antibody complex and incu-bated for 2 h at room temperature. Precipitates were washed four times in cold phosphate buffer saline (PBS) with protease inhibitors (Sigma-Aldrich). SDS gel-load-ing buffer was added to the complex-bound resin,
incu-bated for 5 min at 95 °C, separated by SDS–PAGE,
transferred to PVDF membranes (BIO-RAD) and probed with the mouse anti-TREM-2 mAbs supernatants (clones 10B11 and 21E10). Densitometric semi-quantifi-cation was performed using ImageJ software (National Institutes of Health) [53].
Statistical analysis
We employed a linear regression model to test the associ-ation between the log10TPM and each comparison group (R Foundation for Statistical Computing, ver.3.3.3) for the Knight-ADRC, MCBB and MSBB (BM36) cohorts. RIN number, age at death and gender were used as covariates for each analysis. All studies showed different absolute log10TPM values, due to the different library preparation or brain region. Therefore, for the meta-analysis, we used Stouffer’s Z-score method, which is based on Z-scores ra-ther thanp-values, allowing incorporation of study weights based on the sample size for each cohort. The definition of statistical significance was nominalP-value (p< 0.05) and the same direction of effects (that is, the sign ofβ) in each study to avoid discounting true positive associations.
Results
All threeTREM2transcripts are highly expressed in human cortex
We first wanted to determine whetherTREM2transcripts are expressed in the brain cortex, then to quantify each transcript to determine their relative abundance and pos-sible importance. In order to be able to combine and com-pare expression levels across datasets, we normalized the log10TPM using the mean expression of the longest tran-script as a reference. Log10TPM counts and analyses re-sults can be found in the Additional file (Additional file1:
Table S1). We found that the canonical TREM2
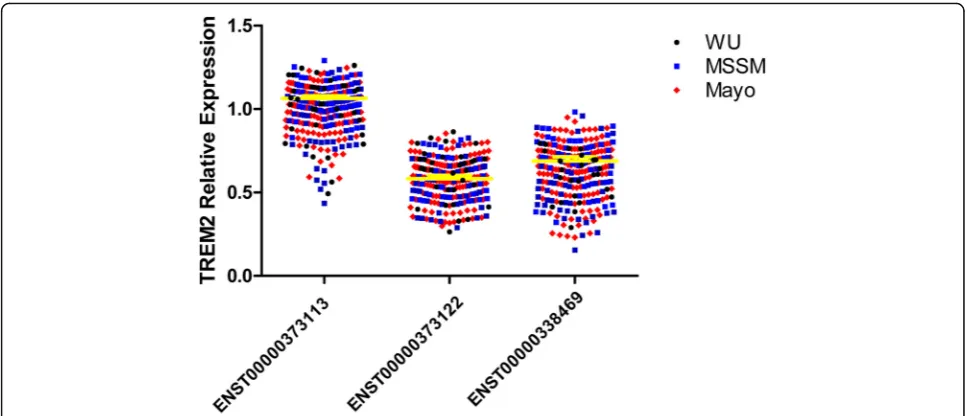
(ENST00000373113) transcript has significantly higher ex-pression than the other two transcripts (p= 1.13 × 10−120 and 4.76 × 10−107, respectively, Fig.1, Tables3and4). The transcript that encodes the soluble TREM2 isoform (ENST00000338469) had the second highest expression level, and it is expressed at 62% of the canonical transcript. The transcript with the lowest expression level is the tran-script that encodes a shorted transmembrane protein (ENST00000373122) and is expressed at 58% of the level of the canonical transcript. This transcript also showed a significantly lower level of expression than the transcript that encodes the soluble form (p= 0.0003).
We also performed similar analyses for stratified by case-control status, and for each dataset, separately. The expression levels were very consistent across datasets and independent of case-control status (Fig. 1, Tables 3
and 4). The relative expression of the transcript that encodes the soluble form (ENST00000338469) ranges from 53 to 65% of that of the canonical transcript (ENST00000373113) and for the ENST00000373122 transcript, expression ranges from 55 to 61%. This data confirms that the three isoforms are expressed and that does not correlate with case-control status, and that up to 25% of the extracellular sTREM2 could be due to the expression of the ENST00000338469 isoform and not a product of TREM2 cleavage.
Correlation with protein levels
In order to determine if the transcript levels correlate with protein levels, we quantified TREM2 protein levels by Western Blot on 10 parietal brain samples from the Knight-ADRC that RNA-seq data was also
available. We detected two bands (Additional file 1:
Figure S1); the 50kD band correspond to the full
length TREM2 [34]. The second band located ~30kD,
which matches to the sTREM2 found in cerebrospinal fluid [52]. Then, we quantified the band correspond-ing to the sTREM2 band and analyzed if there was a correlation with the sTREM2 band with the different transcripts. We found a very strong correlation
be-tween the sTREM2 band vs the total mRNA TREM2
sTREM2 band shown a correlation with the canonical
isoform (R2= 0.73 p< 0.05) and the isoform that
codify for the soluble transcript (R2= 0.42 p< 0.05), but not for the other transcript (R2= -0.13 p> 0.05).
TREM2 expression levels are not affected by disease status
Since CSF sTREM2 levels are significantly different in AD cases vs controls, our next step was to determine
whether the overall TREM2 gene expression and its
transcript specific expression were associated with case-control status. For these analyses, TREM2 carriers were not included. The overallTREM2expression levels were higher in AD cases compared to controls, but this difference was not statistically significant (p= 0.11, Table 5). Similar results were found for the canonical transcript. However, we found a nominal association
between the transcript that encodes sTREM2, in which
Fig. 1Relative quantification of the expression of each isoform in Alzheimer’s disease cases, controls andTREM2risk variant carriers. Total log10 RNA count was calculated using Kallisto and the results were expressed relative to the log10RNA counts of the common transcript ENST00000373113. There is a clear overlapping distribution for each of the studies, the yellow line represents the mean overall value for each transcript among the different studies. There were different expression counts among the different transcripts (see Table5)
Table 3Relative quantification of the expression of each isoform with ENST00000373113 as control
Study Conditions ENST00000373113 (canonical transcript) ENST00000373122 ENST00000338469 (soluble TREM2)
All Control + Case 1.00 0.58 0.62
Control 0.97 0.56 0.62
Case 1.02 0.58 0.63
Knight-ADRC Control + Case 1.00 0.61 0.60
Control 0.97 0.56 0.53
Case 1.01 0.64 0.63
MSBB-BM36 Control + Case 1.00 0.56 0.61
Control 0.94 0.55 0.60
Case 1.02 0.56 0.61
MCBB Control + Case 1.00 0.58 0.64
Control 0.98 0.57 0.63
Case 1.02 0.60 0.64
ENST00000373113 canonical transcript ENST00000373122
AD cases have higher transcript levels (p= 0.04, Table5). These results were consistent across datasets replicating this finding (Additional file1: Tables S2-S4).
TREM2risk variants do not affect TREM2 expression levels or disease status
We also decided to analyze whether theTREM2risk var-iants (mainly p.R47H and p.R62H) were associated with TREM2 expression levels. We also included some vari-ants that in homozygosity cause NHD, although in this study all the individuals with NHD variants are in a heterozygous state. NHD variants are loss-of-function variants that lead to very low TREM2 cell surface ex-pression and low sTREM2 levels [36]. AD risk variants
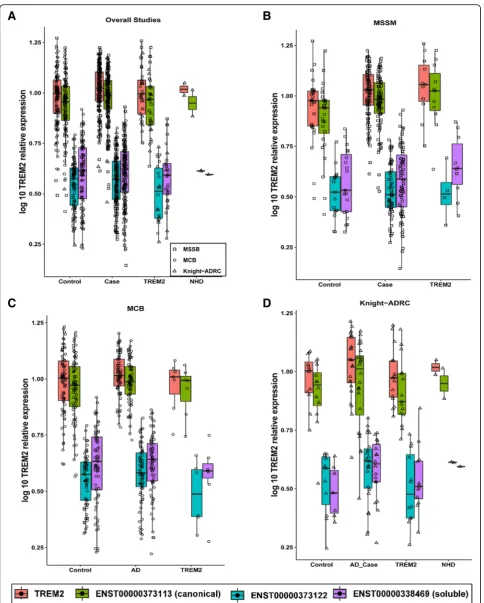
have also been postulated to be partial loss-of-function. Although, it is known that the loss-of-function for the NHD variants requires a post-transcriptional event, we wanted to confirm that these NHD or AD-risk variants have no effect at the mRNA level. We found that NHD variant-carriers have similar TREM2expression levels to AD cases, controls and other TREM2 variants (Fig. 2). We also did not see any specificTREM2transcript effect for the NHD variants. All the transcripts were expressed at similar levels than in non-mutation carriers.
Then, we determined if the overallTREM2or specific
transcript levels were significantly different between
TREM2 variant carriers (anyTREM2 variant) and cases or controls. We did not find any significant association,
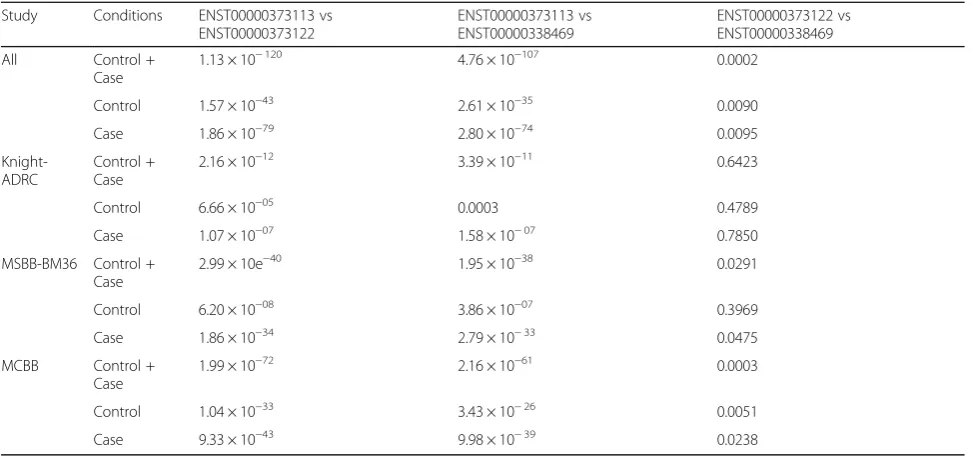
Table 4Wilcoxon test for unpaired two independent groups
Study Conditions ENST00000373113 vs
ENST00000373122
ENST00000373113 vs ENST00000338469
ENST00000373122 vs ENST00000338469
All Control +
Case
1.13 × 10−120 4.76 × 10−107 0.0002
Control 1.57 × 10−43 2.61 × 10⁻³⁵ 0.0090
Case 1.86 × 10−79 2.80 × 10−74 0.0095
Knight-ADRC
Control + Case
2.16 × 10⁻¹² 3.39 × 10⁻¹¹ 0.6423
Control 6.66 × 10−05 0.0003 0.4789
Case 1.07 × 10−07 1.58 × 10−07 0.7850
MSBB-BM36 Control + Case
2.99 × 10e−40 1.95 × 10−38 0.0291
Control 6.20 × 10−08 3.86 × 10−07 0.3969
Case 1.86 × 10⁻³⁴ 2.79 × 10⁻³³ 0.0475
MCBB Control +
Case
1.99 × 10−72 2.16 × 10−61 0.0003
Control 1.04 × 10⁻³³ 3.43 × 10⁻²⁶ 0.0051
Case 9.33 × 10−43 9.98 × 10−39 0.0238
Table shows thep-value for the test comparison among studies and each isoforms: ENST00000373113 canonical transcript
ENST00000373122
ENST00000338469 soluble TREM2
Table 5TREM2 is similarly expressed in AD, controls and TREM2 risk variant carriers
OverallTREM2 ENST00000373113 (canonical transcript) ENST00000373122 ENST00000338469 (soluble TREM2)
Control vs Case 0.11 0.2 0.19 0.04c
Control vs TREM2-carriers 0.40 0.39 0.31 0.39
Case vsTREM2-carriers 0.11 0.26 0.19 0.15
Control vs p.R47Ha 0.33 0.34 0.15 0.06
Case vs p.R47Ha 0.24 0.38 0.35 0.11
Control vs p.R62H 0.41 0.48 0.06b 0.25
Case vs p.R62H 0.17 0.20 0.007b 0.22
Table shows the p–value for the meta-analysis for Knight-ADRC, Mayo Clinic Brain Bank and Mount Sinai Brain Bank Meta-analyses was performed using the Zscore Method
Statistical significant results with the same effect size direction are shown in red
a
Data only available for Knight-ADRC and Mount Sinai Brain Bank
b
Data only available for Knight-ADRC and Mayo Clinic Brain Bank
c
although TREM2-carriers showed nominally significant
lower levels of the ENST00000373122 transcript
(shorter, transmembrane protein) compared to controls (Fig.2and Table5).
Finally, we performed specific analyses for the p.R47H and p.R62H variants. We did not find any significant dif-ference in the overall or transcript-specificTREM2levels for the p.R47H variant. On the other hand, we found that the p.R62H variant carriers have significantly lower
expression of the second transmembrane TREM2
tran-script (ENST00000373122) than cases (p= 0.007), and
have lower expression compared to controls, although this difference is not statistically significant (Fig. 2 and Table 5). We did not find any difference for the other two transcripts or for the overall expression, suggesting that this effect is transcript specific.
Discussion
Various studies suggest that TREM2 and its variants
contribute to the pathogenesis of AD [54], Parkinson’s Disease [55], and Amyotrophic Lateral Sclerosis risk [56]. However, it remains unclear ifTREM2is a pro- or anti-inflammatory molecule [57]. For instance, in studies
in macrophages or microglia,TREM2expression reduces
the inflammatory response [4,58–60], while in dendritic
cells, TREM2 expression exacerbates the inflammatory
response [2, 61]. Due to these apparently conflicting
results, a hypothesis was developed in which TREM2
function depends on which cell type it is expressed. Therefore, if the cells are part of the innate immune sys-tem,TREM2acts as an anti-inflammatory molecule, but
if they are part of the adaptive immune system,TREM2
acts as a pro-inflammatory molecule. Most of the
current research has been focused on TREM2 gene
expression levels and the TREM2 variants associated
with AD risk, however most of the studies have only focused on the canonical transcript, and not the activity or expression levels of the TREM2 isoforms. It is also important to determine the expression levels of the three
TREM2 transcripts, as it is important to distinguish
between the expression of the soluble TREM2 isoform
(ENST00000338469) and the s TREM2 produced by proteolytic cleavage. It is known that sTREM2 plays a role in AD pathogenesis [54] and can be used as bio-marker for AD. Interestingly, the results from these studies shown that TREM2 levels are higher in AD indi-viduals in CSF samples [36], which are consistent with our results at mRNA levels. However, one of the three
TREM2 transcripts expresses a soluble form of TREM2 that could be also be released extracellularly and be part of the overall pool of sTREM2 levels. Therefore, if we are to understand the role of sTREM2 in disease, we need to determine all the potential origins of this protein.
The expression of the threeTREM2transcripts in brain was initially reported by Jin et.al [17]. In other studies, the expression of the canonical transcript (ENST00000373113) was the highest [62], followed by the transcript which encodes solubleTREM2(ENST00000338469) [63]. In this study, we used a large cohorts, totaling 345 samples to analyze not only the expression levels of the threeTREM2 transcripts but also to determine the association of AD case-control status and theTREM2risk variants with the expression levels.
We were able to detect and quantify the levels of three
TREM2 transcripts ENST00000373113, ENST000003 73122 and ENST00000338469 using RNA-seq data from AD and control brains from three different, independent studies. Our analyses indicate that the canonical tran-script (ENST00000373113) is expressed at twice the level of the other two other transcripts, and that this dif-ference is very consistent across studies and between cases and controls. Even with this, our results indicate that the transcript that encodes sTREM2 represents the 25% of the total TREM2 mRNA suggesting that around
20–25% of the sTREM2 might be due to the expression
of this transcript and not the cleavage of the cell mem-brane bound TREM2. In order to try to determine how much of the sTREM2 is produced by each transcript, we quantify total and sTREM2 from brain homogenates using Western-blots. As expected, we found a strong correlation of the sTREM2 band with the total TREM2 mRNA (R2= 0.77 p< 0.05) and the canonical transcript (R2= 0.73 p< 0.05). But we also found a strong and sig-nificant correlation with the transcript that codify for the soluble TREM2 transcript (R2= 0.42 p< 0.05). This data supports that a proportion of the sTREM2 could be the results of the expression of the transcript that codify for the soluble isoform. However, there are several limi-tations to this experiment. Antibody-based detection assays are not able to distinguish between sTREM2 that
was generated by proteolytic processing [35] or by
experimental techniques are needed to determine the ori-gin of the soluble and extracellular presence of sTREM2.
In any case, recent studies indicate that minor
changes in sTREM2 levels, of around 7–10% are
enough to modulate AD risk [54, 65]. Therefore
changes of expression levels by 25% should have a large impact on AD risk. Additional research to understand
transcript specific TREM2 regulation and determine
the origin of sTREM2 are needed to fully understand the biology of TREM2.
Two previous papers [31, 32], that generated Trem2 R47H knock-in mice using CRISPR/Cas 9 technology,
showed reduced Trem2 mRNA and protein levels,
although the same studies suggest that these results were an artifact due to some unspecific events linked to the genome editing. It is also known that NHD variants are
loss-of-function mutations. For instance, p.Y38C
disrupts the correct disulfide formation, p.T66 M desta-bilizes the protein expression and p.V126G disrupts hydrophobic core of the protein. Furthermore, p.Y38 and p.V126 are conserved within the TREM family [33], implying that they are probably required to preserve the common fold within this family of receptors leading to lower sTREM2 levels, due to post-transcriptional events. On the other hand, variants p.R47H, p.R62H, p.N68K, p.D87N and p.T96K lie on the protein surface and are related to AD risk. Based on the location of these vari-ants, we assumed that they would not affect surface ex-pression and instead impact ligand binding [33]. Several studies indicate that CSF TREM2 levels are increased in AD risk variant p.R47H carriers, but in this case it is not clear if this is post-transcriptional, at the mRNA level. In
our meta-analysis, the overall expression of TREM2 at
the gene level, and transcript-specific analyses in p.R47H
or NHD carriers,TREM2and its isoforms were not
sig-nificantly differentially expressed when compared to controls or AD cases, suggesting that the effects associ-ated with the p.R47H variant are also at the post-tran-scriptional level. On the other hand, our data indicate the p.R62H carriers showed a significant level of the ENST0000037312, which also encodes a transmem-brane TREM2 isoform. This finding could explain why TREM2 p.R62H carriers tend to have lower CSF TREM2 levels [36, 54].
Conclusion
This study demonstrates that the three TREM2
tran-scripts are highly expressed in human brains, and that
the transcript that encodes the soluble form of TREM2
might represent up to 25% of the soluble TREM2. Therefore, our results indicate that this transcript may play an important role in disease, and additional studies are needed to functionally characterize the rol of this transcript in disease. The implication of this transcript
in AD pathogenesis is also supported by the presence of AD risk variant that are only present in the transcript that codifies for the soluble form. [17]. Thus in order to understand the biology of TREM2, it is important to perform functional studies and create cell and animal models that interrogate the three transcripts, not only the canonical transcript.
In this study, we were able to demonstrate the
expres-sion of the three transcripts of TREM2 in postmortem
human brain, including the soluble transcript that does not include a transmembrane domain. We also found the AD-risk variants influenced the expression of specific transcripts.
Additional file
Additional file 1:Table S1.TREM2mean expression levels for each transcript and in each study.Table S2.Knight-ADRC results from each comparison group.Table S3.Mount Sinai Brain Bank (MSBB)–BM36 results from each comparison group. Table S4 Mayo Clinic Brain Bank (MCBB) results from each comparison group.Figure S1.Immuno precipitation sTREM2 in brain samples (DOCX 199 kb)
Abbreviations
AD:Alzheimer’s disease; ADAM: A disintegrin and metalloproteinase domain-containing protein; BM10: Anterior prefrontal cortex; BM22: Superior temporal gyrus; BM36: Parahippocampal gyrus; BM44: Inferior frontal gyrus; CDR: Clinical Dementia Rating; CSF: Cerebrospinal fluid; DAP12: DNAX activation protein of 12 kDa; Knight-ADRC: Washington University in St. Louis Charles F. and Joanne Knight Alzheimer’s Disease Research Center Brain Bank; log10TPM: Logarithm10 TPM; MCBB: Mayo Clinic Brain Bank; MSBB: Mount Sinai Brain Bank; NHD: Nasu-Hakola Disease; PLOSL: Polycystic Lipomembranous Osteodysplasia with Sclerosing Leukoencephalopathy; sTREM2: Soluble form of TREM2; TPM: Transcripts per Million reads mapped; TREM2: Triggering Receptor Expressed on Myeloid cells 2; TYROBP: TYRO protein tyrosine kinase binding protein
Acknowledgments
We thank all the participants and their families, as well as the many institutions and their staff that provided support for the studies involved in this collaboration.
Funding
This work was supported by grants from the National Institutes of Health (R01AG044546, P01AG003991, RF1AG053303, R01AG058501, U01AG058922, RF1AG058501 and R01AG057777), the Alzheimer Association (NIRG-11-200110, BAND-14-338165, AARG-16-441560 and BFG-15-362540). BAB is supported by 2018 pilot funding from the Hope Center for Neurological Disorders and the Danforth Foundation Challenge at Washington University. The recruitment and clinical characterization of research participants at Washington University were supported by NIH P50 AG05681, P01 AG03991, and P01 AG026276. This work was supported by access to equipment made possible by the Hope Center for Neurological Disorders, and the Departments of Neurology and Psychiatry at Washington University School of Medicine.
Availability of data and materials
1. Data for the Knight-ADRC is available to qualified investigators by ap-plying to the Knight ADRC website https://knightadrc.wustl.edu/Re-search/ResourceRequest.htm.
Data collection was supported through funding by NIA grants P50 AG016574, R01 AG032990, U01 AG046139, R01 AG018023, U01 AG006576, U01 AG006786, R01 AG025711, R01 AG017216, R01 AG003949, NINDS grant R01 NS080820, CurePSP Foundation, and support from Mayo Foundation. Study data includes samples collected through the Sun Health Research Institute Brain and Body Donation Program of Sun City, Arizona. The Brain and Body Donation Program is supported by the National Institute of Neurological Disorders and Stroke (U24 NS072026 National Brain and Tissue Resource for Parkinson’s Disease and Related Disorders), the National Institute on Aging (P30 AG19610 Arizona Alzheimer’s Disease Core Center), the Arizona Department of Health Services (contract 211002, Arizona Alzheimer’s Research Center), the Arizona Biomedical Research Commission (contracts 4001, 0011, 05–901 and 1001 to the Arizona Parkinson’s Disease Consortium) and the Michael J. Fox Foundation for Parkinson’s Research.
3. MSBB: These data were generated from postmortem brain tissue collected through the Mount Sinai VA Medical Center Brain Bank and were provided by Dr. Eric Schadt from Mount Sinai School of Medicine.
Authors’contributions
JLDA analyzed the RNAseq data, performed bioinformatics analyses, and wrote the manuscript. FF, ZL, UD, KM and OH performed the gene-expression analyses in human brain tissue. ZL, UD, MVF, LI, SJ and JB performed the QC for the all data. RP, NC, JM, OH, CC supervised and wrote the project. All authors read and approved the manuscript.
Ethics approval and consent to participate
The protocol of Knight-ADRC studies have been approved by the review board of Washington University in St. Louis. The protocol of Mayo dataset was approved by the Mayo Clinic Institutional Review Board (IRB). All neuropsychological, diagnostic and autopsy protocols of MSSM dataset were approved by the Mount Sinai and JJ Peters VA Medical Center Institutional Review Boards. The MSSM sample protocol was approved by Icahn School of Medicine at Mount Sinai IRB; All participants were recruited with informed consent for research use.
Consent for publication Not applicable
Competing interests
CC receives research support from: Biogen, EISAI, Alector and Parabon. The funders of the study had no role in the collection, analysis, or interpretation of data; in the writing of the report; or in the decision to submit the paper for publication. CC is a member of the advisory board of ADx Healthcare, and Vivid Genomics.
Publisher’s Note
Springer Nature remains neutral with regard to jurisdictional claims in published maps and institutional affiliations.
Author details
1
Department of Psychiatry, Washington University School of Medicine, St. Louis, MO, USA.2NeuroGenomics and Informatics, Washington University
School of Medicine, St. Louis, MO, USA.3Hope Center for Neurological Disorders, Washington University School of Medicine, St. Louis, MO, USA.
4
Knight Alzheimer’s Disease Research Center, Washington University School of Medicine, St. Louis, MO, USA.5Department of Neurology, Washington
University School of Medicine, St. Louis, MO, USA.6Department of Pathology and Immunology, Washington University School of Medicine, St. Louis, MO, USA.
Received: 20 November 2018 Accepted: 26 April 2019
References
1. Bouchon A, Dietrich J, Colonna M. Cutting edge: inflammatory responses can be triggered by TREM-1, a novel receptor expressed on neutrophils and monocytes. J Immunol. 2000;164:4991–5.
2. Bouchon A, Hernandez-Munain C, Cella M, Colonna M. A DAP12-mediated pathway regulates expression of CC chemokine receptor 7 and maturation of human dendritic cells. J Exp Med. 2001;194:1111–22.
3. Neumann H, Takahashi K. Essential role of the microglial triggering receptor expressed on myeloid cells-2 (TREM2) for central nervous tissue immune homeostasis. J Neuroimmunol. 2007;184:92–9.
4. Takahashi K, Prinz M, Stagi M, Chechneva O, Neumann H. TREM2-transduced myeloid precursors mediate nervous tissue debris clearance and facilitate recovery in an animal model of multiple sclerosis. PLoS Med. 2007;4:e124. 5. Klesney-Tait J, Turnbull IR, Colonna M. The TREM receptor family and signal
integration. Nat Immunol. 2006;7:1266–73.
6. Klunemann HH, Ridha BH, Magy L, Wherrett JR, Hemelsoet DM, Keen RW, De Bleecker JL, Rossor MN, Marienhagen J, Klein HE, et al. The genetic causes of basal ganglia calcification, dementia, and bone cysts: DAP12 and TREM2. Neurology. 2005;64:1502–7.
7. Paloneva J, Manninen T, Christman G, Hovanes K, Mandelin J, Adolfsson R, Bianchin M, Bird T, Miranda R, Salmaggi A, et al. Mutations in two genes encoding different subunits of a receptor signaling complex result in an identical disease phenotype. Am J Hum Genet. 2002;71:656–62. 8. Thrash JC, Torbett BE, Carson MJ. Developmental regulation of TREM2 and
DAP12 expression in the murine CNS: implications for Nasu-Hakola disease. Neurochem Res. 2009;34:38–45.
9. Benitez BA, Cooper B, Pastor P, Jin SC, Lorenzo E, Cervantes S, Cruchaga C. TREM2 is associated with the risk of Alzheimer's disease in Spanish population. Neurobiol Aging. 2013;34:1711 e1715–7.
10. Benitez BA, Jin SC, Guerreiro R, Graham R, Lord J, Harold D, Sims R, Lambert JC, Gibbs JR, Bras J, et al. Missense variant in TREML2 protects against Alzheimer's disease. Neurobiol Aging. 2014;35:1510 e1519–26. 11. Cuyvers E, Bettens K, Philtjens S, Van Langenhove T, Gijselinck I, van
der Zee J, Engelborghs S, Vandenbulcke M, Van Dongen J, Geerts N, et al. Investigating the role of rare heterozygous TREM2 variants in Alzheimer's disease and frontotemporal dementia. Neurobiol Aging. 2014;35:726 e711–29.
12. Finelli D, Rollinson S, Harris J, Jones M, Richardson A, Gerhard A, Snowden J, Mann D, Pickering-Brown S. TREM2 analysis and increased risk of Alzheimer's disease. Neurobiol Aging. 2015;36:546 e549–13. 13. Ghani M, Sato C, Kakhki EG, Gibbs JR, Traynor B, St George-Hyslop P,
Rogaeva E. Mutation analysis of the MS4A and TREM gene clusters in a case-control Alzheimer's disease data set. Neurobiol Aging. 2016;42(217): e217–217 e213.
14. Giraldo M, Lopera F, Siniard AL, Corneveaux JJ, Schrauwen I, Carvajal J, Munoz C, Ramirez-Restrepo M, Gaiteri C, Myers AJ, et al. Variants in triggering receptor expressed on myeloid cells 2 are associated with both behavioral variant frontotemporal lobar degeneration and Alzheimer's disease. Neurobiol Aging. 2013;34:2077 e2011–78.
15. Guerreiro R, Wojtas A, Bras J, Carrasquillo M, Rogaeva E, Majounie E, Cruchaga C, Sassi C, Kauwe JS, Younkin S, et al. TREM2 variants in Alzheimer's disease. N Engl J Med. 2013;368:117–27.
16. Jiang T, Tan L, Chen Q, Tan MS, Zhou JS, Zhu XC, Lu H, Wang HF, Zhang YD, Yu JT. A rare coding variant in TREM2 increases risk for Alzheimer's disease in Han Chinese. Neurobiol Aging. 2016;42:217 e211–3.
17. Jin SC, Benitez BA, Karch CM, Cooper B, Skorupa T, Carrell D, Norton JB, Hsu S, Harari O, Cai Y, et al. Coding variants in TREM2 increase risk for Alzheimer's disease. Hum Mol Genet. 2014;23:5838–46.
18. Jonsson T, Stefansson H, Steinberg S, Jonsdottir I, Jonsson PV, Snaedal J, Bjornsson S, Huttenlocher J, Levey AI, Lah JJ, et al. Variant of TREM2 associated with the risk of Alzheimer's disease. N Engl J Med. 2013;368: 107–16.
19. Lill CM, Rengmark A, Pihlstrom L, Fogh I, Shatunov A, Sleiman PM, Wang LS, Liu T, Lassen CF, Meissner E, et al. The role of TREM2 R47H as a risk factor for Alzheimer's disease, frontotemporal lobar degeneration, amyotrophic lateral sclerosis, and Parkinson's disease. Alzheimer's Dement. 2015;11:1407–16.
20. Mehrjoo Z, Najmabadi A, Abedini SS, Mohseni M, Kamali K, Najmabadi H, Khorram Khorshid HR. Association study of the TREM2 gene and Identification of a novel variant in exon 2 in Iranian patients with late-onset Alzheimer's disease. Med Princ Pract. 2015;24:351–4.
22. Ruiz A, Dols-Icardo O, Bullido MJ, Pastor P, Rodriguez-Rodriguez E, Lopez de Munain A, de Pancorbo MM, Perez-Tur J, Alvarez V, Antonell A, et al. Assessing the role of the TREM2 p.R47H variant as a risk factor for Alzheimer's disease and frontotemporal dementia. Neurobiol Aging. 2014;35:444 e441–4. 23. Slattery CF, Beck JA, Harper L, Adamson G, Abdi Z, Uphill J, Campbell T,
Druyeh R, Mahoney CJ, Rohrer JD, et al. R47H TREM2 variant increases risk of typical early-onset Alzheimer's disease but not of prion or frontotemporal dementia. Alzheimer's Dement. 2014;10:602–608 e604.
24. Yu JT, Jiang T, Wang YL, Wang HF, Zhang W, Hu N, Tan L, Sun L, Tan MS, Zhu XC, Tan L. Triggering receptor expressed on myeloid cells 2 variant is rare in late-onset Alzheimer's disease in Han Chinese individuals. Neurobiol Aging. 2014;35:937 e931–3.
25. Roussos P, Katsel P, Fam P, Tan W, Purohit DP, Haroutunian V. The triggering receptor expressed on myeloid cells 2 (TREM2) is associated with enhanced inflammation, neuropathological lesions and increased risk for Alzheimer's dementia. Alzheimer's Dement. 2015;11:1163–70.
26. Sudom A, Talreja S, Danao J, Bragg E, Kegel R, Min X, Richardson J, Zhang Z, Sharkov N, Marcora E, et al. Molecular basis for the loss-of-function effects of the Alzheimer's disease-associated R47H variant of the immune receptor TREM2. J Biol Chem. 2018;293:12634–46.
27. Wang Y, Cella M, Mallinson K, Ulrich JD, Young KL, Robinette ML, Gilfillan S, Krishnan GM, Sudhakar S, Zinselmeyer BH, et al. TREM2 lipid sensing sustains the microglial response in an Alzheimer's disease model. Cell. 2015; 160:1061–71.
28. Yeh FL, Wang Y, Tom I, Gonzalez LC, Sheng M. TREM2 binds to apolipoproteins, including APOE and CLU/APOJ, and thereby facilitates uptake of amyloid-Beta by microglia. Neuron. 2016;91:328–40. 29. Zhao Y, Wu X, Li X, Jiang LL, Gui X, Liu Y, Sun Y, Zhu B, Pina-Crespo JC,
Zhang M, et al. TREM2 is a receptor for beta-amyloid that mediates microglial function. Neuron. 2018;97:1023–31 e1027.
30. Song WM, Joshita S, Zhou Y, Ulland TK, Gilfillan S, Colonna M. Humanized TREM2 mice reveal microglia-intrinsic and -extrinsic effects of R47H polymorphism. J Exp Med. 2018;215:745–60.
31. Cheng-Hathaway PJ, Reed-Geaghan EG, Jay TR, Casali BT, Bemiller SM, Puntambekar SS, von Saucken VE, Williams RY, Karlo JC, Moutinho M, et al. The Trem2 R47H variant confers loss-of-function-like phenotypes in Alzheimer's disease. Mol Neurodegener. 2018;13:29.
32. Xiang X, Piers TM, Wefers B, Zhu K, Mallach A, Brunner B, Kleinberger G, Song W, Colonna M, Herms J, et al. The Trem2 R47H Alzheimer's risk variant impairs splicing and reduces Trem2 mRNA and protein in mice but not in humans. Mol Neurodegener. 2018;13:49.
33. Kober DL, Alexander-Brett JM, Karch CM, Cruchaga C, Colonna M, Holtzman MJ, Brett TJ. Neurodegenerative disease mutations in TREM2 reveal a functional surface and distinct loss-of-function mechanisms. eLife. 2016;5: e20391.https://doi.org/10.7554/eLife.20391.
34. Kleinberger G, Yamanishi Y, Suarez-Calvet M, Czirr E, Lohmann E, Cuyvers E, Struyfs H, Pettkus N, Wenninger-Weinzierl A, Mazaheri F, et al. TREM2 mutations implicated in neurodegeneration impair cell surface transport and phagocytosis. Sci Transl Med. 2014;6:243ra286.
35. Wunderlich P, Glebov K, Kemmerling N, Tien NT, Neumann H, Walter J. Sequential proteolytic processing of the triggering receptor expressed on myeloid cells-2 (TREM2) protein by ectodomain shedding and gamma-secretase-dependent intramembranous cleavage. J Biol Chem. 2013;288: 33027–36.
36. Piccio L, Deming Y, Del-Aguila JL, Ghezzi L, Holtzman DM, Fagan AM, Fenoglio C, Galimberti D, Borroni B, Cruchaga C. Cerebrospinal fluid soluble TREM2 is higher in Alzheimer disease and associated with mutation status. Acta Neuropathol. 2016;131:925–33.
37. Montine TJ, Phelps CH, Beach TG, Bigio EH, Cairns NJ, Dickson DW, Duyckaerts C, Frosch MP, Masliah E, Mirra SS, et al. National Institute on Aging-Alzheimer's Association guidelines for the neuropathologic assessment of Alzheimer's disease: a practical approach. Acta Neuropathol. 2012;123:1–11.
38. Mirra SS, Heyman A, McKeel D, Sumi SM, Crain BJ, Brownlee LM, Vogel FS, Hughes JP, van Belle G, Berg L. The consortium to establish a registry for Alzheimer's disease (CERAD). Part II. Standardization of the neuropathologic assessment of Alzheimer's disease. Neurology. 1991;41:479–86.
39. Morris JC. Clinical dementia rating: a reliable and valid diagnostic and staging measure for dementia of the Alzheimer type. Int Psychogeriatr. 1997;9(Suppl 1):173–6; discussion 177-178.
40. Gavett BE, John SE, Gurnani AS, Bussell CA, Saurman JL. The role of Alzheimer's and cerebrovascular pathology in mediating the effects of age, race, and apolipoprotein E genotype on dementia severity in
pathologically-confirmed Alzheimer's disease. J Alzheimer's Dis. 2016;49: 531–45.
41. Li Z, Del-Aguila JL, Dube U, Budde J, Martinez R, Black K, Xiao Q, Cairns NJ, Dominantly Inherited Alzheimer N, Dougherty JD, et al. Genetic variants associated with Alzheimer's disease confer different cerebral cortex cell-type population structure. Genome Med. 2018;10:43.
42. Squire LR, Zola-Morgan S. The medial temporal lobe memory system. Science. 1991;253:1380–6.
43. Aguirre GK, Detre JA, Alsop DC, D'Esposito M. The parahippocampus subserves topographical learning in man. Cereb Cortex. 1996;6:823–9. 44. Maguire EA, Burke T, Phillips J, Staunton H. Topographical disorientation
following unilateral temporal lobe lesions in humans. Neuropsychologia. 1996;34:993–1001.
45. Del-Aguila JL, Fernandez MV, Schindler S, Ibanez L, Deming Y, Ma S, Saef B, Black K, Budde J, Norton J, et al. Assessment of the genetic architecture of Alzheimer's disease risk in rate of memory decline. J Alzheimer's Dis. 2018; 62:745–56.
46. Fernandez MV, Black K, Carrell D, Saef B, Budde J, Deming Y, Howells B, Del-Aguila JL, Ma S, Bi C, et al. SORL1 variants across Alzheimer's disease European American cohorts. Eur J Hum Genet. 2016;24:1828–30. 47. Fernandez MV, Budde J, Del-Aguila JL, Ibanez L, Deming Y, Harari O, Norton
J, Morris JC, Goate AM, Group N-Lfs, et al. Evaluation of gene-based family-based methods to detect novel genes associated with familial late onset Alzheimer disease. Front Neurosci. 2018;12:209.
48. Fernandez MV, Kim JH, Budde JP, Black K, Medvedeva A, Saef B, Deming Y, Del-Aguila J, Ibanez L, Dube U, et al. Analysis of neurodegenerative Mendelian genes in clinically diagnosed Alzheimer disease. PLoS Genet. 2017;13:e1007045.
49. FastQC A Quality Control tool for high throughput sequence data [http:// www.bioinformatics.babraham.ac.uk/projects/fastqc/].
50. Bray NL, Pimentel H, Melsted P, Pachter L. Near-optimal probabilistic RNA-seq quantification. Nat Biotechnol. 2016;34:525–7.
51. Soneson C, Love MI, Robinson MD. Differential analyses for RNA-seq: transcript-level estimates improve gene-level inferences. F1000Research. 2015;4:1521.
52. Piccio L, Buonsanti C, Cella M, Tassi I, Schmidt RE, Fenoglio C, Rinker J 2nd, Naismith RT, Panina-Bordignon P, Passini N, et al. Identification of soluble TREM-2 in the cerebrospinal fluid and its association with multiple sclerosis and CNS inflammation. Brain. 2008;131:3081–91.
53. Benitez BA, Sands MS. Primary fibroblasts from CSPalpha mutation carriers recapitulate hallmarks of the adult onset neuronal ceroid lipofuscinosis. Sci Rep. 2017;7:6332.
54. Deming Y, Li Z, Benitez BA, Cruchaga C. Triggering receptor expressed on myeloid cells 2 (TREM2): a potential therapeutic target for Alzheimer disease? Expert Opin Ther Targets. 2018;22:587–98.
55. Benitez BA, Cruchaga C. United States-Spain Parkinson's disease research G: TREM2 and neurodegenerative disease. N Engl J Med. 2013;369:1567–8. 56. Cady J, Koval ED, Benitez BA, Zaidman C, Jockel-Balsarotti J, Allred P, Baloh RH,
Ravits J, Simpson E, Appel SH, et al. TREM2 variant p.R47H as a risk factor for sporadic amyotrophic lateral sclerosis. JAMA Neurol. 2014;71:449–53. 57. Konishi H, Kiyama H. Microglial TREM2/DAP12 signaling: a double-edged
sword in neural diseases. Front Cell Neurosci. 2018;12:206.
58. Hamerman JA, Jarjoura JR, Humphrey MB, Nakamura MC, Seaman WE, Lanier LL. Cutting edge: inhibition of TLR and FcR responses in macrophages by triggering receptor expressed on myeloid cells (TREM)-2 and DAP12. J Immunol. 2006;177:2051–5.
59. Piccio L, Buonsanti C, Mariani M, Cella M, Gilfillan S, Cross AH, Colonna M, Panina-Bordignon P. Blockade of TREM-2 exacerbates experimental autoimmune encephalomyelitis. Eur J Immunol. 2007;37:1290–301. 60. Turnbull IR, Gilfillan S, Cella M, Aoshi T, Miller M, Piccio L, Hernandez M,
Colonna M. Cutting edge: TREM-2 attenuates macrophage activation. J Immunol. 2006;177:3520–4.
61. Jiang H, Si Y, Li Z, Huang X, Chen S, Zheng Y, Xu G, Chen X, Chen Y, Liu Y, et al. TREM-2 promotes acquired cholesteatoma-induced bone destruction by modulating TLR4 signaling pathway and osteoclasts activation. Sci Rep. 2016;6:38761.
5-hydroxymethycytosine enrichment in Alzheimer's disease hippocampus. Clin Epigenetics. 2016;8:37.
63. Ma L, Allen M, Sakae N, Ertekin-Taner N, Graff-Radford NR, Dickson DW, Younkin SG, Sevlever D. Expression and processing analyses of wild type and p.R47H TREM2 variant in Alzheimer's disease brains. Mol Neurodegener. 2016;11:72.
64. Thornton P, Sevalle J, Deery MJ, Fraser G, Zhou Y, Stahl S, Franssen EH, Dodd RB, Qamar S, Gomez Perez-Nievas B, et al. TREM2 shedding by cleavage at the H157-S158 bond is accelerated for the Alzheimer's disease-associated H157Y variant. EMBO Mol Med. 2017;9:1366–78.