Early View
Original article
The construction and validation of the Severe
Asthma Questionnaire (SAQ)
Michael E Hyland, Rupert C Jones, Joseph W Lanario, Matthew Masoli
Please cite this article as: Hyland ME, Jones RC, Lanario JW, et al. The construction and validation of the Severe Asthma Questionnaire (SAQ). Eur Respir J 2018; in press (https://doi.org/10.1183/13993003.00618-2018).
This manuscript has recently been accepted for publication in the European Respiratory Journal. It is published here in its accepted form prior to copyediting and typesetting by our production team. After these production processes are complete and the authors have approved the resulting proofs, the article will move to the latest issue of the ERJ online.
Copyright ©ERS 2018
. Published on May 24, 2018 as doi: 10.1183/13993003.00618-2018 ERJ Express
The construction and validation of the Severe Asthma Questionnaire (SAQ).
Authors: Michael E Hyland1,2, Rupert C Jones2,3, Joseph W Lanario1,2, Matthew
Masoli2
1. School of Psychology, University of Plymouth of Plymouth, Plymouth, UK. 2.
Plymouth Hospital’s NHS Trust, Plymouth, UK 3. Peninsula School of Medicine and
Dentistry, University of Plymouth, UK
Correspondence: Prof Michael Hyland, School of Psychology, Plymouth University,
Plymouth, PL4 8AA, UK. Email: [email protected]
Author contributions
All four authors contributed to the design of the study and all four authors contributed
to the writing of the paper. MH wrote the first draft and was responsible for the
analysis. MM and RJ were responsible for recruitment and data collection. JL
collected the data and contributed to the analysis.
Funding provided by AstraZeneca (non-promotional grant)
Take Home Message
This paper describes the validation process for a new severe asthma specific quality
Abstract
Background
The USA’s Food and Drug Administration’s procedure for scale validation requires a
documented stepwise process of qualitative and quantitative data. The aim of this
paper is to provide the final quantitative validating data.
Methods
The severe asthma questionnaire (SAQ), asthma control test (ACT), MiniAQLQ, and
EQ-5D-5L were completed by 160 patients attending a severe asthma clinic; 51
patients completed the SAQ on two occasions for test-retest reliability analysis. The
SAQ produces two scores, an SAQ score based on the average of 16 items and a
SAQ-global score from a single 100-point global quality of life scale.
Results
Construct validity was demonstrated through factor analysis of the 16 items,
convergent validity by correlations of > 0.6 between the SAQ, SAQ-global and other
questionnaires, and discriminant validity by the ability of the SAQ and SAQ-global to
distinguish between different treatment levels. Test-retest reliability (intra-class
correlation) was 0.93 for the SAQ and 0.93 for the SAQ-global, and the alpha
coefficient for the SAQ was 0.93.
Conclusions
The SAQ was developed using recommended qualitative and quantitative
procedures for scale development, and can be used to gain insight into patients’
perceptions of the impact of severe asthma and its treatment on their lives.
Introduction
Patients with severe and difficult-to-treat asthma comprise a small proportion
(5-10%) of all asthmatic patients, yet are responsible for a disproportionate degree of
asthma morbidity and costs [1,2]. Quality of life assessment forms an essential part
of asthma assessment as measures such as respiratory symptoms and lung function
may not convey the true limitations caused by the disease from the patient’s
perspective [3]. Compared to mild and moderate asthma, patients with severe
asthma have additional quality of life deficits caused by multiple and more severe
exacerbations that disrupt the lives of patients and their relatives, comorbidities, and
higher treatment burden, particularly oral corticosteroids, [4].
The US Food and Drug Administration (FDA) published recommendations for
validating Patient Reported Outcome Measures (PROMs) in 2009 [5]. The FDA
recommends a stepwise process of validation where firstly content validity is
established by documented qualitative research and secondly construct and other
validity is established through quantitative methods.
The three most commonly used asthma specific health related quality of life
(HRQoL) scales [6, 7, 8] were published prior to the FDA’s 2009 guidelines and
include symptom items that are perceived negatively in this context by patients [9].
Additionally, these and other published asthma scales fail to assess quality of life
deficits specific to severe asthma [10]. Thus, although existing scales are valid in
terms of earlier definitions of validity [11, 12] or for mild and moderate asthma, they
are not valid in terms of the FDA’s 2009 guidelines when used in people with severe
The qualitative stage of the development and content validation of the severe
asthma questionnaire (SAQ) has been reported in two studies [10,13]. The first study
[10] showed that in addition to deficits experienced in mild and moderate asthma,
those with severe asthma had additional problems in their lives primarily caused by
two factors. First, the side effects of medication produced a variety of problems
including mood changes, changes in self-perception, problems with eating, sleep
disturbance, and appearance. Second, exacerbations (in particular those leading to
hospitalisation) created problems for the patient and the wider family.
Using our findings from the first study we drafted a severe asthma specific
questionnaire, and subsequently conducted four focus groups in which patients with
severe asthma provided iterative changes to the design and content of the draft
questionnaire [13]. The aim of this second phase was to ensure that the
questionnaire was able to correctly capture the kind of information patients felt
important in relation to their quality of life. Patients defined the response scale,
combined two items, split one item to assess different impacts on family lives,
advised on recall period and optimised the wording of individual items. In addition,
patients expressed a desire to provide an overall assessment of their quality of life
(see the online supplement, Figure E1).
The SAQ comprises 16 questions about different aspects of life and a global
question that assesses their quality of life overall. The SMOG grade [14] for the
SAQ is 5.9, indicating suitability for a reading age of at least 11-12 years. The
unweighted aggregation of the 16 questions produces a score similar in methodology
reasons. First, patients express a strong preference for providing an overall score in
contrast to those requiring a differentiation between different aspects of life. The
second reason is psychological. Patients make judgements, including judgements
about their lives, using either one or a combination of two cognitive processes, called
System 1 and System 2. System 1 judgements are fast, automatic and the process
unavailable to consciousness. System 2 judgements are slow, deliberative, and
people can introspect the process [15]. A patient’s response to a question in clinic
‘how are you?’ will be influenced primarily by a System 1 judgement. The use of two
types of measure, the SAQ score based on the 16 items and the SAQ global score
provides a way of capturing these different kinds of judgement [16]. Single item
scales are less preferred in clinical trials because the use of multiple items reduces
error variance.
The aim of this study was to provide the final stage of validation required by the FDA,
namely a quantitative study that establishes construct and other types of validity.
Method
Participants
Patients diagnosed with severe asthma as defined by the international consensus
statement from the European Respiratory and American Thoracic Societies [1] aged
≥16 years of age who attended the Plymouth severe asthma service were invited to
participate. Those with significant other conditions contributing to their respiratory
Questionnaires
Severe Asthma Questionnaire (SAQ) comprises 16 items, with response options on
a 7-point scale averaged to produce the SAQ score (scores 1 – 7) and a 100-point
Borg-type scale [17] producing the SAQ-global score (scores 0 – 100). Quantifiers
are indicated against all seven of the SAQ response options. A Borg scale is a
category rating scale with quantifiers at either end and additional, empirically placed
quantifiers along the categories of the scale. The SAQ-global was adapted from an
existing global quality of life scale [18] see www.saq.org.uk.
Mini Asthma Quality of Life Questionnaire (MiniAQLQ) [7] comprises 15 items with
response options on a 7-point scale with responses averaged (scores 1-7).
Asthma Control Test (ACT) comprises five symptom and medication items (5
response options per item) totalled to produce an asthma control score. [19].
EQ-5D-5L comprises five quality of life items (5 response options per item) which
were averaged to produce an EQ-5D-5L score and the
EQ5D-VAS. A 100-point visual analogue scale (scores 1 – 100) [20].
Criteria for missing data are shown in the online supplement.
Clinic data
Clinic data collected were: spirometry (FEV1), prednisolone dose (mg/day), number
Initiative for Asthma (GINA) severity, BMI, estimated cumulative oral corticosteroid
(OCS) dose per year. This was calculated by multiplying the participant’s
maintenance steroid dose by 365 days, and adding an estimate of OCS use per
exacerbation in the previous 12 months. Based on British Thoracic Society and
GINA guidance one exacerbation was judged to comprise prednisolone 40mg/day
multiplied by 7 days which equates to 280mg of prednisolone per exacerbation
[21,22].
Procedure
Patients were recruited to the validation study or the reliability study or both studies.
Questionnaires were completed either at home (postal return of questionnaire) or in
clinic. Participants’ data were included in the analysis of test re-test reliability if their
ACT scores did not change by the Minimum Clinically Important Difference (MCID) of
3 points or more and they reported stable asthma (see online supplement, Figure
E2).
Analysis
Analysis was on an intention to treat basis (see online supplement, Figure E2).
Convergent validity between questionnaires was established using Pearson
correlations. Groups of patients were identified by (a) level of maintenance dose of
OCS (mg/day) and (b) estimated cumulative OCS dose per year. Differences
between groups (discriminant validity) were tested by one-way analysis of variance
(ANOVA) and where significant followed by Least Significant Difference (LSD) post
hoc tests. Construct validity was tested by exploratory factor analysis using principal
could be aggregated into a single scale score was tested by examining whether the
scree test indicated a unifactorial solution and whether items loaded significantly (>
0.3) on the first factor. Test-retest reliability was calculated by intra-class
correlations. Internal consistency was calculated by Cronbach’s alpha coefficient. All
analysis was conducted using IBM SPSS statistics 24.
Ethical approval
The study was approved by the Plymouth Hospitals NHS Trust and REC/HRA,
ethical approval number 16/NE/0188, IRAS ID: 207601. All patients provided
informed written consent.
Results
Questionnaire completion and return.
For the validation study 260 participants were invited to participate, 20 declined to
participate, 54 failed to return questionnaires by post, and 26 patients failed to attend
their clinic appointment and provide written informed consent leaving 160
participants. For the test-retest reliability study 115 patients were invited to
participate, 10 declined. Of the 105 who consented for the test-retest reliability study,
returned questionnaires were received from 67 patients, and 16 patients were
excluded because their ACT score had changed by 3 points or more leaving 51
participants (37 female). (See online supplement, Figure E2). One patient at GINA
step 2 was recruited although they did not meet the criteria for severe asthma they
the analysis as this studied used intention to treat criteria. Participant demographics
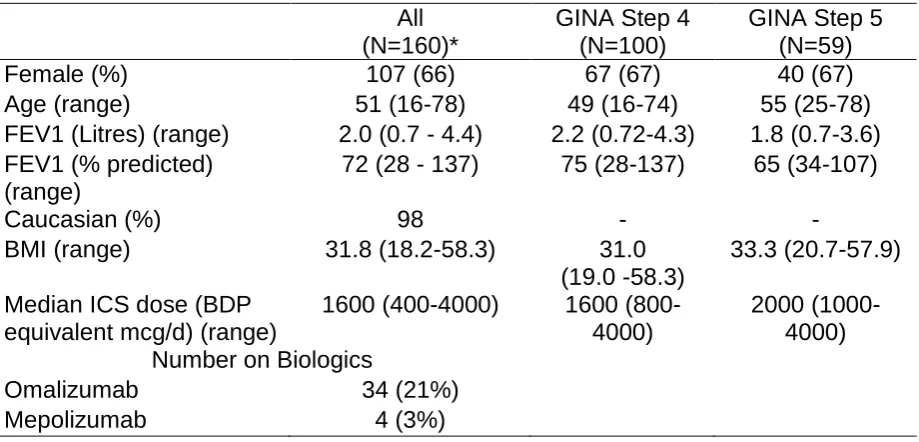
are displayed in Table 1.
Of the 160 patients who participated in the validation study, completed
questionnaires were as follows: SAQ (154/96% completed), MiniAQLQ (146/91%
completed), ACT (159/99% completed). One hundred participants were asked to
complete the EQ-5D-5L (96/96% completed).
Table 2 shows the correlations between the different questionnaires. All correlations
were above 0.60, showing convergence between the different questionnaires. In
addition, the correlations between all questionnaires, BMI and FEV1 percent
predicted are also shown.
Table 3 shows the mean, range, and standard deviation of responses to the 16 items
of the SAQ. Absence of floor or ceiling effects is indicated by no SAQ item having a
standard deviation less than one point away from an end point. In addition, for all
items participants used the full range of response options with some using every
option between 1 and some 7 for all items (see Table E1 in the online supplement).
These results show that no item should be rejected on the basis of poor distribution.
The SAQ scores ranged from 5 (extremely bad quality of life) to 100 (perfect quality
of life) (see Table E3 in the online supplement).
To test whether it is valid to aggregate the 16 items into a single scale score,
test (the first four eigenvalues were 9.91, 1.11, 0.92, 0.72,) accounting for 60% of the
variance. The factor scores are shown in Table 3. All factor scores are above 0.6
showing that despite difference in content all items were related to the same latent
variable. Cronach’s alpha coefficient was 0.96. Test-retest reliability as measured by
intra-class correlation was 0.93 (CI 0.87-0.96) for the SAQ and 0.93 (CI 0.86-0.96)
for the SAQ-global, showing that the SAQ is a reliable scale. Test-retest reliability
was also calculated individually for each item of the SAQ (see Table E3 in the online
supplement).
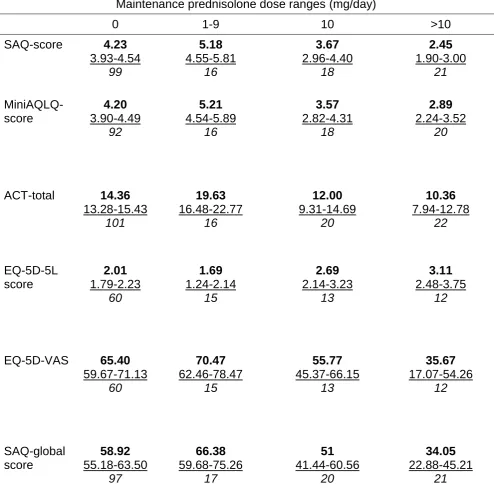
Table 4 shows the mean and standard deviation score values for each of the six
scales as a function of four groups of patients: no maintenance prednisolone, 1-9mg
per day, 10 mg per day, and >10mg per day (ranges were selected to achieve
groups of approximately equal size). All scales were significantly different across the
four groups p<0.001, showing that the SAQ can discriminate between groups that
are theoretically predicted to be different based on asthma severity. To compare the
discrimination of different questionnaires between the 10mg/day and >10mg/day
groups as a function of maintenance dose, we conducted LSD tests. Significant
differences were found for the SAQ score (p =0.01), SAQ-global score (p=0.01) and
EQ5D-VAS score (p=0.02), but not the MiniAQLQ score (p=0.13) nor the ACT score
(p=0.34) nor EQ-5D-5L score (p=0.23). With regard to other paired comparisons,
there is pattern of poorer outcome with increasing dose of OCS except for the
comparison between those on no maintenance OCS versus those on between 1 –
9mg. For these comparisons (using LSD tests), the 1 – 9mg dose had better quality
of life than the no maintenance dose for the MiniAQLQ (p=0.008), the ACT
(p=0.2), or the EQ5D-VAS (p=0.4). Because the 1 – 9mg dose group had better
quality of life than the no maintenance dose group, we examined possible
differences in biologic prescription between the four groups. In the zero dose group,
17/101 (17%) were on biologics whereas the figures for the other three groups were
1 – 9mg = 9/17 (53%), 10mg = 6/20 (30%), > 10mg = 6/22 (27%). Figure 1 provides
a visual comparison of the SAQ and MiniAQLQ as a function of maintenance
prednisolone dose.
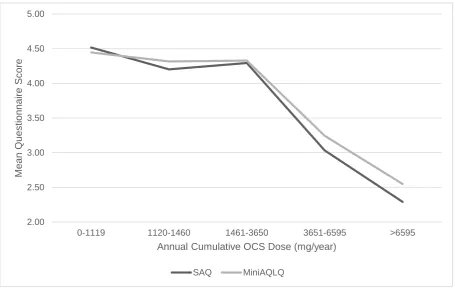
Participants were allocated to estimated annual cumulative OCS dose groups: (a) 0
– 1119mg/year, (b) those on 1120-1460mg/year, (c) those on 1461-3650mg/year, (d)
those on 3651-6595mg/year and (e) >6595mg/year. These doses were chosen to be
clinically relevant, e.g. 1120mg/year ≈ 4 courses of OCS, 3650mg/year ≈ 10mg/day
prednisolone, > 6595 ≈ 20mg/day prednisolone. Table 5 shows the mean scores for
these five groups for each of the six scales. Figure 2 provides a comparison of the
SAQ and MiniAQLQ mean scores at different doses of prednisolone.
One-way ANOVA showed that there was a significant difference (p<0.001) between
the five estimated cumulative OCS dose groups for all questionnaires. In order to
carry out post hoc tests that are equivalent to those of Table 4, we combined the two
groups with the highest burden, namely those on 3651-6595mg/year and those on
>6595 mg/year. ANOVA was repeated on the four groups (all questionnaires were
significant at p<0.001). Significant differences were found between those on
1461-3650mg/year, and >3650 mg/year for the SAQ score (p>0.001), MiniAQLQ score
(p>0.01), ACT total (p = 0.004), EQ-5D-5L score (p=0.003) and the SAQ-global
Discussion
The FDA’s guidance for valid questionnaire construction [5] requires documentation
of a qualitative stage of research followed by a quantitative stage. The SAQ was
developed on the basis of qualitative research reported elsewhere [10, 13]. In this
paper we provide details of the quantitative stage.
People with severe asthma experience difficulty in a number of different domains of
life experience, some of which are not experienced by those with mild and moderate
asthma. For example, 28% felt that irritability, a side effect of OCS, made life either
very difficult or very, very difficult, and 27% experienced this level of difficulty with
food. Thirty nine percent reported that ‘problems at night’ made life at least very
difficult, where sleep disturbance can be caused either by asthma symptoms (which
cause waking) or the side effects of OCS (which cause sleep difficulty getting to
sleep, waking and additional problems during the night). Two family items are
included in the SAQ as a result of the earlier qualitative research [13]. Twenty
percent of patients rated their family lives as at least very difficult for themselves, and
18% rated it at least very difficult for other family members, confirming the earlier
qualitative research that severe asthma impacts family life not only for the patient but
also the patient’s family. These descriptive results show that people with severe
asthma can experience non-trivial disutility in domains of experience which are not
included in questionnaires designed for mild and moderate asthma, with particularly
high disutility recorded for ‘the way I look’, ‘getting tired’ and the two items
Although some people with severe asthma experience very poor quality of life, this is
not a universal experience. For example, although 32% of people in this study felt
they had moderately bad quality of life or worse, 24% felt they had good quality of life
or better. Although some of this difference can be explained by severity and
treatment differences (those with greater OCS burden report poorer quality of life)
the relationship between severity, treatment and quality of life is complex.
In addition to providing descriptive data on people with severe asthma, the data
provide construct validity for the SAQ. Statistical analysis showed that all 16 items
could be aggregated into a single score and that no item should be rejected on
purely statistical groups. The intra-class test-retest reliability of the SAQ and
SAQ-global of 0.93 compares well with other questionnaires e.g. the MiniAQLQ of 0.83 [7].
The SAQ score and the SAQ-global score correlate with other asthma and generic
scales thereby providing convergent validity. The SAQ score discriminates between
groups of patients defined by maintenance prednisolone dose and defined by
estimated cumulative OCS burden per year, thereby providing discriminant validity.
There is a trend for the SAQ to demonstrate greater QoL impairment with increasing
OCS burden compared to the MiniAQLQ but the study is underpowered to make
statistical comparisons between scales.
All outcome measures showed a trend towards poorer quality of life with greater
doses of OCS, except for the comparison between those on no prednisolone versus
those prescribed between 1 and 9mg per day. We do not know why the 1 – 9mg
group had better quality of life than those without a maintenance dose, but it may be
to clarify the complex relationship between biologics and OCS on quality of life
versus asthma symptoms [25].
The SAQ differs from other asthma-specific scales in that it includes a single item
100-point scale of global quality of life, the SAQ-global, which is included due to
patient request. In this respect the SAQ is similar to the EQ5D where there is also a
single item 100-point scale, the EQ5D-VAS. The SAQ-global is a 0-100 Borg type
scale adapted from another scale [18], and research shows the use of additional
quantifiers is more reliable than the format used in the EQ5D-VAS [15] where only
the end points have quantifiers. With the exception of the EQ5D and EQ5D-VAS, all
questionnaires show weak to moderate correlations with lung function indicating that
lung function plays a modest causal effect on these measures. The absence of a
significant correlation for the EQ5D and EQ5D-VAS suggests that these two
measures may not be valid for assessing the quality of life of severe asthma.
Multiple item scales often have better reliability than single item scales for statistical
reasons. Consistent with other research showing Borg scales to be more reliable
than visual analogue scales [18], our data show that the SAQ-global is highly reliable
and as reliable as the SAQ score. The SAQ-global also correlates well with other
scales. Comparison between the EQ5D and VAS suggests that the
EQ5D-VAS measures a broader concept than the EQ5D [16], and the same difference may
apply to the SAQ score and SAQ-global. Additionally, response to these two different
parts of the SAQ may reflect different cognitive processes – a fast automatic process
for the SAQ-global and a slow deliberate process for the SAQ score [15]. Our study
range) equates to ‘makes my life slightly difficult’ (i.e. a mean score of 4.8 on the
SAQ – see Table E3 in the online supplement), showing that the way a question is
asked affects the patient’s response. Both types of measure can be useful, but it is
likely that the SAQ-global provides a value more consistent with patients’ immediate
response when clinicians ask about their asthma.
Limitations
The estimated cumulative OCS dose might be underestimate of OCS burden as
patients with severe asthma may often require a longer course of OCS for an
exacerbation than the 7 days used in our calculation. Use of biologics were not
considered in this analysis and may affect quality of life assessments. The study
was carried out in the South West of the UK, and although the study population is
not dissimilar to the UK demographic data presented within the UK severe asthma
registry [26], the population was predominantly Caucasian and further validation in
ethnically and culturally diverse populations is required. The literacy level required to
use the SAQ is at least age 11-12 years old reading level, but this is consistent with
current literacy requirements for patient communication [27]. The 15-item MiniAQLQ
rather than the 32-item AQLQ was used as a comparison scale to reduce
questionnaire fatigue and because the MiniAQLQ is similar in length the SAQ. Nine
patients participating in this study also participated in an earlier qualitative work [13].
.The SAQ is structured so that the global measure appears after the 16 contest
specific items, and this order of presentation may have an effect. Research shows
that prior exposure to a negative event (i.e., asking patients about difficulty in
Further research is needed to explore how contextual factors, including the order of
presentation of different questions influences quality of life judgements.
Conclusions
The SAQ was designed to detect the impact of both asthma symptoms and
treatment on quality of life and has been shown to be content valid in earlier studies
[10, 13]. This paper confirms the relevance of items based on the earlier studies,
establishes the construct validity of the scale and shows it to be a reliable in a group
of patients with severe asthma with different types of treatment. These data
complete the validation procedures required by the FDA. Longitudinal studies are
required to provide further information about the scale, for example, to establish
sensitivity to change and the minimally clinically important difference in people with
severe asthma. The SAQ is available for use in the British English version reported
here and is available from the authors or online (www.saq.org.uk). Translations in
other languages are required. In addition to providing a scale that is fit for purpose
[10] for assessing health related quality of life in clinical trials, the SAQ can also be
used in clinical practice to alert clinicians to the problems experienced by patients,
and to gain an initial insight into the patients’ own perceptions of the impact of illness
and its treatment on their lives.
Acknowledgements
RJ and JL were supported by the National Institute for Health Research (NIHR)
Collaboration for Leadership in Applied Health Research and Care South West
of the authors and not necessarily those of the NHS, the NIHR or the Department of
Health and Social Care. We acknowledge Jill Pooler’s early work in the project
including help in preparing for and obtaining NHS and REC/HRA ethical approval.
Mike Thomas provided helpful comments on an earlier draft. We would also like to
thank the staff at Derriford Hospital’s Chest Clinic for their assistance with this
project.
References
1. Chung KF, Wenzel SE, Brozek JL, Bush A, Castro M, Sterk PJ, Adcock IM,
Bateman ED, Bel EH, Bleecker ER, Boulet LP. International ERS/ATS guidelines
on definition, evaluation and treatment of severe asthma. Eur Respir J 2013;
43(2): 343-373.
2. O'neill S, Sweeney J, Patterson CC, Menzies-Gow A, Niven R, Mansur AH,
Bucknall C, Chaudhuri R, Thomson NC, Brightling CE, O'neill C. The cost of
treating severe refractory asthma in the UK: an economic analysis from the
British Thoracic Society Difficult Asthma Registry. Thorax. 2014; 70(4): 376-378.
3. Wilson SR, Rand CS, Cabana MD, Foggs MB, Halterman JS, Olson L, Vollmer
WM, Wright RJ, Taggart V. Asthma outcomes: quality of life. J Allergy Clin
Immunol 2012; 129(3):S88-123.
4. Sweeney J, Patterson CC, Menzies-Gow A, Niven RM, Mansur AH, Bucknall C,
Chaudhuri R, Price D, Brightling CE, Heaney LG. Comorbidity in severe asthma
requiring systemic corticosteroid therapy: cross-sectional data from the Optimum
Patient Care Research Database and the British Thoracic Difficult Asthma
Registry. Thorax 2016; 71(4): 339-346.
5. U.S. Department of Health and Human Services Food and Drug Administration.
Guidance for Industry Patient-Reported Outcome Measures: use in Medical
Product Development to Support Labeling Claims, 2009.
6. Juniper EF, Guyatt GH, Ferrie PJ, Griffith LE. Measuring quality of life in asthma.
Am Rev Respir Dis 1993;147(4): 832-823.
7. Juniper EF, Guyatt GH, Cox FM, Ferrie PJ, King DR . Development and
validation of the Mini Asthma Quality of Life Questionnaire. Eur Respir J 1999;
8. Jones PW, Quirk FH, Baveystock CM, Littlejohns P. A self-complete measure of
health status for chronic airflow limitation. Am Rev Respir Dis. 1992;
145(6):1321-1327.
9. Apfelbacher CJ, Jones CJ, Frew A, Smith H. Validity of three asthma-specific
quality of life questionnaires: the patients' perspective. BMJ open; 2016;
6(12):e011793.
10. Hyland ME, Whalley B, Jones RC, Masoli M. A qualitative study of the impact of
severe asthma and its treatment showing that treatment burden is neglected in
existing asthma assessment scales. Qual Life Res 2015; 24(3):631-639.
11. Edwards, M. C., Slagle, A., Rubright, J. D., & Wirth, R. J. (2017). Fit for purpose
and modern validity theory in clinical outcomes assessment. Qual Life Res, First
online, July, 1-10
12. Anastasi A. Psychological Testing (3rd edition). New York: Macmillan 1968.
13. Hyland ME, Lanario JW, Pooler J, Masoli M, Jones RC. How patient participation
was used to develop a questionnaire that is fit for purpose for assessing quality
of life in severe asthma. Health and quality of life outcomes. 2018; 16(1):24.
14. Hedman AS. Using the SMOG formula to revise a health-related document.
American Journal of Health Education. 2008; 39(1):61-4.
15. Kahneman D. Thinking, fast and slow. Macmillan: 2011.
16. Feng Y, Parkin D, Devlin NJ. Assessing the performance of the EQ-VAS in the
NHS PROMs programme. Quality of Life Research. 2014; 23(3):977-89.
17. Borg, G. A. Psychophysical bases of perceived exertion. Med Sci Sports &
18. Hyland ME, Sodergren SC. Development of a new type of global quality of life
scale, and comparison of performance and preference for 12 global scales.
Quality of Life Research. 1996; 5(5):469-80.
19. Nathan RA, Sorkness CA, Kosinski M, Schatz M, Li JT, Marcus P, Murray JJ,
Pendergraft TB. Development of the asthma control test: a survey for assessing
asthma control. Journal of Allergy and Clinical Immunology. 2004; 113(1):59-65.
20. Herdman M, Gudex C, Lloyd A, Janssen MF, Kind P, Parkin D, Bonsel G, Badia
X. Development and preliminary testing of the new five-level version of EQ-5D
(EQ-5D-5L). Quality of life research. 2011; 20(10):1727-36.
21. BTS/SIGN. SIGN 153 • British guideline on the management of asthma.
https://www.britthoracic.org.uk/documentlibrary/clinicalinformation/asthma/btssig
n-asthma-guideline-2016/. Date last updated: September 1 2016. Date last
accessed: April 27 2018.
22. GINA. 2018 GINA Report, Global Strategy for Asthma Management and
Prevention.
http://ginasthma.org/2018-gina-report-global-strategy-for-asthma-management-and-prevention/ . Date last updated: March 29 2018. Date last
accessed: April 27 2018
23. Costello AB, Osborne JW. Best practices in exploratory factor analysis: Four
recommendations for getting the most from your analysis. Practical assessment,
research & evaluation 2005; 10(7):1-9.
24. Osborne JW. Best practices in exploratory factor analysis. CreateSpace
Independent Publishing Platform; 2014.
25. Stucky BD, Sherbourne CD, Edelen MO, Eberhart NK. Understanding
asthma-specific quality of life: moving beyond asthma symptoms and severity. European
26. Heaney LG, Brightling CE, Menzies-Gow A, Stevenson M, Niven RM, on behalf
of the British Thoracic Society Difficult Asthma Network. Refractory asthma in
the UK: cross-sectional findings from a UK multicentre registry. Thorax. 2010;
65(9):787-794.
27. Paasche-Orlow MK, Taylor HA and Brancati FL. Readability standards for
informed-consent forms as compared with actual readability. N Engl J Med 2003;
348: 721–726.
28. Johnson JT. The knowledge of what might have been: Affective and attributional
consequences of near outcomes. Personality and Social Psychology Bulletin.
1986;12(1):51-62
29. Medvec VH, Madey SF, Gilovich T. When less is more: counterfactual thinking
Figure 1. Mean SAQ and MiniAQLQ scores as a function of maintenance
prednisolone dose (mg/day). When comparing 10mg to >10mg/day of maintenance prednisolone use, the SAQ detects a statistically significant difference in mean questionnaire score, but the mini-AQLQ does not.
2.0000 2.5000 3.0000 3.5000 4.0000 4.5000 5.0000 5.5000
0 1-9 10 >10
Me
an
Q
u
es
tio
n
n
aire
Score
Maintenance Prednisolone Dose (mg/day)
SAQ MiniAQLQ
p=0.13
Figure 2. Mean SAQ and MiniAQLQ scores as a function of estimated annual cumulative OCS dose.
2.00 2.50 3.00 3.50 4.00 4.50 5.00
0-1119 1120-1460 1461-3650 3651-6595 >6595
Me
an
Q
ue
s
ti
on
na
ir
e
S
c
ore
Annual Cumulative OCS Dose (mg/year)
Table 1.
Demographic information for all patients, those at GINA step 4 and step 5 of treatment.
All (N=160)*
GINA Step 4 (N=100)
GINA Step 5 (N=59)
Female (%) 107 (66) 67 (67) 40 (67)
Age (range) 51 (16-78) 49 (16-74) 55 (25-78)
FEV1 (Litres) (range) 2.0 (0.7 - 4.4) 2.2 (0.72-4.3) 1.8 (0.7-3.6)
FEV1 (% predicted) (range)
72 (28 - 137) 75 (28-137) 65 (34-107)
Caucasian (%) 98 - -
BMI (range) 31.8 (18.2-58.3) 31.0
(19.0 -58.3)
33.3 (20.7-57.9)
Median ICS dose (BDP equivalent mcg/d) (range)
1600 (400-4000) 1600
(800-4000)
2000 (1000-4000) Number on Biologics
Omalizumab 34 (21%)
Mepolizumab 4 (3%)
Table 2. Pearsons’ correlations between all six scales, BMI and FEV1 percent predicted (n) SAQ-score MiniAQLQ-score ACT-total EQ-5D-5L score EQ5D-VAS SAQ global score MiniAQLQ-score 0.76*** (140) - - - - -
ACT-total 0.68***
(154) 0.84*** (145) - - - - EQ-5D-5L score -0.76*** (97) -0.72*** (99) -0.67*** (100) - - -
EQ5D- VAS 0.71***
(96) 0.76*** (98) 0.66*** (99) -0.79*** (98) - - SAQ global scale 0.72*** (158) 0.71*** (140) 0.68*** (154) -0.71*** (97) 0.76*** (97) -
BMI -0.31***
(154) -0.25** (146) -0.25** (159) 0.44*** (100) -0.24* (100) -0.22** (154) FEV1 percent
predicted 0.27** (154) 0.30*** (146) 0.24** (159) (100) -0.13 (100) 0.16 0.26** (154)
Table 3.
Mean, Standard Deviation, factor loadings, and the percentage of participants
responding ‘very difficult’ or ‘very, very difficult’ to each of the 16 items of the Severe Asthma Questionnaire
Item Mean* Standard
Deviation Percentage of patients responding ‘very difficult’ or ‘very, very difficult’ Factor loading
1. My social life. For example: visiting friends, walking with friends, talking with friends, going to bars/restaurants, and parties.
4.11 1.94 25.2% 0.88
2. My personal life. For example:
washing, dressing, looking after myself, love life.
4.98 1.98 15.0% 0.81
3. My leisure activities. For example: walking for pleasure, sports, exercise, travelling, taking vacations.
3.54 1.95 37.5% 0.84
4. My jobs around the house. For example: housework, shopping, home maintenance, gardening.
3.96 1.92 27.2% 0.88
5. My work or education. For example,
missing days, can’t do all I want to do. 4.78 2.64 25.7% 0.6
6. My family life – how it affects me. For example: caring for children, family responsibilities
4.59 2 19.6% 0.87
7. My family life – how it affects others. For example: others taking time off work, problems with childcare, family members becoming upset.
4.74 2.1 18.3% 0.82
8. Depression. For example, feeling sad,
fed up, blue. 4.05 1.98 29.0% 0.81
9. Irritable. For example, snap at people,
get angrier than I should. 4.06 1.99 27.8% 0.77
10. Anxiety in general. For example,
11. Worry that asthma may get worse. For example, medicines no longer help, more frequent attacks.
3.7 2.04 39.2% 0.71
12. Worry about long term side effects of medicines. For example, worry about cataracts, diabetes, bone fracture.
3.92 2.12 33.8% 0.66
13. Getting tired. For example, feeling tired for no reason, waking in the morning feeling tired.
3.16 1.9 43.3% 0.79
14. Problems at night. For example, difficulty going to sleep, being woken very easily, waking often at night.
3.5 1.99 39.2% 0.79
15. The way I look. For example, my weight, my skin bruises easily, using medicines in public, other people judging me
3.65 2.17 39.9% 0.68
16. Problems with food. For example, I find I get very hungry, I just can’t stop eating, stomach problems (e.g., pain, bloating, etc.)
4.27 2.07 26.8% 0.67
Table 4.
Mean, confidence intervals and n-values questionnaire scores and n at different
levels of prednisolone dose
Maintenance prednisolone dose ranges (mg/day)
0 1-9 10 >10
SAQ-score 4.23
3.93-4.54 99 5.18 4.55-5.81 16 3.67 2.96-4.40 18 2.45 1.90-3.00 21 MiniAQLQ-score 4.20 3.90-4.49 92 5.21 4.54-5.89 16 3.57 2.82-4.31 18 2.89 2.24-3.52 20
ACT-total 14.36
13.28-15.43 101 19.63 16.48-22.77 16 12.00 9.31-14.69 20 10.36 7.94-12.78 22 EQ-5D-5L score 2.01 1.79-2.23 60 1.69 1.24-2.14 15 2.69 2.14-3.23 13 3.11 2.48-3.75 12
EQ-5D-VAS 65.40
59.67-71.13 60 70.47 62.46-78.47 15 55.77 45.37-66.15 13 35.67 17.07-54.26 12 SAQ-global score 58.92 55.18-63.50 97 66.38 59.68-75.26 17 51 41.44-60.56 20 34.05 22.88-45.21 21
Table 5.
Mean, confidence intervals and n-values questionnaire scores and n at different
doses of estimated cumulative OCS .
Estimated annual cumulative dose (mg/year)
0-1119 1120-1460 1461-3650 3651-6595 >6595
SAQ-score 4.52
4.18- 4.85 77 4.20 3.49-4.91 21 4.29 3.56-5.02 20 3.03 2.52-3.55 21 2.29 1.60-2.99 15
MiniAQLQ-score 4.45
4.13-4.76 71 4.32 3.60-5.03 22 4.33 3.48-5.17 18 3.24 2.63-3.85 20 2.65 1.99-3.10 15
ACT-total 15.19
13.99-16.39 79 16.14 13.35-18.94 21 14.62 11.27-17.97 21 11.14 8.87-13.40 22 8.81 6.84 -10.79 16
EQ-5D-5L score 1.89
1.64-2.15 46 2.02 1.59-2.46 17 2.03 1.49-2.57 13 2.67 2.17-3.17 15 3.40 2.81-3.99 9
EQ5D-VAS 66.85
60.33-73.38 48 71.67 63.38-79.95 15 60.15 47.34-72.97 13 57.67 48.86-66.48 15 22.56 7.97-37.14 9
SAQ-global score 61.45
56.90-66.01 75 62.76 54.15-71.37 21 54.52 44.37-64.67 21 47.95 38.78-57.12 22 25.67 15.64-35.70 15
Note: a lower score for the SAQ, MiniAQLQ, ACT total, EQ5D-VAS and SAQ-Global score indicates low quality of life/health. A high score for the EQ-5D-5L score
Online Supplementary Data
Content validity of the Severe Asthma Questionnaire from earlier studies
Findings of the initial patient interviews included (see [10] for more details):
Identification of domains that included deficits caused by symptoms of severe
asthma as well as side effects of medication.
A failure of existing asthma specific quality of life scales to assess all the
domains to severe asthma.
Findings of the four focus groups included (see [13] for more details):
The recall period of two weeks was acceptable, but a two week window fails
to reflect the patients’ desire to express the variability of severe asthma.
Patients welcomed the ability to rate their global quality of life during the worst
and best months of the year.
Patients suggested improvements to the wording of the draft questionnaire,
including splitting some items in two (the items relating to family life),
combining two items in one (relating to appearance and embarrassment).
Patients suggested changes to some of the words in individual items and the
response scale.
Patients can help optimise the language of a questionnaire better if they are
treated as partners in the process of questionnaire completion rather than
Criteria for incomplete questionnaires
For the SAQ and MiniAQLQ, questionnaires were considered incomplete if more
than one question was missed excluding the question on work. In the case of the
SAQ patients are instructed not to answer this question if not in work. In the case of
the MiniAQLQ patients often miss this question even though they are instructed to
answer it in terms of other activities if not in work. For the ACT a questionnaire was
considered incomplete if one or more questions were missed. An EQ-5D-5L was
considered incomplete if two of more questions were missed.
If patients are not in work, then the SAQ score is the average of the 15 lifestyle
questions that do not refer to work. If patients are in work, then an extra domain is
added because patients then have an extra domain of quality of life. Using this
procedure, the non-work domains are the same for in and out of work patients. In the
case of the MiniAQLQ, if patients are not in work, then they are asked to answer the
work question in terms of other activities. Although the average MiniAQLQ score is
obtained from the same number of questions for in work our out of work patients, the
non-work domains no longer the same for in and out of work patients because the
out of work patients are answering an additional non-work domain. An aim of
content validity is to ensure that questions are interpreted in the same way by
different patients. The procedure used by the SAQ achieves this aim and removes
the inconsistency of some out of work patients completing the work item of the
MiniAQLQ and some not doing so, which in the present study was 25 out of 160
Table E1.
SAQ response option frequencies
Item 1 2 3 4 5 6 7 Missing out
of 160 1. My social life. For example: visiting
friends, walking with friends, talking with friends, going to bars/restaurants, and parties.
14 26 26 28 21 15 29 1
2. My personal life. For example:
washing, dressing, looking after myself, love life.
6 18 21 21 18 15 61 0
3. My leisure activities. For example: walking for pleasure, sports, exercise, travelling, taking vacations.
25 35 31 19 17 14 19 0
4. My jobs around the house. For example: housework, shopping, home maintenance, gardening.
17 26 28 26 19 21 21 2
5. My work or education. For example, missing days, can’t do all I want to do.
18 18 14 18 13 13 34 32
6. My family life – how it affects me. For example: caring for children, family responsibilities
10 20 23 20 17 23 40 7
7. My family life – how it affects others. For example: others taking time off work, problems with childcare, family members becoming upset.
10 18 26 19 9 17 54 7
8. Depression. For example, feeling sad, fed up, blue.
16 29 23 20 23 19 25 5
9. Irritable. For example, snap at people, get angrier than I should.
17 27 23 27 16 22 26 2
10. Anxiety in general. For example, worry about things, always on edge.
11. Worry that asthma may get worse. For example, medicines no longer help, more frequent attacks.
21 41 23 14 21 14 24 2
12. Worry about long term side effects of medicines. For example, worry about cataracts, diabetes, bone fracture.
27 26 17 23 17 20 27 3
13. Getting tired. For example, feeling tried for no reason, waking in the morning feeling tired
38 32 32 15 15 15 11 2
14. Problems at night. For example, difficulty going to sleep, being woken very easily, waking often at night.
31 31 25 20 17 18 16 2
15. The way I look. For example, my weight, my skin bruises easily, using medicines in public, other people judging me
35 28 20 17 16 16 26 2
16. Problems with food. For example, I find I get very hungry, I just can’t stop eating, stomach problems (e.g., pain, bloating, etc.)
21 21 13 28 18 25 31 3
Table E2.
Intra-class correlation, confidence intervals and n-values for the 16 items of the SAQ
Item Intra-class
correlation
1. My social life. For example: visiting friends, walking with friends, talking with
friends, going to bars/restaurants, and parties.
0.89
0.80-0.94
50
2. My personal life. For example: washing, dressing, looking after myself, love life. 0.86
0.75-0.92
50
3. My leisure activities. For example: walking for pleasure, sports, exercise,
travelling, taking vacations.
0.93
0.88-0.96
51
4. My jobs around the house. For example: housework, shopping, home
maintenance, gardening.
0.88
0.79-0.93
51
5. My work or education. For example, missing days, can’t do all I want to do. 0.87
0.72-0.94
27
6. My family life – how it affects me. For example: caring for children, family
responsibilities
0.89
0.81-0.94
46
7. My family life – how it affects others. For example: others taking time off work,
problems with childcare, family members becoming upset.
0.87
0.76-0.93
46
8. Depression. For example, feeling sad, fed up, blue. 0.85
0.73-0.91
51
9. Irritable. For example, snap at people, get angrier than I should. 0.85
0.74-0.91
51
10. Anxiety in general. For example, worry about things, always on edge. 0.84
51
11. Worry that asthma may get worse. For example, medicines no longer help,
more frequent attacks.
0.84
0.73-0.91
51
12. Worry about long term side effects of medicines. For example, worry about
cataracts, diabetes, bone fracture.
0.66
0.40-0.81
50
13. Getting tired. For example, feeling tired for no reason, waking in the morning
feeling tired.
0.88
0.78-0.93
51
14. Problems at night. For example, difficulty going to sleep, being woken very
easily, waking often at night.
0.84
0.71-0.91
51
15. The way I look. For example, my weight, my skin bruises easily, using
medicines in public, other people judging me
0.86
0.75-0.92
51
16. Problems with food. For example, I find I get very hungry, I just can’t stop
eating, stomach problems(e.g., pain, bloating, etc.)
0.77
0.59-0.87
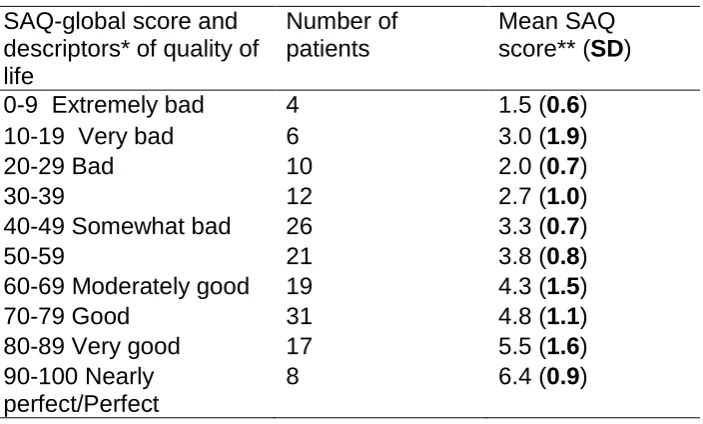
Table E3. Relationship between SAQ and SAQ-global scores
SAQ-global score and descriptors* of quality of life
Number of patients
Mean SAQ score** (SD)
0-9 Extremely bad 4 1.5 (0.6)
10-19 Very bad 6 3.0 (1.9)
20-29 Bad 10 2.0 (0.7)
30-39 12 2.7 (1.0)
40-49 Somewhat bad 26 3.3 (0.7)
50-59 21 3.8 (0.8)
60-69 Moderately good 19 4.3 (1.5)
70-79 Good 31 4.8 (1.1)
80-89 Very good 17 5.5 (1.6)
90-100 Nearly perfect/Perfect
8 6.4 (0.9)
*The position of descriptors is approximate in relation to numbers. The exact position is shown in the SAQ.
**Interpretation of mean: 1 = very, very difficult (worst possible); 2 = very difficult; 3 =