ISSN: 2231-5381
http://www.ijettjournal.org
Page 45
Shape Analysis of Erythrocytes using Mean Shift
Segmentation
Umed Singh#1, Narender Singh*2#1MTech Student, *2Head of the Department CSE
#
Department of Computer Science & Technology Ganpati Institute of Technology and Management,Bilaspur,India
Abstract— Blood disorders can cause morphological changes in mature red blood cells so by investigating blood smears morphologically, we can study and distinguish blood diseases such as anemia. In this paper we have taken the different red blood cell images and focused on extracting several features relating to shape, their circularity and elongation with the help of a decision logic all those various types of red blood cells were classified into 5 categories. According to the obtained results, diagnosis of blood disorders such as iron deficiency anemia, the anemia of chronic disease, β-thalassemia trait, sickle cell anemia has been obtained. We have segmented the corpuscles using mean shift technique and otus’s method is used for binarization. We then have successfully extracted the contours and then traversed the contour for extracting the four parameters – diameter, area, shape geometric factor(sgf) and deviation value(dv) and done the classification.
Keywords— Segmentation, Anemia, SGF, DV.
I.INTRODUCTION
Autonomous segmentation, which involves partitioning an image into its constituent parts or objects without human intervention is one of the most difficult tasks in digital image processing[5].The choice of a segmentation technique over another and the level of segmentation are decided by the particular type of image and characteristics of the problem being considered. Blood disorders can cause morphological changes in mature red blood cells so by investigating blood smears morphologically; we can study and distinguish blood diseases such as anemia[7]. On the other hand, because most of the available methods are manual, expensive, time-consuming and depend on the experts expertise so for improving detection rate and increasing its accuracy, a method of automated analysis for the rapid classification of large numbers of red cells from individual specimens can be developed. Shape analysis plays an important role in feature extraction and analysis. In the proposed method, we describe some thresholds to classification. These thresholds have good efficiency in coordination of results. Our method is studying from morphological points of view and the calculated parameters and thresholds allow us to get quantitative results. This is so useful for the pathologists and authorizes him/her to decide in many aspects. Our method provides us with fast, quantitative results which are not very expensive. Morphology is a branch of bioscience dealing with the study of the form and structure of organisms and their specific structural features.[This includes aspects of the outward appearance (shape, structure, colour, pattern) as well as the form and structure of the internal parts like bones and organs. This is in contrast to physiology, which deals primarily with function. Morphology is a branch of life science dealing with the study of gross structure of an
organism or taxon and its component parts. Most taxa differ morphologically from other taxa. Typically, closely related taxa differ much less than more distantly related ones, but there are exceptions to this. Cryptic species are species which look very similar, or perhaps even outwardly identical, but are reproductively isolated[9].
II. IMAGESEGMENTATION
The goal of image segmentation is to cluster pixels into salient image regions, i.e., regions corresponding to individual surfaces, objects, or natural parts of objects. The segmentation could be used for object recognition, occlusion boundary estimation within motion or stereo systems, image compression, image editing, or image database look-up.
A. Mean shift segmentation (Pyramid segmentation)
ISSN: 2231-5381
http://www.ijettjournal.org
Page 46
B. Otsu method for thresholding
Otsu's method is used to automatically perform histogram shape-based image thresholding, or, the reduction of a graylevel image to a binary image. The algorithm assumes that the image to be threshold contains two classes of pixels or bi-modal histogram (e.g. foreground and background) then calculates the optimum threshold separating those two classes so that their combined spread (intra-class variance) is minimal. Otsu's method we exhaustively search for the threshold that minimizes the intra-class variance [3] (the variance within the class), defined as a weighted sum of variances of the two classes:
1 A measure of region homogeneity is variance (i.e., regions with high homogeneity will have low variance).
2 Otsu’s method selects the threshold by minimizing the within-class variance of thetwo groups of pixels separated by the threasholding operator.
3 It does not depend on modeling the probability density functions, however, itassumes a bimodal distribution of gray-level values (i.e., if the image approximately fits this constraint, it will do a good job).
Weights are the probabilities of the two classes
seperated by a threshold and variances of these classes.
Otsu shows that minimizing the intra-class variance is the same as maximizing inter-class variance:
which is expressed in terms of class probabilities and class means .
4. The class probability is computed from the histogram as :
while the class mean is:
where is the value at the center of the th histogram
bin. Similarly, you can compute and on the right-hand side of the histogram for bins greater than .The class probabilities and class means can be computed iteratively. This idea yields an effective algorithm[3].
III
.S
HAPEA
NALYSISA shape parameter is a set function value of which does not depend on geometrical transformation such as translation, rotation, size changes and reflection. Currently three main directions in shape analysis can be observed: functional approach, set theory approach and point description. Each of
them is based on certain mathematical ideas, that is, how the objects of which the shape is analyzed, are treated in mathematical terms. It is assumed that the two-dimensional information is sufficient for a reasonable characterization Further, it is always assumed that the objects are sets in the sense of mathematical set theory and that the sets are compact and closed in the topological sense .Such sets are called figures. Processing of figures in sense of set theory leads to the set theoretic approach of shape analysis[2]. An important method for characterizing figures is the representation of their contours by functions. Such representation is possible in many ways and it results in the functional approach of shape analysis. Having such contour functions, many results of functional analysis and differential geometry can be applied to study the shape. The third direction in shape analysis (which is not discussed here) is related to the replacement of figures by a few points which usually lie on the contour and are defined by some geometrical properties or have a certain physical meaning[1].
A
Contour Tracing
Contour tracing is a technique that is applied to digital images in order to extract their boundary, The boundary of a given pattern P, is the set of border pixels of P. There are 2 kinds of boundary (or border) pixels: 4-border pixels and 8-border pixels. A black pixel is considered a 4-8-border pixel if it shares an edge with at least one white pixel. On the other hand, a black pixel is considered an 8-border pixel if it shares an edge or a vertex with at least one white pixel. (A 4-border pixel is also an 8-border pixel. An 8-border pixel may or may not be a 4-border pixel.)it is not enough to merely identify the boundary pixels of a pattern in order to extract its contour. we need is an ordered sequence of the boundary pixels from which we can extract the general shape of the pattern[10].
B Shape Parameters
After traversing the contour we can extract the features or parameters of shape. Many distributions are not a single distribution but a family of distributions. This is due to distributions having one or more shape parameters. Shape parameters allow a distribution to take on a variety of shapes, depending on the value of the shape parameter[2]. These distributions are particularly useful in modeling applications since they are flexible enough to model a variety of data sets.
Table a: Shape parameters and their description
Shape
Parameter Feature Description
A Area Sum of pixels enclosed by cell boundary
D Diameter
sqrt((rectheight)2+(rectwidth)2)
SGF Geometric Shape Factor
Proportion of peripheral oval's diameters
ISSN: 2231-5381
http://www.ijettjournal.org
Page 47
IV.
METHODOLOGY
.
Figure 1: Design of Architectural Module
We have segmented the image of red blood cells by mean shift segmentataion, that uses color merge over scale to segment the image. Then we convert the segmented image to binary scale image using otus’s method of thresholding by setting a particular value of threshold.We have then extracted the contours from binary image using chain code. The contour pixels are generally a small subset of the total number of pixels representing a pattern. Once the contour of a given pattern is extracted, it's different characteristics will be examined and used as features which will later on be used in pattern classification. Contours are traversed using 8-way connected approach.Features are extracted by using contour information. Features help in analysis of various types of shapes and their classification. Various features of a particular shape is extracted such as ( area, diameter, shape geometric factor and deviation value.).Further these shapes are classified.
V.
R
ESULTSWe have segmented various images by using the Mean-Shift Segmentation. In this section, we demonstrate results that represent our findings from these experiments.
A
.
Normocyte (Normal Red Blood Cell)
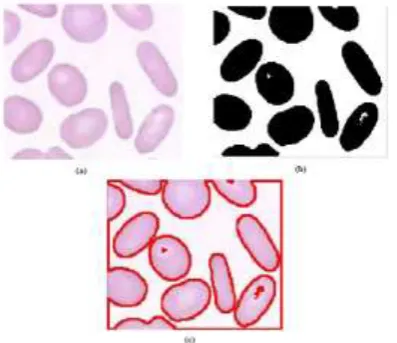
Red blood cells, also called erythrocytes, are the most abundant cell type in the blood. Other major blood components include plasma, white blood cells, and platelets. The primary function of red blood cells is to transport oxygen to body cells and deliver carbon dioxide to the lungs. A red blood cell has what is known as a biconcave shape[7]. We have taken the synthetic image of normal RBC and applied Mean-shift segmentation on it to get segmented image and hence extracted the shape parameters. The results are shown in figure 2. The extracted shape parameters(Diameter, Area, SGF, DV) of Normocyte are shown in table 2. It has been analysed that the SGF value of normal RBC lies between 1.1-2.0 and DV value is less than 0.0005.
.
DV
0.000273
Figure 2: (
a) Original image of Normocyte (b)Binarized image (c) Segmented image
Table b:
Extracted shape parameters of Normocyte.Shape Parameters
Value in pixels
DIAMETER 105.645634
AREA 4244.00000
SGF 1.159420
DV 0.000273
B.
Elongated RBC
We have taken the synthetic image of elongated RBC and applied Mean-shift segmentation on it to get segmented image and hence extracted the shape parameters. The results are shown in figure 3 and The extracted shape parameters(Diameter, Area, SGF, DV) of Elongated RBC are shown in table 3. It has been analysed that the SGF value of abnormal RBC is greater than 2 and DV value is also greater than 0.0005.
Figure 3:(a) :Original image of Enlarged RBC (b)
Binarized image (c) Segmented image
Take input images
Segmentation and binarization using mean shift(color merge) and
Otsu(minimum class
variance)
Contour processing (extraction &traversal)using
chain code(8
way connected)
ISSN: 2231-5381
http://www.ijettjournal.org
Page 48
Table C:Extracted shape parameters of Elongated
RBC
Shape Parameters Value in pixels
DIAMETER 74.732858
AREA 1371.50000
SGF 2.193548
DV 0.001599
C.
Spherocyte
Spherocytes are red cells whichhave assumed the form of a sphere rather than the normal discoid shape. As a result, they appear on routine blood films as cells that are smaller and more dense than normal red cells of the species. We have taken the synthetic image of Spherocytes and applied Mean-shift segmentation on it to get segmented image and hence extracted the shape parameters. The results are shown in figure 4.
Figure 4:
(a)
:Original image of Spherocyte
(b)
Binarized image
(c)
Segmented image
Table 4:
Extracted shape parameters of
Spherocytes
Shape Parameters Value in pixels
DIAMETER 54.488851
AREA 1095.0000
SGF 0.925000
DV 0.000845
D. Sickle Cell
Sickle cell anemia is a genetically inherited disease in which the people who suffer from this disease develop abnormally shaped red blood cells - an elongated shape like a sickle instead of the normal spherical shape of hemoglobin - which decrease its affinity to oxygen. We have taken the synthetic
image of Sickle RBCs and applied Mean-shift segmentation on it to get segmented image and
hence extracted the
shape parameters. The results are shown in figure
5.
E. Thalassemia
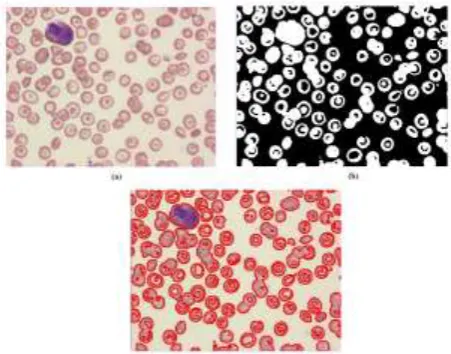
Red blood cells will appear small and abnormally shaped. Thalassemia is a blood disorder passed down through families (inherited) in which the body makes an abnormal form of hemoglobin, the protein in red blood cells that carries oxygen[8]. We have taken the synthetic image of blood of Thalassemia patient and applied Mean-shift segmentation on it to get segmented image and hence extracted the shape parameters. The results are shown in figure 6
Figure 5:
(a)
:Original image of Thalassemic RBS
(b)
Binarized image
(c)
Segmented image
Table 6: Extracted shape parameters of Thalassemic
RBC
Shape Parameters Value in pixels
DIAMETER 44.553339
AREA 745.500000
SGF 1.032258
DV 0.1385
VI.
C
ONCLUSIONISSN: 2231-5381
http://www.ijettjournal.org
Page 49
References
[1] Andy Tsai*, Anthony Yezzi,” A Shape-Based Approach to the Segmentation of Medical Imagery Using Level Sets” IEEE transactions on medical imaging, vol. 22, no. 2, February 2003 [2] C. igathinathane et al,” Shape identification and particles size
distribution from basic shape parameters using ImageJ”, 2008 Elsevier B.V.
[3] D. Karakuş, A. H. Onur, A.H. Deliormanlı, G. Konak,” Size and shape analysis of mineral particles using image processing technique”, The Journal of ORE DRESSING ® 2010.
[4] Dorin Comaniciu, Peter Meer, “Mean Shift: A Robust Approach towards Feature Space Analysis”, IEEE Transaction on Pattern Analysis and Machine Intelligence, Vol. 24, No. 5, May 2002. [5] Gonzales : Digital Image Processing, Prentice Hall (3th Edition.) [6] Kuo - Lung Wu and Miin - Shen Yang,”Mean Shift based
Clustering” Journal Pattern Recognition Vol 40,Issue 11 ,Nov 2007 [7] Navin D. Jambhekar, “Red Blood Cells Classification using Image
Processing” Science Research Reporter, Nov 2011,pp 151-154 [8] Vinod Kumar Katiyar, Demeke Fisseha,” Analysis of Mechanical
Behavior of Red Blood Cell Membrane with Malaria Infection ”,World Journal of Mechanics, 2011, 1, pp 100-108. [9] W. Wang and J. Paliwal.” Separation and identification of touching
kernels and dockage components in digital images”, Volume 48, 2006.
[10] Ziegler, Anne Greet Bittermann, Mathias, ”Basic introduction to
image processing.”,