An energy-e
ffi
cient framework for multimedia data
routing in Internet of Things (IoTs)
Minh T. Nguyen
Thai Nguyen University of Technology, Viet Nam,[email protected]
Abstract
The Internet of Things (IoTs) is an integrated network including physical devices, mobile robots, cameras, sensors, vehicles, etc. There are many items embedded with electronics, software to support a lot of applications in different fields. These internet-based networks have many different types of data to be transmitted and processed. Either reducing data transmission or lowering energy consumption for such networks is critically considered. Compressed sensing (CS) technique is known as a novel idea to compress and to reconstruct correlated data well with a small certain number of CS measurements. This paper proposes an energy-efficient scheme for data routing for IoTs utilizing CS techniques. The ideas show how to apply CS into IoT applications with different kinds of data like images, video streaming and simply as sensor readings. After the CS sampling process, the IoT system only needs to transmit a certain number of CS measurements instead of sending all collected sensing data. At the receiver side, the system can reconstruct perfectly the original data based on the measurements. Different kinds of IoT data is analyzed to be used with CS. Data routing methods are suggested for suitable cases. Simulation results working on different types of multimedia data are provided to clarify the methods. This work also provides an additional way to protect the sensing data for security purposes in the networks.
Receivedon 22 March 2019;acceptedon 29 March 2019;publishedon 13 June 2019
Keywords: Internet of Things, Data routing, Compressed sensing, Data reconstruction.
Copyright © 2019Minh T. Nguyen et al., licensed to EAI. This is an open access article distributed under the terms of the Creative Commons Attribution license (http://creativecommons.org/licenses/by/3.0/), which permits unlimited use, distribution and reproduction in any medium so long as the original work is properly cited.
doi:10.4108/eai.13-6-2019.159120
1. Introduction
The Internet of Things (IoTs) is providing many applications in different fields. The main goal is to create an internet-based network to connect everything including electronic devices and human demands [1]. The networks can connect to control different devices and systems remotely. Systems are in smart houses or industrial/military fields which can contact to each other for different purposes. IoTs support other networks for further effectiveness.
Traditional wireless sensor networks (WSNs) collect data from a sensing area to be sent to a base-station (BS). The BS could be at fixed positions to gather sensing data. With the integration between IoTs and WSNs, the data can be sent through cloud or internet to be stored everywhere needed. The BS could be set up anywhere to be able to collect data [2–5].
IoTs facilitate smart home with many kinds of appli-cations [6]. All electronic equipments are connected into the internet. Their owner can control each device like turning on/off or set up schedules for all the connected equipments. In addition, different kinds of sensors are installed inside the house for monitoring
purposes. Air condition, fire alarm systems work based on the information provided by the sensors.
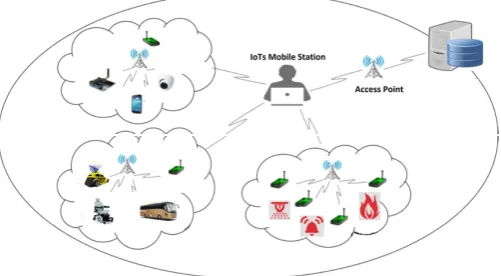
Figure 1. A general picture of IoT applications in the real world. Many application are integrated into IoTs with different kinds of data
IoTs also support monitoring systems for other systems, such as the systems to monitor oil leak underwater, the systems to observe earth quake, etc [7– 9]. The systems can send and store their data in the
internet. The BS or data processing center can be anywhere to analyze the date. However, a huge of data transmitting via the internet requires high bandwidth or high speed transmission lines that cost a lot. We are looking for energy-efficient methods to reduce the load burden for such networks.
Compressed sensing (CS) [10,11] techniques support compressible data to send only a certain number of CS measurements to be able to recover the whole data with an acceptable quality of service (QoS). The number of data packets could be reduced significantly if CS is applied into the systems. Generally, data transmitting via IoTs is often high correlated and compressible that basically satisfies the requirements to be able to employ CS in the systems. With CS, the IoT systems do not need to send all sensing values but only a much smaller number of CS measurements that saves power consumption.
There are many data collection methods utilizing CS to reduce sensing data in a lot of applications in different fields. In [12–14], random walk routing integrates CS to exploit the random distribution of sensors to sample and to collect CS measurements from WSNs. Other routing methods, such as tree-based [15,16], cluster-based [17–19] and neighborhood based [20,21] also employ CS to reduce sensing data in such networks significantly. Currently, CS is also applied to mobile sensor networks or robotic networks to exploit the mobility of robots [22–26]. The mobile sensors or robots share their readings to each other and form CS measurements to be able to reconstruct data at each distributed robot. The methods not only reduce data transmitting in such networks but also support the communications within the networks. In [27], the authors exploit Modulation and Coding Scheme (MCS) to possibly reduce the transmission power in IoTs networks. In overall, CS techniques are shown to be promising to support sensing data in different fields.
In this paper, an energy-efficient method is proposed to integrate CS into the systems to reduce significantly data transmission in the IoTs networks. Since there are different kinds of data that need to be considered in IoTs, our method is flexible to be able to sample and reconstruct those data. In addition, the method is deployed with different kind of data in different systems to show the effectiveness of the methods. Sensing data from WSNs, event detection data and video data would be considered to able to apply CS to reduce significantly data transmission. Energy consumption is also analyzed and simulated.
The remainder of this paper is organized as follows. Compressed sensing (CS) Background and Problem Formulation are addressed in Sections II and III, respectively. Simulation results are provided in Section IV. Finally, Conclusions and Future work are in Section V.
2. Compressed Sensing (CS) Background
2.1. Data Representation
Compressed sensing (CS) has been known as a signal processing method to reduce redundant data [10,11]. Hight correlated data can be sampled as a certain number of CS measurements and then reconstructed perfectly. In general, the requirements to be able to utilize CS are the signals should be sparse or compressible in proper domains.
In order to clarify the signal representation, a data vector X∈RN (X= [x1x2. . . xN]T) is considered as k-sparse vector ifXhasknon-zero entries in the canonical basis and the rest of X can be considered as zeros. In other cases whenXis dense in canonical basis, but the vector is sparse in other domains, for instant Wavelet or DCT,X is still considered sparse in the domains. It could be represented as X=Ψ Θ in which Θ has only knon-zero transformed coefficients.Ψ ∈RN×Nis called the sparsifying matrix.
2.2. Data Sampling
X with N elements could be sampled to be able to achieve M measurements while MN. The ways of sampling also could be variable.
Vector Y∈RM(Y= [y1y2. . . yM]T ) is called mea-surement vector that includes M CS measurements. Each measurement is a linear combination of vectorX
asyi =Pnj=1ϕi,jxj. The vector is calculated asY=ΦX whereΦ∈RM×N
is called the measurement or sampling matrix and is often a full-Gaussian matrix [11] or a binary matrix [28]. yi represents the ith CS measure-ment and ϕi,j represents the corresponding entries of
Φat theithrow. The CS techniques allowMN. This could support any systems applying CS much easier to store, to transmit, and to retrieve Y compared to the uncompressedX.
Figure 2. Sparse signal vector X can be sampled to be Ywith much shorter for the compression purpose
2.3. Data Recovery
Based on the measurement vectorY, the data vectorX
could be reconstructed perfectly. The length of Y
vectorXcan be recovered with high probability as ˆ
Θ=Arg MinkΘk1, Subject to Y=ΦΨ Θ. (1) whereXis sparse inΨ domain asX=Ψ ΘwithkΘk1= PN
i=1|θi|. The l1 optimization problem can be solved
with Basis Pursuit (BP) [10].
In practical, noise should be considered. The CS measurements are collected as:Y=ΦX+e, and||e||2 < to be able to recoverXas follows
ˆ
Θ=Arg MinkΘk1, Subject to kY−ΦΨ Θk2< . (2)
3. Problem Formulation
3.1. Data Analysis
Since IoTs facilitate many applications in different fields, there are also different kinds of data transmitting in the networks. Fortunately, all kinds of data such as images, temperatures, humidity, vibration, light, etc. are highly correlated. In other words, they are compressible that satisfy the CS conditions to be able to sample and reconstruct data.
As mentioned in the Section2, sensing data can be considered asN scalar values contained in the vectorX
which is compressible or sparse in proper domains as
X=Ψ Θ, (3) where Θ= [θ1θ2. . . θN]T. Θ has k non-zero elements
(in other words, large transformed coefficients). The rest of θi can be considered as zeros. Θ normally has this property
|θ1| ≥ |θ2| ≥...≥ |θN|. (4)
Ψ referred to as the sparsifying matrix, is an orthogonal basis of RN. If X is a k-sparse vector, Ψ is an identity matrix. Otherwise, Ψ can be chosen from another domain such as Wavelet, DCT (discrete cosine transform), etc. In the simulation result section, we would show DCT and Wavelet for sparsifying the data.
As mention in Equation 4 the coefficients obey a power law decay if there exist constantsθ1andqsuch
that |θi| ≤θ1i−q. It is clear that the largerq, the faster the magnitudes decay the more compressible a signal could be. The presentations of this kind of signals are illustrated in Figures5and8.
3.2. Proposed General Algorithms for Data
Aggregation in IoTs
As mentioned the previous sections, CS techniques support many applications with data compressing for energy-efficient purposes. In the proposed Algorithm1, there are three basic phases including Collecting data, Creating CS measurements and Reconstructing sensing data.
In the first phase, sensing data is collected and analyzed or sorted to be able to apply CS. Each procedure is addressed in details in simulation section according to different kinds of data.
Phase 1. Collecting Data:
- Sensing data is collected at each IoTs device, as sensor, camera
- The data is analyzed/sorted before the CS sampling process
Phase 2. Sampling into CS measurements:
- The collected data is multiplied to a chosen measurement matrix
- A random seed is stored to be sent along with CS measurements. This is the hidden key for security and privacy purposes.
Phase 3. Reconstructing Original Data
- Creating the measurement matrix based on the random received along with the CS
measurements
- An appropriateΨ is chosen to be able to recover ˆ
Θfollowing equations in Section2 - Recover the sensing data ˆXas ˆX=ΨΘˆ
- Normalized reconstruction error is considered to evaluate the recovery progress askX−Xˆk2
kXk2
Algorithm 1: Compressed Sensing Based Energy-Efficient Data Routing for Internet of Things (IoT-CS)
In the second phase, the collected data is sampled and CS measurements are created. The measurement matrix is chosen depending on the way the data is collected. As mentioned in [13, 19, 25], sparse binary measurement matrices [28] help to reduce significantly energy consumption for data routing methods, such as random walk, clustering and random mobile routing. In other cases, Gaussian matrix could be chosen as a measurement matrix to sample and create CS measurements. A random seed that corresponds to the measurement matrix created needs to be sent to the receiver side attached to the CS measurements for the recovery process. Without the seed, the receiver cannot reconstruct the whole data right. This is the key point to protect the sensing data via the networks.
In the last phase (Phase 3), after receiving a certain number of CS measurements, the data processing center creates the same measurement matrix based on the seed and reconstruct all sensing data. Note that, the greater the number of CS measurements collected, the higher quality the reconstructed data at the base-station or data processing center.
4. Energy Efficiency Analysis
Generally, energy consumption for transmitting and receiving data in wireless sensor networks (WSNs) [29], denoted asPT xandERx, are formulated, respectively as
ET x=ET0+EA(d, N) (5)
and
ERx=ER0. (6)
ET0 and ER0 are two energy consumption levels of electrical elements for coding, modulating or signal processing. They do not depend on transmitting distances, denoted asd, in either WSNs or IoTs systems. In this paper, we only consider the consumed energy of the power amplifierEA(d, N) which is a function ofd. N represents the number of sensor readings, specified as scalar values. The total energy consumption for transmitting data in such networks contain two parts, the energy consumed over a distancedand the amount of data to be transmitted asN following
EA(d, N) =PA(d)N . (7)
As mentioned in the Section 2 and Section 1, the number of CS measurements required to be able to reconstructN scalar values could beM, whileMN. Conclusion can be made that the energy consumption could be much smaller to transmitMCS measurements compared to sensingN values. Note that, only raw data is considered for simplicity. In the real systems, all the raw data is modulated and encoded to be transmitted via channels.
5. Simulation Results
In this section, different kinds of the most common data in IoTs are processed utilizing CS to compress and to recover simply. Simulation results are provided as follows.
5.1. IoT-CS Work with Image
Figure 3. An example of an image to be compressed and reconstruct
Figure 3 shows the image that would be processed to be sent via a IoT system. The image is read into
scalar coefficients. These coefficients are often highly correlated or compressible. After reading, we achieve a scalar vector XN×1. A measurement matrix Φ∈ RM×N is chosen to create CS measurements. Only M measurements are created by multiplyingΦXas shown in Section 2 and are sent to the receiver side of the IoT system. Instead of sendingN values, onlyMlinear combination measurements are sent that significantly reduces data transmitting in the system.
Figure 4. An image is read with a random selection of 30x30 to make 900 points
Figure 5. The image is partly transformed by both DCT and Wavelet basics
the comparison between DCT and Wavelet working as the sparsifying basis since the original data is dense, as mentioned in Section3.1. Wavelet basis seems to work as well as DCT in this kind of data. In other kinds of data, DCT could perform better than Wavelet in CS recovery processes.
Figure 6. The image is reconstruct by the CS recovery algorithm L1 using both DCT and Wavelet basics
5.2. IoT-CS Work with temperature
In this section, assume that all sensor nodes need to send their readings to a Base-station (BS) or data pro-cessing center through a IoT system. The data need to be as precise as possible. Real temperatures are chosen for this experiment to clarify the method. These real tem-peratures are collected from the project Sensorscope: Sensor Networks for Environmental Monitoring [30]. As shown in Figure7 the temperatures seem dense in canonical basis but they are actually sparse in other domains, such as DCT (discrete cosine transform) or Wavelet. Both DCT and Wavelet are chosen for spar-sifying the temperature data to be able to apply CS to reconstruct at the receiver side.
Figure8shows the transformed coefficients achieved from both DCT and Wavelet sparsifying basics. The large coefficients focus on the very first values and remainder are very small. This means that the data is compressible as mentioned in Section3.1.
Figure9shows the reconstruction errors after all the sensing data is recovered. With the CS performance to reconstruct data, only M= 500 CS measurements are required at the data processing center to be able to recover 2000 values of temperatures at the normalized reconstruction error as 0.1 . The reconstruction errors via different number of CS measurements are provided with both basics as DCT and Wavelet. It is shown in Figure 9 the basis DCT works better than the
Figure 7. Temperatures collected from 2000 sensors randomly distributed in a sensing area
Figure 8. Transformed coefficients corresponding to 2000 sensor readings created by DCT and Wavelet for comparison purposes
Wavelet as the sparsifying matrix. Note that, the greater the number of CS measurements created, the lower the reconstruction error. As shown in Figure 9, in comparison, DCT basis works better than Wavelet basis with CS performance on high correlated data, especially temperature data. This finding could be used for other applications working with this kind of data.
5.3. IoT-CS Work Video Streaming Data
Figure 9. Reconstruction errors from the CS reconstruction processes with DCT and Wavelet as sparsifying basics
Each image or picture is not considered to be sampled. The main idea is, the difference between each frame of picture is considered to be sampled. Let’s considerN pictures in a time unit. Only the first picture is sent via the IoT system. The difference between two picture is defined as follows.
X=Pi−P
i+1, (8)
wherePirepresents one picture in an unit of time. If all the objects in the video streaming do not move, it means that there is no difference betweenN picture and the scalar vectorXhas all zeros.
Figure 10. An illustration of a video streaming with the first picture and the rest are some changing if the video streaming may have. The first picture and 1000 random Gaussian scalar values representing the differences between 1000 pictures including the first one.
Normally, some objects move between frames of pictures and almost of the other do not. This creates a sparse vector with only some non-zero elements and the rest are zeros as shown in Figure 10. Sending the sparse vector is also an energy saving paradigm. However, with CS the sparse vector, noted asX, needs
to be sampled to reduce the data transmission in IoT networks. Figure10shows ak-sparse vector with only 50 non-zero elements and the rest contains zeros due to the unchanged points between pictures in the video streaming. It is obvious thatXis a sparse random vector and also highly correlated since the objects randomly move between consecutive picture frames smoothly.
As mentioned, if only N scalar values from X are sent, this could also be an energy-efficient method. However, using CS in this case could be more energy-efficient. Only M measurements are sent after the CS sampling process. This method can reduce much smaller compared to the video streaming data.
A
ve
ra
g
e
R
e
co
n
st
ru
ct
io
n
E
rr
o
r
Figure 11. Reconstruction error in the recovery 50-sparse signal length 1000 based on small number of CS measurements
Figure 11 shows the reconstruction error with different number of CS measurements collected. It is clear that the difference between picture frames or the sparse vector is reconstructed perfectly with appropriate number of CS measurements. Based on the difference as know as X, the original pictures are recovered following the inversion of the Equation8.
* Discussion: Table 1 provides a comparison of different methods to transmit a video streaming through IoT systems. With IoT-CS, the amount of data transmitting reduces significantly that up to 80% as shown in Figure11.
6. Conclusions and Future Work
Table1. ComparisontabletoshowthebenefitofusingIoT-CS
Transmission Paradigm Data to be transmitted Note Transmit all frames of pictures P1+P2+...+PN+1
Transmit the first picture and all the differences between the picture frames
P1+XN×1 N M
IoT-CS: Transmit the first one and the CS measurements sampled from the differences
P1+YM×1 Reduce up to 80%
connecting to IoTs. Simulation results are provided to clarify the energy-efficient problems and show promise for many applications in the real world. This work also clarifies the proper domains to be able to apply with different kinds of data transmitting in the systems. DCT should be the right choice for sensing data. The hidden random seeds to generate CS measurements support security and privacy purposes in the IoT networks. In the future work, more details for each method would be calculated and formulated. More applications would be mentioned and guided to be used more efficiently. Propagation for transmitting data also should be considered.
References
[1] D. Miorandi, S. Sicari, F. D. Pellegrini, and I. Chlamtac, “Internet of things: Vision, applications and research challenges,”Ad Hoc Networks, vol. 10, no. 7, pp. 1497 – 1516, 2012.
[2] G. Han, H. Xu, T. Q. Duong, J. Jiang, and T. Hara, “Localization algorithms of wireless sensor networks: a survey,”Telecommunication Systems, vol. 52, pp. 2419– 2436, Apr 2013.
[3] A. Al-Fuqaha, M. Guizani, M. Mohammadi, M. Aledhari, and M. Ayyash, “Internet of things: A survey on enabling technologies, protocols, and applications,” IEEE Com-munications Surveys Tutorials, vol. 17, pp. 2347–2376, Fourthquarter 2015.
[4] N.-S. Vo, D.-B. Ha, B. Canberk, and J. Zhang, “Green two-tiered wireless multimedia sensor systems: An energy, bandwidth, and quality optimization framework,”IET Communications, vol. 10, pp. 2543–2550, Dec 2016. [5] G. Han, J. Jiang, C. Zhang, T. Q. Duong, M. Guizani, and
G. K. Karagiannidis, “A survey on mobile anchor node assisted localization in wireless sensor networks,”IEEE Communications Surveys Tutorials, vol. 18, pp. 2220– 2243, thirdquarter 2016.
[6] I. Lee and K. Lee, “The internet of things (iot): Appli-cations, investments, and challenges for enterprises,”
Business Horizons, vol. 58, no. 4, pp. 431 – 440, 2015. [7] L. Mainetti, L. Patrono, and A. Vilei, “Evolution
of wireless sensor networks towards the internet of things: A survey,” inSoftCOM 2011, 19th International Conference on Software, Telecommunications and Computer Networks, pp. 1–6, Sept 2011.
[8] N.-S. Vo, T.-H. Nguyen, and H. K. Nguyen, “Joint active duty scheduling and encoding rate allocation optimized performance of wireless multimedia sensor networks in smart cities,”ACM/Springer Mobile Networks & Applications, vol. 23, pp. 1586–1596, Dec 2018. [9] N.-S. Vo, T. Q. Duong, M. Guizani, and A. Kortun, “5G
optimized caching and downlink resource sharing for smart cities,”IEEE Access, vol. 6, pp. 31457–31468, May 2018.
[10] D.L.Donoho, “Compressed sensing,”Information Theory, IEEE Transactions on, vol. 52, pp. 1289 – 1306, 2006. [11] E. Candes, J. Romberg, and T. Tao, “Robust uncertainty
principles: exact signal reconstruction from highly incomplete frequency information,”Information Theory, IEEE Transactions on, vol. 52, pp. 489 – 509, Feb. 2006. [12] M. T. Nguyen, “Minimizing energy consumption in
random walk routing for wireless sensor networks utilizing compressed sensing,” in System of Systems Engineering (SoSE), 2013 8th International Conference on, pp. 297–301, June 2013.
[13] M. T. Nguyen and K. A. Teague, “Compressive sensing based random walk routing in wireless sensor networks,”Ad Hoc Networks, vol. 54, pp. 99 – 110, 2017. [14] V. T. Quang and T. Miyoshi, “Energy balance on adaptive routing protocol considering the sensing coverage problem for wireless sensor networks,” in
Communications and Electronics, 2008. ICCE 2008. Second International Conference on, pp. 86–91, IEEE, 2008. [15] R. Xie and X. Jia, “Minimum transmission data gathering
trees for compressive sensing in wireless sensor networks,” in Global Telecommunications Conference (GLOBECOM 2011), 2011 IEEE, pp. 1–5, Dec 2011. [16] M. T. Nguyen and K. A. Teague, “Tree-based
energy-efficient data gathering in wireless sensor networks deploying compressive sensing,” in2014 23rd Wireless and Optical Communication Conference (WOCC), pp. 1–6, May 2014.
[17] M. T. Nguyen and N. Rahnavard, “Cluster-based energy-efficient data collection in wireless sensor networks utilizing compressive sensing,” inMILCOM 2013 - 2013 IEEE Military Communications Conference, pp. 1708– 1713, Nov 2013.
2007), pp. 95–100, 2007.
[19] M. T. Nguyen, K. A. Teague, and N. Rahnavard, “Ccs: Energy-efficient data collection in clustered wireless sen-sor networks utilizing block-wise compressive sensing,”
Computer Networks, vol. 106, pp. 171 – 185, 2016. [20] M. T. Nguyen and K. A. Teague, “Neighborhood based
data collection in wireless sensor networks employing compressive sensing,” in 2014 International Conference on Advanced Technologies for Communications (ATC 2014), pp. 198–203, Oct 2014.
[21] L. Quan, S. Xiao, X. Xue, and C. Lu, “Neighbor-aided spatial-temporal compressive data gathering in wireless sensor networks,”IEEE Communications Letters, vol. 20, pp. 578–581, March 2016.
[22] Y. Mostofi, “Compressive cooperative sensing and mapping in mobile networks,” IEEE Transactions on Mobile Computing, vol. 10, pp. 1769–1784, Dec 2011. [23] M. T. Nguyen and K. A. Teague, “Random sampling
in collaborative and distributed mobile sensor networks utilizing compressive sensing for scalar field mapping,” in 2015 10th System of Systems Engineering Conference (SoSE), pp. 1–6, May 2015.
[24] M. T. Nguyen and K. A. Teague, “Compressive and cooperative sensing in distributed mobile sensor networks,” in MILCOM 2015 - 2015 IEEE Military
Communications Conference, pp. 1033–1038, Oct 2015. [25] M. T. Nguyen, H. M. La, and K. A. Teague, “Collaborative
and compressed mobile sensing for data collection in distributed robotic networks,” IEEE Transactions on Control of Network Systems, pp. 1–1, 2017.
[26] V. Tran-Quang, P. N. Huu, and T. Miyoshi, “A col-laborative target tracking algorithm considering energy constraint in wsns,” inSoftware, Telecommunications and Computer Networks (SoftCOM), 2011 19th International Conference on, pp. 1–5, IEEE, 2011.
[27] A. Orsino, G. Araniti, L. Militano, J. Alonso-Zarate, A. Molinaro, and A. Iera, “Energy efficient iot data col-lection in smart cities exploiting d2d communications,”
Sensors, vol. 16, no. 6, 2016.
[28] R. Berinde, A. C. Gilbert, P. Indyk, H. J. Karloff, and M. J. Strauss, “Combining geometry and combinatorics: A unified approach to sparse signal recovery,” CoRR, vol. abs/0804.4666, 2008.
[29] Q. Wang, M. Hempstead, and W. Yang, “A realistic power consumption model for wireless sensor network devices,” in Sensor and Ad Hoc Communications and Networks, 2006. SECON ’06. 2006 3rd Annual IEEE Communications Society on, vol. 1, pp. 286–295, Sept 2006.