891
Application Of Taguchi’s Experimental Design And
Range Analysis In Optimization Of FDM Printing
Parameters For PET-G, PLA And HIPS
N. Mohammed Raffic, Dr.K.Ganesh Babu P.Madhan
Abstract: The present work aims to conduct optimization of Fused Deposition Modeling printing parameters for three different materials namely PET-G, PLA and HIPS which has less consideration than the conventionally adopted material ABS by various authors in the area of research in past decades for the assessment of specimen weight and fatigue strength. The FDM printing parameters such as Slice Height, Infill Density, Shell Thickness and Raster Angle are varied with three levels (34) to create the experimental design matrix as per Taguchi’s experimental design.Taguchi’s S/N ratio method and
Range Analysis are the analysis tools considered for obtaining the optimum parameter combination and significant factor over the output responses measured. From both the above mentioned methods it is observed that Infill density is the most significant factor which affects the specimen weight by contributing 92.14% , 88.86% , 63.52% and fatigue strength by 60.18% , 50.86% , 53.90% for PET-G,PLA and HIPS. PET-G is found to have more fatigue strength than PLA and HIPS. The specimens made out of HIPS are found to weigh less than other materials considered. The optimum parameter combination for both the responses are found to have good agreement in all the three materials considered. Inclusion of other input printing parameters associated with the process and adoption of various DOE methods and optimization techniques are suggested as further research directions from the present work to have a deep insight of the study concerned respectively
Index Terms: ANOVA, Fatigue Strength ,FDM , Range Analysis, Signal to Noise Ratio,Taguchi’s Orthogonal Array.
————————————————————
I.
INTRODUCTION
The continuous growth and long time success of any industry in the market has a linear relationship with customer satisfaction it attains through its products and best services it provides. Optimization is a procedure adopted by engineers and scientists in order to reduce the variation occurring in a product by controlling the parameters and characteristics pertinent to product design and development. The input process parameters selected will have a serious effect over the final performance of a product or system with no doubt. Many methods like Taguchi’s Orthogonal Array, Response Surface Methodology are generally adopted by authors to create the experimental plan and the experimental data is further analyzed to obtain the optimum parameter combination and also the significant parameter which has the maximum effect over the final response under study. Samir Kumar Panda [1] et.al has conducted studies to optimize the FDM input parameters such as layer thickness, build orientation, raster width, air gap and raster angle for ABS – P400. The authors have experimentally identified the various mechanical properties like mechanical, flexural and impact strength of FDM samples through the experimental plan devoloped by Central composite design. The experimental results obtained are further analysed using bacterial foraging technique for identifying the optimum parameter combination. The authors have advised to avoid small raster angle which may result in stress accumulation in the direction of deposition and higher raster width may improve strong bond formation between the rasters. Vishwas M [2] et.al has optimized the FDM process parameters for materials such as ABS and Nylon by considering the input parameters model orientation, shell thickness and layer thickness. The taguchi’s L9 orthogonal array experimental plan has been devised for conducting the experiments for identifying the ultimate strength and dimensional accuracy of the parts prepared by both ABS and Nylon using FDM Pramaan Mini machine. The results observed are further analysed through Signal to noise ratio method and it has been identified that both shell thickness and orientation angle are most impacted process parameters over the mechanical properties of both the materials. The optimum
892
2. Fused Deposition Modeling
Fused Deposition Modeling (FDM) is a low cost thermoplastic based additive manufacturing process which has application in the making of prototypes and functional models. The Process is also known by its other names such as Fused Filament Fabrication (FFF), Material Extrusion (ME) in the market. The process has the involvement of numerous printing parameters and material options in general. The appropriate selection of parameters are highly essential to have quality print out of the FDM machine. Materials like Acronitrile Butadiene Styrene (ABS), Poly Lactic Acid (PLA) , Poly Ethylene Terethalate-Glycol added (PET-G), High Impact Poly Styrene (HIPS),Polyamide (PA) and many other materials can be printed with less difficulty. The process works under the principle of extruding the raw material loaded in the form of a filament in a spool through a heated nozzle over a heated or unheated bed. The filament is added layer by layer to get the final shape of the output. The process starts with a cad model and ends up with a tangible solid object. The cad model prepared through solid modeling software has to be inputted in to the slicing software in form of .stl file for slicing the model in to individual layers. The slicing software has various options for controlling the FDM parameters such as Layer Thickness, Infill Density, Shell Thickness, Raster Angle, Printing Speed, Air Gap, Bed Temperature, and Nozzle Temperature. The sliced model with the prementioned parameters can be previewed before ordering the machine to print the object. The Slicing software also generates the G- code for the object generated through FDM process. The definitions of the FDM Printing Parameters considered in the present work are detailed below. a) Slice Height: An important FDM parameter also known as Layer Thickness which may be defined as the height of the individual layer to be deposited one over the another to attain the final model. Lesser the value will result in more number of layers and increased strength.
b) Infill Density: It is defined as the amount to material to be filled inside the solid object normally expressed as percentage. Higher the value more the amount of material consumed by the model and also increases the weight and cost of the specimen
c) Shell Thickness: It is defined as the thickness of the top and bottom layers of the solid object which are visible to the observer.
d) Raster Angle: It is the angle made by the raster with respect to the horizontal which may be varied from 0 - +90.
The present work considers three FDM Printable materials such as PET-G, PLA and HIPS .The details about them are described below.
a) Poly Ethylene Terethalate – Glycol Modified (PET-G)
A Standard thermoplastic which has excellent properties in terms of strength and temperature resistance offering improved impact resistance, chemical resistance and heat resistant compared to ABS/PLA. PETG is an excellent water and moisture barrier material, and is widely used for soft-drink bottles.
b) Poly Lactic Acid (PLA)
PLA is a biodegradable thermoplastic which may be derived from renewable resources such as cornstarch, sugarcane, Tapioca roots or even potato starch. It finds application in food packaging, bags, disposable tableware, upholstery, disposable garments, hygiene products, diapers and surgical implants. [10]
c) High Impact Polystyrene (HIPS)
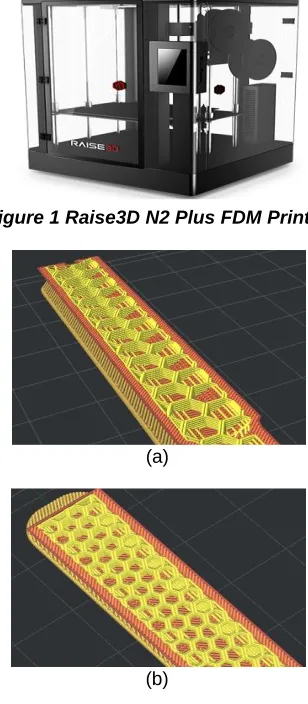
HIPS is an engineering thermoplastic with dimensional stability, good impact resistance , excellent machinability and excellent aesthetic properties. HIPS is often specified for low strength structural applications such as housings and covers. It is easy to fabricate, paint and glue. Various studies on FDM process have been conducted by authors on different end output response measurements by considering different materials and process parameter combinations to understand their effect.[15-19] The specimens for the present work has been printed by utilizing the capabilities of Raise3D N2 Plus 3D printer which has a build volume of 305*305*610 mm (W*D*H) with a heated bed which can be used based upon the material printed. It consists of dual extruder for loading the raw filament and support material to get extruded through the heated nozzle. The machine works under the principle of Fused Deposition modeling. Idea maker is the slicing software associated with this machine to slice the solid model in to thin layers. The Figure1 shows the Raise3D N2 Plus FDM printer used in the current work.
Figure 1 Raise3D N2 Plus FDM Printer
(a)
893 (c)
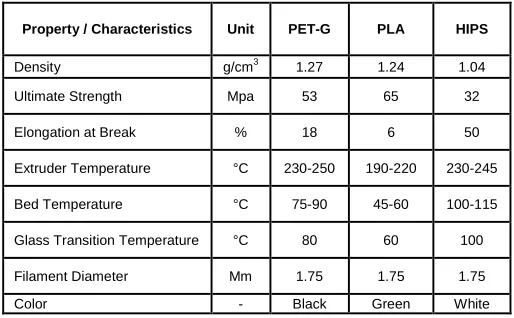
Figure 2 Sliced specimen model with Infill Densities (a) 25% (b) 50% and (c) 75%
The Figure 2 (a), (b), (c) shows the different views of the fatigue specimen filled with different infill densities. The Table 1 represents the details of various physical, mechanical, thermal properties and other material characteristics obtained from the filament manufacturer’s data sheet.
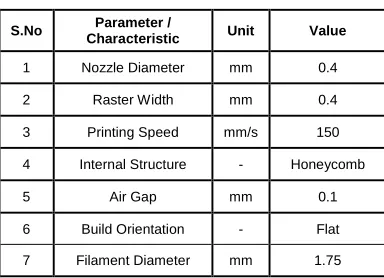
Table 1 Detail of Various Properties of FDM Materials
Property / Characteristics Unit PET-G PLA HIPS
Density g/cm3 1.27 1.24 1.04
Ultimate Strength Mpa 53 65 32
Elongation at Break % 18 6 50
Extruder Temperature °C 230-250 190-220 230-245
Bed Temperature °C 75-90 45-60 100-115
Glass Transition Temperature °C 80 60 100
Filament Diameter Mm 1.75 1.75 1.75
Color - Black Green White
3. Design of Experiments
Design of Experiments (DOE) is a systematic method to determine the influence of input parameters over a single or set of output responses. It clearly indicates the controllable and uncontrollable input process parameters over the output responses measured. Several methods such as Taguhci’s Orthogonal Array (OA), Response Surface Methodology (RSM), Definitive Screening Design (DSD) etc., have been used by many researchers to create the experimental plan. The results obtained are generally statistically analyzed to know their significance and contribution percentage of input process parameters considered for study over the output responses. Authors Pavan Kumar Gurrala and Srinivasa Prakash Regalla [11] has utilized the concept of DOE in their work by considering three different FDM parameters to study the volumetric change in FDM parts by using the Face centered central composite cubic model design which provides a total of 20 experiments to be conducted. The authors have concluded that the factors horizontal and vertical direction have effect over the dimensional accuracy and curl than model interior.Madhuri Chaudhari [12] et.al has made a study to compare the characteristics of part built using FDM process by adopting Taguchi’s L9 orthogonal array for creating the experimental
plan . Surface roughness, production time and cost are the output parameters measured by varying the input parameters such as layer thickness, infill density , orientation and post
processing technique adopted for the parts built through FDM. The results obtained are further statistically analyzed through ANOVA to determine the significant factor. The authors have concluded their work by representing the parameter combination for better results. Fahraz Ali [13] has investigated the effect of seven process parameters on build time, material consumption, and surface Roughness by creating the experimental plan using Taguchi’s L18 orthogonal array and the optimum process parameter combinations for better output characteristics are reported. Ashay Kohad,and Rajendra Dalu [14] has conducted review on the various optimization techniques followed in the optimization of FDM process parameters . Taguchi’s Orthogonal array, Response Surface methodology, Grey relational analysis, Group Method Data Handling , I-Optimal Criterion, Teaching learning based optimization algorithm and full factorial design are the various techniques used for conducting optimization of FDM process parameters as reported by the authors. Table 2 represents the different FDM parameters which are varied at 3 levels.
Table 2 Varying FDM Printing Parameters and Considered Levels
S.No FDM Printing
Parameters Symbol Unit Level
1
Level 2
Level 3
1 Slice Height A mm 0.15 0.2 0.25
2 Infill Density B % 25 50 75
3 Shell Thickness C mm 1 2 3
4 Raster Angle D Deg 0 30 60
The Table 3 shows the experimental design layout or plan consisting of 9 different experiments with varying combination of input process parameters in their coded and uncoded values. The code 1 denotes the lowest value of a factor followed by code 2 which denotes the middle value of a factor and the code 3 represents the highest level of a factor. Table 4 shows the other FDM parameters which are kept constant throughout the process of specimen printing.
Table 3 Taguchi’s Experimental Design Layout
Test Run
Coded Values Uncoded Values A B C D A B C D
R1 1 1 1 1 0.15 25 1 0
R2 1 2 2 2 0.15 50 2 30
R3 1 3 3 3 0.15 75 3 60
R4 2 1 2 3 0.2 25 2 60
R5 2 2 3 1 0.2 50 3 0
R6 2 3 1 2 0.2 75 1 30
R7 3 1 3 2 0.25 25 3 30
R8 3 2 1 3 0.25 50 1 60
894 Table 4 Constant FDM Printing Parameters
S.No Parameter /
Characteristic Unit Value
1 Nozzle Diameter mm 0.4
2 Raster Width mm 0.4
3 Printing Speed mm/s 150
4 Internal Structure - Honeycomb
5 Air Gap mm 0.1
6 Build Orientation - Flat
7 Filament Diameter mm 1.75
4. Experimental Setup
The present work utilizes the experimental setup available at the Strength of Materials laboratory to conduct a rotating bending fatigue test as shown in Figure 3. The experimental setup consists of two chucks opposite to each other to hold the specimen and the power for rotating the chuck is obtained from the D.C motor available in the setup. The setup has a facility to add weights ranging between 1 Kg to 100 Kg at the left end of the specimen to estimate its fatigue life or fatigue strength by applying different loads. The setup is equipped with a revolution counter to record the number of revolutions made by the specimen before failing or breaking into parts. The main drawback of the present setup is that the speed of rotation cannot be varied and the maximum diameter it can hold in the chuck cannot be more than 20mm and length of the workpiece than can accompanied cannot be greater than 200mm.
Figure 3 Rotating Bending Fatigue Test Experimental Setup
5. Experimental Procedure
The specimen for conducting the rotating fatigue test has an overall length of 185mm with a diameter of 12mm at the gripping section and 10mm diameter at the centre for a length of 51mm. A length of 25mm is inserted in to the chuck on both the sides to hold the specimen while rotating. The 3D model of the specimen is prepared using CATIAV5R20 as shown in Fig 5 and the 2D dimensional views are created using the drafting module as shown in Fig 4.
Figure 4 2D View of Fatigue Specimen
Figure 5 3D Model of Fatigue Specimen
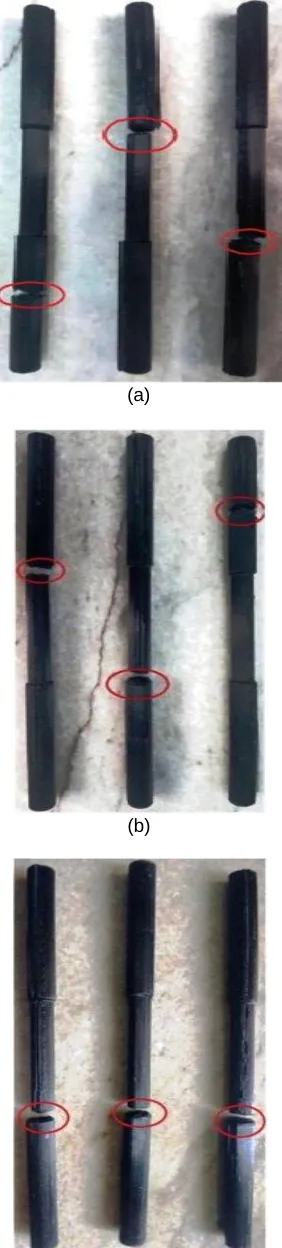
895 (a)
(b)
(c)
Figure 5 Failed PET-G Specimens ordered from 1-9
(a)
(b)
(c)
896 (a)
(b)
(c)
Figure 7 Failed HIPS Specimens ordered from 1-9
6. Results and Discussion
The experimental data obtained through the experimental work is further analyzed using MINITAB 17.0 Software and Table 5 represents the experimental values obtained towards specimen weight while printing the fatigue specimen and it’s corresponding signal to noise ratio.
6.1 Effect of Input Parameters on Specimen Weight
Table 5 Experimental Values for Specimen Weight and Corresponding S/N Ratio
Test Run
Specimen Weight
(gms) S/N Ratio PET-G PLA HIPS PET-G PLA HIPS
R1 10 8 7 -20 -18.06 -16.9
R2 14.5 13.5 6 -23.23 -22.61 -15.56
R3 20 18 15.5 -26.02 -25.11 -23.81
R4 11 11 8.5 -20.83 -20.83 -18.59
R5 15.5 15 12 -23.81 -23.52 -21.58
R6 18 18 14 -25.11 -25.11 -22.92
R7 13 12 10 -22.28 -21.58 -20
R8 14.5 13 11.5 -23.23 -22.28 -21.21
R9 19.5 18 15 -25.8 -25.11 -23.52
Figure 8 Main Effect Plot for Specimen Weight for PET-G
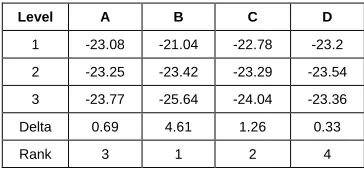
Table 6 Response Values for Specimen Weight for PET-G
Level A B C D
1 -23.08 -21.04 -22.78 -23.2
2 -23.25 -23.42 -23.29 -23.54
3 -23.77 -25.64 -24.04 -23.36
Delta 0.69 4.61 1.26 0.33
897 Figure 9 Main Effect Plot for Specimen Weight for PLA
Table 7 Response Values for Specimen Weight for PET-G
Figure 10 Main Effect Plot for Specimen Weight for HIPS
Table 8 Response Values for Specimen Weight for HIPS
Level A B C D
1 -18.76 -18.5 -20.35 -20.67
2 -21.03 -19.45 -19.22 -19.5
3 -21.58 -23.42 -21.8 -21.2
Delta 2.82 4.92 2.57 1.71
Rank 2 1 3 4
Figure 8,9,10 shows the ain effect plot for specimen weight for the materials PET-G, PLA and HIPS . Tables 6, 7, 8 represents the response values for specimen weight for the materials PET-G, PLA and HIPS and their rankings.By considering smaller the better characteristic in calculating the signal to noise ratio for generating the response graphs The optimum process parameter combination for PET-G to have less specimen weight is found to be A1B1C1D1 (0.15mm Layer
Thickness 25% Infill Density 1mm Shell Thickness 0 Degree Raster Angle). For PLA A1B1C1D1 (0.15mm Layer Thickness 25% Infill Density 1mm Shell Thickness 0 Degree Raster Angle) and for HIPS material the process parameter combination is found to be A1B1C2D2 (0.15mm Layer Thickness 25% Infill Density 2mm Shell Thickness 30 Degree Raster Angle) respectively. The response values are obtained for the experimental data by considering smaller the better characteristic and it can be understood that infill density is the most significant parameter which influences the specimen weight.
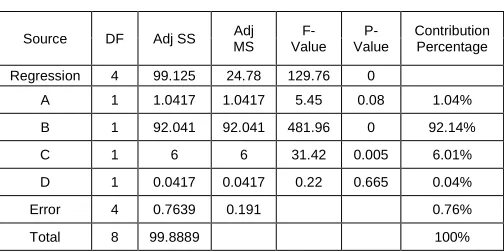
Table 9 ANOVA results for Specimen Weight – PETG
Source DF Adj SS MS Adj Value F- Value P- Contribution Percentage
Regression 4 99.125 24.78 129.76 0
A 1 1.0417 1.0417 5.45 0.08 1.04%
B 1 92.041 92.041 481.96 0 92.14%
C 1 6 6 31.42 0.005 6.01%
D 1 0.0417 0.0417 0.22 0.665 0.04%
Error 4 0.7639 0.191 0.76%
Total 8 99.8889 100%
The experimental data is further statistically analyzed through ANOVA to obtain the contribution of various input parameters over the weight of specimen for all the three materials. The input parameter which has a P-value less than 0.05 is found to be the most significant parameter which has greatest influence over the output response as per ANOVA analysis. It can be observed that Infill density has 92.14%, 88.86% and 63.52% of significant contribution over specimen weight for the materials PET-G, PLA and HIPS. Raster angle is the parameter which has very less considerable contribution towards the output response for all the three materials considered. Tables 9,10 and 11 represents the ANOVA results obtained for PET-G,PLA and HIPS.
Table 10 ANOVA results for Specimen Weight – PLA
Source DF Adj SS Adj MS F-Value
P-Value
Contribution Percentage
Regression 4 96.375 24.0937 33.85 0.002
A 1 2.0417 2.0417 2.87 0.166 2.06%
B 1 88.1667 88.1667 123.86 0 88.86%
C 1 6 6 8.43 0.044 6.05%
D 1 0.1667 0.1667 0.23 0.654 0.17%
Error 4 2.8472 0.7118 2.87%
Total 8 99.222 100%
Level A B C D
1 -21.92 -20.16 -21.82 -22.23
2 -23.15 -22.8 -22.85 -23.1
3 -22.99 -25.11 -23.4 -22.74
Delta 1.23 4.95 1.59 0.87
898 Table 11 ANOVA results for Specimen Weight – HIPS
Source DF Adj SS Adj MS F-Value
P-Value
Contribution Percentage
Regression 4 75.357 18.8437 3.9 0.108
A 1 10.6667 10.6667 2.21 0.212 11.26%
B 1 60.1667 60.1667 12.44 0.024 63.52%
C 1 4.1667 4.1667 0.86 0.406 4.40%
D 1 0.375 0.375 0.08 0.794 0.40%
Error 4 19.3472 4.8368 20.43%
Total 8 94.7222 100%
From the comparison of physical properties of all the three different materials considered in the study, PET-G is found to have more density than PLA followed by HIPS. The material with higher density is found to have more specimen weight than the material with low density.
6.2 Effect of Input Parameters on Fatigue Strength
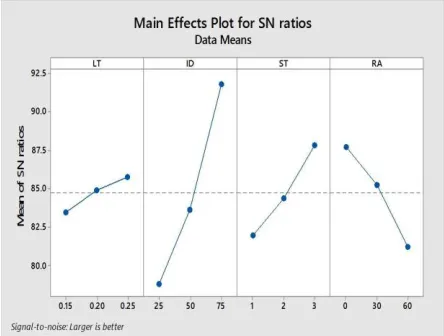
The main effect plots for the fatigue strength of the materials under study has been obtained by considering larger the better characteristic Signal to Noise ratio method. The optimum process parameter combination for PET-G to withstand high fatigue load is found to be A3B3C3D1 (0.25mm Layer Thickness 75% Infill Density 3mm Shell Thickness 0 Degree Raster Angle).For PLA A2B3C3D1 – 0.20mm Layer Thickness 75% Infill Density 3mm Shell Thickness 0 Degree Raster Angle) and for HIPS material the process parameter combination is found to be A2B3C3D3 (0.20mm Layer Thickness 75% Infill Density 3mm Shell Thickness 60 Degree Raster Angle) respectively.
Table 12 Experimental Values of Fatigue Strength and Corresponding S/N Ratio
Test Run
Fatigue Strength S/N Ratio
PETG PLA HIPS PETG PLA HIPS
R1 7756 4729 635 77.79 73.5 56.06
R2 13390 9978 160 82.54 79.98 44.08
R3 32132 39130 13324 90.14 91.85 82.49
R4 5684 9680 786 75.09 79.72 57.91
R5 31250 49290 3563 89.9 93.86 71.04
R6 30590 28217 3868 89.71 89.01 71.75
R7 14910 6538 868 83.47 76.31 58.77
R8 8330 6330 1846 78.41 76.03 65.32
R9 59268 41716 6558 95.46 92.41 76.34
Figure 11 Main Effects Plot for Fatigue Strength – PET-G
Figure 12 Main Effects Plot for Fatigue Strength – PLA
899 Table 13 Response Values for Fatigue Strength – PET-G
Level A B C D
1 83.5 78.79 81.97 87.72
2 84.9 83.62 84.36 85.24
3 85.8 91.77 87.84 81.21
Delta 2.29 12.98 5.86 6.5
Rank 4 1 3 2
Table 14 Response Values for Fatigue Strength – PLA
Level A B C D
1 81.78 76.51 79.51 86.59
2 87.53 83.29 84.03 81.77
3 81.58 91.09 87.34 82.53
Delta 5.95 14.58 7.83 4.82
Rank 3 1 2 4
Table 15 Response Values for Fatigue Strength – HIPS
Level A B C D
1 60.88 57.58 64.38 67.81
2 66.9 60.15 59.44 58.2
3 66.81 76.86 70.77 68.58
Delta 6.02 19.28 11.32 10.37
Rank 4 1 2 3
The Figures 11, 12 and 13 shows the main effect plots for fatigue strength for the materials PET-G, PLA and HIPS by considering larger the better characteristic Tables 13, 14 and 15 show their response values and their rankings. The response values are obtained for the experimental data by considering larger the better characteristic and it can be understood that infill density is the most significant parameter which influences the fatigue strength of the material. The experimental data is further statistically analyzed through ANOVA to obtain the contribution of various input parameters over the output response for all the three materials. It can be observed that Infill density has 60.18%, 50.86% and 53.90% of significant contribution over the fatigue strength of the materials PET-G, PLA and HIPS comparing to other input parameters. Raster angle is the parameter which has very less considerable contribution towards the output response for PLA and for the other two materials PET-G and HIPS layer thickness is found to be less significant.
Table 16 ANOVA results for Fatigue Strength – PETG
Source D
F Adj SS Adj MS F-Valu e P-Valu e Contributi on Percentag e Regressio
n 4
222329039
0 555822597 10.85 0.02
A 1 142398817 142398817 2.78 0.171 5.86%
B 1 146140826
7
146140826
7 28.53 0.006 60.18%
C 1 166595243 166595243 3.25 0.146 6.86%
D 1 452888064 452888064 8.84 0.041 18.65
Error 4 204861050 51215263 8.40%
Total 8 242815144
0 100%
Table 17 ANOVA results for Fatigue Strength – PLA
Source D
F Adj SS Adj MS F-Valu e P-Valu e Contributio n Percentage Regressio
n 4
208557110
2 521392776 4.55 0.086
A 1 93002 93002 0 0.979 0.03%
B 1 129407157
6
129407157
6 11.29 0.028 50.86%
C 1 516747521 516747521 4.51 0.101 20.30%
D 1 274659004 274659004 2.4 0.197 10.79%
Error 4 458566571 114641643 18.02%
Total 8 254413767
4
Table 18 ANOVA results for Fatigue Strength – HIPS
Source DF Adj SS Adj MS F-Value
P-Value
Contribution Percentage
Regression 4 106867461 26716865 3.01 0.156
A 1 3915568 3915568 0.44 0.543 2.75%
B 1 76762420 76762420 8.64 0.042 53.90%
C 1 21682806 21682806 2.44 0.193 15.22%
D 1 4506667 4506667 0.51 0.516 3.16%
Error 4 35525737 8881434 24.95%
Total 8 142393198
6.3 Range Analysis
The range analysis of orthogonal experiments are conducted to identify the optimum combination of parameters and the order of priority of the input factors for both the output responses have been done for all the materials considered and the results obtained can be compared with the optimum parameter combination and ranking of input factors achieved through Taguchi’s S/N ratio method.. The procedure of range analysis is summarized below in a simplified manner for better understanding.
Table 19 Range Analysis of Fatigue Strength – PET-G
Levels A B C D
1 53278 28350 46676 98274
2 67524 52970 78342 58890
3 82508 121990 78292 40462
Mean A B C D
1 17759.3 9450 15558.67 32758
2 22508 17656.67 26114 19630
900
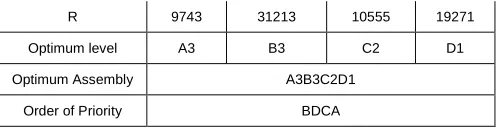
R 9743 31213 10555 19271
Optimum level A3 B3 C2 D1
Optimum Assembly A3B3C2D1
Order of Priority BDCA
The mean values of factor levels for all the four different factors are calculated and to find the optimum level in a particular factor the lowest mean value is considered for the output response Specimen weight as it has to be low or minimum and for Fatigue strength the factor level with highest mean value is considered to be optimum as the fatigue strength of the materials should be higher in general. The range values in descending order are considered to be the order of maximum significance or priority of the input parameters over the output responses.
Table 20 Range Analysis of Fatigue Strength – PLA
Levels A B C D
1 53837 20947 39276 95735
2 87187 65598 61374 44733
3 54584 109063 94958 55140
Mean A B C D
1 17945.7 6982.333 13092 31911.7
2 29062.3 21866 20458 14911
3 18194.7 36354.33 31652.67 18380
R 11116.7 29372 18560.67 17000.7
Optimum level A2 B3 C3 D1
Optimum Assembly A2B3C3D1
Order of Priority BCDA
Irrespective of the material considered for study, Infill density is found to be the most significant factor which affects the fatigue strength of the material and Layer thickness have shown very less significance over the output response. For both PLA and HIPS, Next to Infill Density Shell thickness have shown more significant effect over fatigue strength of the material and in case of PET-G raster angle ranks second position to infill density as significant parameter. The table 19,20 and 21 shows the range analysis values of Fatigue strength for PET-G , PLA and HIPS respectively.
Table 21 Range Analysis of Fatigue Strength – HIPS
Levels A B C D
1 14119 2289 6349 10756
2 8217 5569 7504 4896
3 9272 23750 17755 15956
Mean A B C D
1 4706 763 2116 3585
2 2739 1856 2501 1632
3 3091 7917 5918 5319
R 1967 7154 3802 3687
Optimum level A1 B3 C3 D3
Optimum Assembly A1B3C3D3
Order of Priority BCDA
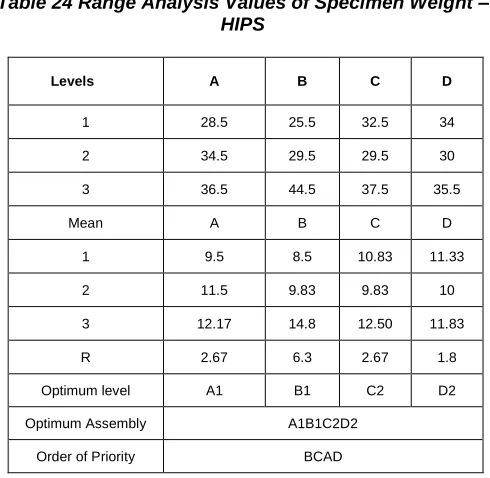
The optimum combination of parameters for both PET-G and PLA to have low specimen weight is found to be A1B1C1D1 which is corresponding to 0.1mm Layer Thickness , 25% Infill Density , 1mm Shell Thickness with 0° Raster Angle as per range analysis. But in case of HIPS material the optimum parameter combination is found to be A1B1C2D2 which is corresponding to 0.1mm Layer Thickness , 25% Infill Density , 2mm Shell Thickness with 30° Raster Angle. The optimum parameter combination obtained from both Taguchi’s Signal to Noise Ratio method and Range Analysis are in good agreement. Irrespective of the materials considered the order of priority remains the same as per Range Analysis. The sequence of influencing parameter for all the three materials considered in the present work is found to be BCAD which corresponds to Infill Density, Shell Thickness, Layer Thickness and Raster Angle. Table 22, 23, 24 shows the results of range analysis of materials PET-G, PLA and HIPS towards specimen weight.
Table 22 Range Analysis of Specimen Weight – PET-G
Levels A B C D
1 44.5 34 42.5 45
2 44.5 44.5 45 45.5
3 47 57.5 48.5 45.5
Mean A B C D
1 14.83 11.33 14.17 15.00
2 14.83 14.83 15.00 15.17
3 15.67 19.17 16.17 15.17
R 0.83 7.83 2.00 0.17
Optimum level A1 B1 C1 D1
Optimum Assembly A1B1C1D1
Order of Priority BCAD
Table 23 Range Analysis of Specimen Weight – PLA
Levels A B C D
1 39.5 31 32 41
2 44 41.5 42.5 43.5
3 43 54 45 42
Mean A B C D
1 13.17 10.33 10.67 13.67
2 14.67 13.83 14.17 14.50
3 14.33 18.00 15.00 14.00
R 1.50 7.67 4.33 0.83
Optimum level A1 B1 C1 D1
Optimum Assembly A1B1C1D1
901 Table 24 Range Analysis Values of Specimen Weight –
HIPS
Levels A B C D
1 28.5 25.5 32.5 34
2 34.5 29.5 29.5 30
3 36.5 44.5 37.5 35.5
Mean A B C D
1 9.5 8.5 10.83 11.33
2 11.5 9.83 9.83 10
3 12.17 14.8 12.50 11.83
R 2.67 6.3 2.67 1.8
Optimum level A1 B1 C2 D2
Optimum Assembly A1B1C2D2
Order of Priority BCAD
7. Confirmation Experiment
The confirmation experiment conducted for both the output responses specimen weight and fatigue strength for all the three materials under study has good agreement with the optimum combination obtained form taguchi’s signal to noise ratio method and range analysis.
8. Conclusion
The conclusion for the above work may be drawn further and it can be divided in to two sections. The first section explains the concluding remarks obtained for the output response Specimen weight and the second section describes about the research findings on Fatigue strength of the materials through taguchi’s signal to noise ratio method and range analysis.
(a) Specimen Weight
Specimen weight with smaller the better characteristic has been considered for the calculation of S/N ratio method.
The Response table values and ANOVA analysis have shown that the input factor Infill Density is the most significant parameter which contributes more towards the output response specimen weight than the other variable taken for study for all the three materials and Raster Angle is found to have very less contribution towards specimen weight. The increase in infill density adds more material to the specimen and thereby increases the specimen weight.
Infill density has 92.14%, 88.86% and 63.52% of significant contribution over Specimen Weight for the materials PET-G, PLA and HIPS respectively.
HIPS is found to have very less specimen weight compared to other materials and PET-G is found to have high specimen weight for the printing conditions as the density of HIPS is lesser than PLA and PET-G.
The optimum parameter combination obtained from both taguchi’s signal to noise ratio method and range analysis are in good agreement for all the three materials.
The order of priority for all the three materials as per range analysis is found to be Infill Density, Shell Thickness, Layer Thickness and Raster Angle.
To evaluate the effect of FDM parameters over specimen weight other input factors may be considered for expanding the experimental plan and techniques such as TOPSIS, Grey relational analysis may be considered.
(b) Fatigue Strength
Experimental values of Fatigue strength under rotating bending fatigue test with larger the better characteristic are considered for Signal to Noise ratio calculation.
Infill density has 60.18%, 50.86% and 53.90% of significant contribution over Fatigue Strength of the materials PET-G, PLA and HIPS respectively.
PET-G is found to have more fatigue strength than PLA and HIPS. HIPS has the poor fatigue strength for the experimental conditions considered.
Similar to specimen weight from both ANOVA and range analysis infill density is the most significant factor than other parameters considered and layer thickness has the least contribution towards fatigue strength of all the three materials.
The order of priority for the three materials PLA and HIPS as per range analysis is found to be Infill Density, Shell Thickness , Raster Angle and Layer Thickness and for PET-G the order of priority varies and is given by Infill Density, Raster Angle ,Shell Thickness and Layer Thickness .
The fatigue strength of the materials considered may be further studied by varying the speed of rotation , other input FDM parameters and optimization techniques for better understanding of the material properties.
References
[1]. Samir kumar panda, Saumyakant padhee, Anoop kumar sood, S. S. Mahapatra , ―Optimization of Fused Deposition Modelling (FDM) Process Parameters Using Bacterial Foraging Technique‖, Intelligent Information Management, 2009, Vol- 1, pp 89-97 [2]. Vishwas M , Basavaraj C K, Vinyas M , ― Experimental
Investigation using Taguchi Method to Optimize Process Parameters of Fused Deposition Modeling for ABS and Nylon Materials‖, International Conference on Emerging Trends in Materials and Manufacturing Engineering (IMME17), 2018, Vol 5 , pp 7106-7114. [3]. John Ryan C. Dizon, Alejandro H. Espera Jr. c, Qiyi
Chen, Rigoberto C. Advincula , ―Mechanical characterization of 3D-printed polymers‖, Additive Manufacturing, 2018, Vol 20 , pp 44–67.
[4]. Anoop Kumar Sood, R.K. Ohdar , S.S. Mahapatra, ―Improving dimensional accuracy of Fused Deposition Modelling processed part using grey Taguchi method‖, Materials and Design , 2009, Vol 30, pp 4243–4252. [5]. J. Santhakumar
*
902 [6]. Imtiyaz Khan, Dr. A. A. Shaikh , ― A Review of FDM
Based Parts to Act as Rapid Tooling‖ , International Journal of Modern Engineering Research, 2014, Vol 14.
[7]. Wenzheng Wu 1, Peng Geng 1, Guiwei Li 1, Di Zhao 1, Haibo Zhang 2 and Ji Zhao 1,‖ Influence of Layer Thickness and Raster Angle on the Mechanical Properties of 3D-Printed PEEK and a Comparative Mechanical Study between PEEK and ABS‖ , Materials 2015, Vol 8, pp 5834-5846.
[8]. Ksawery Szykiedans*, Wojciech Credo, Dymitr Osiński, ―Selected mechanical properties of PETG 3-D prints‖ Procedia Engineering, 2017,pp 455 – 461. [9]. Mahdi Kaveh Ardeshir Hemasian Etefagh Mohsen
Badrossamay, ―Optimization of the Printing Parameters Affecting Dimensional Accuracy and Internal Cavity for HIPS Material Used in Fused Deposition Modeling Processes‖, Journal of Materials Processing Technology, 2015.
[10]. Paras Vatsh Krishna Sahu , ― Comparison of Most Suitable 3D Printing Materials, Failure Testing of PLA and ABS and Experimental Testing of PLA by Instron Machine‖ , International Journal for Scientific Research & Development, 2017, Vol 5 , pp 760-765. [11]. Pavan Kumar Gurrala*, Srinivasa Prakash Regalla,
―DOE Based Parametric Study of Volumetric Change of FDM Parts‖, Procedia Materials Science, 2014, Vol 6 , pp 354 – 360.
[12]. Madhuri Chaudhari , Bhagwan F.Yogi, R.S Pawade, ―Comparative study of part characteristics built using additive manufacturing (FDM)‖, Procedia Manufacturing , 2018, Vol 20, pp 73-78.
[13]. Fahraz Ali, Boppana V. Chowdary, Justin Maharaj, ―Influence of Some Process Parameters on Build Time, Material Consumption, and Surface Roughness of FDM Processed Parts: Inferences Based on the Taguchi Design of Experiments‖, Proceedings of The 2014 IAJC/ISAM Joint International Conference. [14]. Ashay Kohad, Rajendra Dalu, ―Optimization of
Process Parameters in Fused Deposition Modeling: A Review‖, International Journal of Innovative Research in Science, Engineering and Technology, 2017, Vol 6, 505-511.
[15]. Gonzalo M. Domínguez Almaraz1, Erasmo Correa Gomez1, Faisal M. Zeidan A., Euro R. Mena Mena, ―Ultrasonic Fatigue Testing on Polymeric material ABS, (Acrylonitrile Butadiene Styrene)‖, International Journal of Emerging Technology and Advanced Engineering, 2013,Vol 3 ,pp 404-409.
[16]. R.Jerez –Mesa , J.A.Travieso –Rodriguez , J Lluma – Fuentes, G.Gomez – Gras, ― Fatigue lifespan study of PLA parts obtained by additive manufacturing‖, Procedia Manufacturing , 2017, Vol 13, pp 872-879. [17]. N.Mohammed Raffic, Dr.K.Ganesh Babu , Arjun
Kumaran, Kiran G.R ,‖ Parametric Optimization Study of ABS Material Using FDM Technique for Fatigue Life Prediction‖ , International Journal of Research in Advent Technology, 2018, Vol 6, pp 2923-2930. [18]. Cany Mendonsa, KV Naveen, Prathik Upadhyaya,
Vyas Darshan Shenoy, ―Influence of FDM Process Parameters on Build Time Using Taguchi and ANOVA Approach‖, 2015, Vol 4, pp 330 -333.
[19]. Samruddhi Rao, Pragati Samant, Athira Kadampatta, Reshma Shenoy , ― An Overview of Taguchi Method :
Evolution, Concept and Interdisciplinary Applications’, International Journal of Scientific & Engineering Research, 2013, Vol 4, pp 621-626.