www.ocean-sci.net/11/83/2015/ doi:10.5194/os-11-83-2015
© Author(s) 2015. CC Attribution 3.0 License.
An alternative method for correcting fluorescence quenching
L. Biermann1, C. Guinet2, M. Bester3, A. Brierley4, and L. Boehme1 1Sea Mammal Research Unit, Scottish Oceans Institute, St. Andrews, UK
2Centre National de la Recherche Scientifique, Centre d’Etudes Biologiques de Chizé, Villiers en Bois, France 3Mammal Research Institute, Department of Zoology and Entomology, University of Pretoria, Pretoria, South Africa 4Pelagic Ecology Research Group, Scottish Oceans Institute, St. Andrews, UK
Correspondence to: L. Biermann ([email protected])
Received: 8 April 2014 – Published in Ocean Sci. Discuss.: 9 May 2014
Revised: 8 December 2014 – Accepted: 11 December 2014 – Published: 13 January 2015
Abstract. Under high light intensity, phytoplankton pro-tect their photosystems from bleaching through non-photochemical quenching processes. The consequence of this is suppression of fluorescence emission, which must be corrected when measuring in situ yield with fluorome-ters. We present data from the Southern Ocean, collected over five austral summers by 19 southern elephant seals tagged with fluorometers. Conventionally, fluorescence data collected during the day (quenched) were corrected using the limit of the mixed layer, assuming that phytoplankton are uniformly mixed from the surface to this depth. However, distinct deep fluorescence maxima were measured in approx-imately 30 % of the night (unquenched) data. To account for the evidence that chlorophyll is not uniformly mixed in the upper layer, we propose correcting from the limit of the eu-photic zone, defined as the depth at which photosynthetically available radiation is ∼1 % of the surface value. Mixed layer depth exceeded euphotic depth over 80 % of the time. Under these conditions, quenching was corrected from the depth of the remotely derived euphotic zoneZeu, and compared with fluorescence corrected from the depth of the density-derived mixed layer. Deep fluorescence maxima were evident in only 10 % of the day data when correcting from mixed layer depth. This was doubled to 21 % when correcting from Zeu, more closely matching the unquenched (night) data. Furthermore, correcting fromZeuserved to conserve non-uniform chloro-phyll features found between the 1 % light level and mixed layer depth.
1 Introduction
Monitoring distribution and abundance of primary produc-ers in the marine environment is useful for undproduc-erstanding larger biological and physical processes. Phytoplankton are predominantly single-celled, green microscopic organisms, present at variable concentrations in every ocean (Falkowski and Kolber, 1995; Behrenfeld et al., 2009). They are the first stepping stone in transferring energy into the marine ecosys-tem. When conditions allow for growth, their collective im-pact is such that they are able to change the spectral prop-erties of the water (McClain, 2009). This can be exploited to measure abundance and distribution using their photosyn-thetic pigment, chlorophyll a (Chl a) as a marker (Morel and Prieur, 1977; Gordon and Morel, 1983; Falkowski et al., 1998; Henson et al., 2010).
Satellite-derived ocean colour is the most comprehensive data set available for monitoring surface Chl a concentra-tion. However, the limitations of remote sensing are signif-icant (Dierssen and Smith, 2000; McClain, 2009). Perhaps most significantly, satellite sensors can only see ocean colour from the surface to one optical depth, providing little infor-mation on the vertical structure of the water column (Morel and Berthon, 1989). Despite innovative algorithms to im-prove data collected by satellites, limitations are not likely to be resolved with the next generation of ocean colour sen-sors. Continued collection of in situ data on phytoplankton distribution and abundance is thus essential (Johnson et al., 2009).
and Eppley, 1981; Falkowski and Kolber, 1995; Xing et al., 2011; Lavigne et al., 2012). Chlorophyll pigments packaged inside phytoplankton cells re-radiate∼2 % of light energy as fluorescence. Active fluorescence can thus be measured by a fluorometer delivering voltage output equivalent to 460 nm (excitation in the blue) and measuring resultant fluorescence in the 620–715 nm range (detection in the red). Assuming that the measured yield is proportional to the abundance of photosynthesising phytoplankton, relative values of fluores-cence can be used to quantify primary biomass. However, yield (and thus proportionality) is affected by several fac-tors, including the intensity of sunlight each cell is exposed to (Behrenfeld and Boss, 2006).
To regulate high sunlight intensity, phytoplankton employ the mechanism of non-photochemical quenching. This pro-cess helps cells protect themselves in environments where light energy absorption exceeds the capacity for light util-isation (Müller et al., 2001; Behrenfeld et al., 2009). Dur-ing periods of high light stress, shallow-mixed phytoplank-ton in the upper euphotic zone protect their photosystems from bleaching by emitting excess energy as heat (Milligan et al., 2012). In this state of photo-protection, photosynthe-sis is inhibited and fluorescence yield drops (Müller et al., 2001). However, deep-mixed phytoplankton are shaded by surface biomass and protected by light-attenuating proper-ties of the water itself. Thus, during high sunlight intensity, deeply mixed phytoplankton will fluoresce while shallow-mixed biomass will be invisible to a fluorometer. If uncor-rected, quenched fluorescence yields will generate values under-representative of phytoplankton abundance at the sur-face. Avoiding such under-representation is particularly im-portant for studies comparing satellite-derived surface Chla with in situ fluorescence-derived Chla.
On the vertical scale, quenched fluorescence profiles are also problematic in that they mimic the shape of true deep flu-orescence maxima (DFM) (Mignot et al., 2011). Sub-surface fluorescence maxima can be indicative of deep chlorophyll maxima (DCM). These features either form due to differ-ences in Chla packaging, or when the bulk of phytoplank-ton biomass settles to depths where both nutrients and light are sufficient (Cullen and Eppley, 1981; Holm-Hansen and Hewes, 2004; Mellard et al., 2011). Because DCM are found below one optical depth, abundance and distribution of such features cannot be measured by satellite (McClain, 2009; Charrassin et al., 2010). However, vertical distributions of phytoplankton play important roles in the organisation of pelagic trophic food webs (Mellard et al., 2011). DCM in particular play potentially under-reported roles in net pri-mary production and carbon fixation (Fairbanks et al., 1982; Estrada et al., 1993; Claustre et al., 2008). It is therefore use-ful to try to accurately identify and map these features.
In previous work on glider data, correcting for quenching involved using backscatter (Sackmann et al., 2008) or surface light intensity (Todd et al., 2009), each measured simultane-ously to fluorescence. For autonomous platforms collecting
only fluorescence, salinity and temperature data in remote locations, this is not possible. Using the depth of the density-derived mixed layer, Xing et al. (2011) corrected quenched fluorescence data collected by Argo floats in Pacific, At-lantic and Mediterranean offshore zones. This mixed layer depth (MLD) method was then extended to fluorescence data collected by tagged southern elephant seals (Mirounga leon-ina) off Kerguelen Island in the Southern Ocean (Xing et al., 2012; Guinet et al., 2013). Following the method of Xing et al. (2012), the maximum fluorescence yield within the density-derived mixed layer would be representative of the whole, assuming homogeneity. How robust is this assump-tion for the waters of the Southern Ocean?
The upper layer of the Southern Ocean tends to be deeply mixed, even over austral summers, and DCM are thought to be rare (discussed in Holm-Hansen and Hewes, 2004). How-ever, ship-based studies undertaken in different regions of the Southern Ocean have shown that mixing and settling patterns within and between functional types are dynamic (Holm-Hansen and Hewes, 2004; Mengesha et al., 1998; Quéguiner, 2013; Sangrà et al., 2014). This is especially true for motile (flagellated) and seasonally successive (heavily silicified) species (Mengesha et al., 1998; Quéguiner, 2013). Further-more, even within homogenously mixed layers of biomass, Chlapackaging has been shown to vary with depth, gener-ating DCM (and DFM) independent of biomass (Behrenfeld and Boss, 2006). Reliance on the assumption of homogeneity is, therefore, possibly problematic.
In this paper, we present an alternative method to account for quenching without relying on homogeneity in the density-derived upper layer. Non-photochemical quenching is cor-rected using the limit of the euphotic zone (Zeu), defined as the depth at which downward photosynthetic available radi-ation (PAR) is at∼1 % of the surface value (Shang et al., 2011; Soppa et al., 2013). At this level, light should be suf-ficient for photosynthesis (Ryther and Menzel, 1959; Morel and Berthon, 1989; Saulquin et al., 2013; Palmer et al., 2013) but too weak to cause quenching (Alderkamp et al., 2011; Ross et al., 2011). This method is applied to fluorescence data collected by 19 animal-borne fluorometer, conductivity, temperature and depth satellite-relayed data loggers (FCTD-SRDLs) deployed in the Southern Ocean over several austral summers.
2 Methods 2.1 In situ data
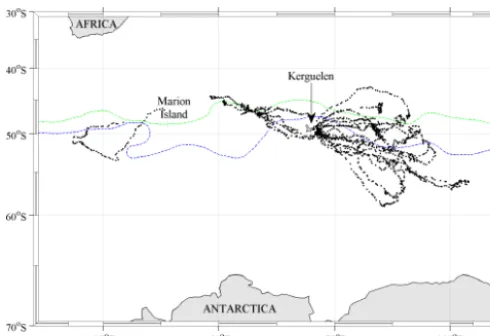
Figure 1. Tracks of 19 southern elephant seals tagged with
FCTD-SRDLs over austral summers from 2009 to 2013 in black. The gen-eral positions of the subantarctic front and the polar front are shown in green and blue, respectively (Orsi and Harris, 2014). The incom-plete track seen off Marion Island is due to the FCTD-SRDL battery failing after 55 days.
(Bester, 1988; McIntyre et al., 2010), the seal on Marion Is-land was immobilised with ketamine using a remote injection method and the tag was glued to the fur on the head with quick-setting epoxy resin. Seals on Kerguelen were anes-thetised with an intravenous injection of tiletamine and zo-lazepam 1:1 and tags were glued to the fur on the head using a two component industrial epoxy (Jaud et al., 2012).
The FCTD-SRDL instrument records behavioural data as well as in situ pressure, temperature, salinity and fluores-cence (Charrassin et al., 2010; Xing et al., 2012). At-sea data were relayed via the Argos satellite system (http://www. argos-system.org). Locations were provided by Service Ar-gos based on Doppler shift measurements and data were downloaded from the Sea Mammal Research Unit Instru-mentation Group’s website (http://www.smru.st-andrews.ac. uk/). Detailed information on the hardware and software of the CTD-SRDL is described by Boehme et al. (2009), and on-board data processing is described comprehensively by Fedak et al. (2002).
Fluorescence is recorded by a Cyclops 7 fluorometer (Turner Designs, CA, USA), which delivers a voltage out-put proportional to the fluorescence detected in a wavelength between 620 and 715 nm. The Cyclops instrument is pro-grammed to measure fluorescence every 2 s during the ascent (upcast), from 180 m to the surface. Due to the tight limits on data transfer through the Argos satellite system, data have to be compressed (Boehme et al., 2009). Fluorescence yields were therefore binned into 10 m vertical intervals. The read-ing for 175 m is thus a weighted mean of all fluorescence readings taken between 180 and 170 m. This is the deepest bin available – deep and dark enough to anticipate an ab-sence of live, photosynthesising phytoplankton (Guinet et al.,
2013). However, instruments do not return readings of zero at these depths. This dark count is an offset value added by the manufacturers, and is useful because at very low signal, readings are indistinguishable from noise. The offset value increases the signal to noise ratio, which must be removed during data processing (Lavigne et al., 2012). We therefore calculated the median of readings at 175 m and subtracted this from all measurements collected by the same tag (Xing et al., 2011). This is not only useful for making the fluorescence values more representative, it also serves to reduce variabil-ity between tags (Xing et al., 2012). The resulting values are considered proportional to fluorescence, and are termed rel-ative fluorescence units (RFU).
2.2 Satellite data
The depth of Zeu reflects the limit where PAR is 1 % of its surface value. In this study, we use an estimate of the euphotic zone Zeu based on an algorithm by Lee et al. (2007). These estimates are derived from measurements of the water-leaving radiance by the Moderate Imaging Spec-trometer (MODIS) as 4 km×4 km monthly composites (http: //oceancolor.gsfc.nasa.gov).
To optimise temporal and spatial coverage in a region as cloudy as the Southern Ocean, values of L3 8 dayZeuwere used whenever available, and values from monthly compos-ites were then added to fill in the blanks. However, despite the broad coverage in time, gaps were still present in space. For each fluorometer profile the closestZeuvalue in space was extracted from the gridded data set. If no value was available, Zeuwas interpolated linearly from the nearest seal position with an associatedZeuvalue.
2.3 Correcting for quenching
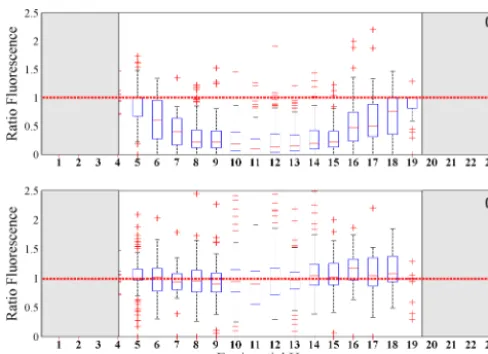
Quenching occurs in surface waters during periods of high light stress. Despite daily variability attributed to cloud (changing light intensity), and differences in phytoplankton concentrations between years and regions, suppression of flu-orescence is a ubiquitous feature. Fitting a non-linear model (sin function) to surface fluorescence as a function of time of day showed that quenching around midday was significant (n=1267, R2=0.26, P <0.001) (Supplement Fig. S1). Data were thus categorised as day: possibly quenched (from sunrise to sunset, with the sun 8 degrees above the horizon) or night: unquenched. To illustrate the quenching effect without interannual and regional variability, day yields were divided by the preceding night yields to generate ratios. Data were then binned by hour and plotted using box plots (Fig. 2).
Figure 2. Ratio of day to night surface fluorescence yield (first
15 m) per local hour from data collected by 19 animal-borne fluo-rometers over five austral summers. Box plots show the distribution of day to night ratios in (a), representing quenched to unquenched yield, respectively. The horizontal red line at 1 indicates the 1:1 ratio. Ratios of fluorescence yield decrease from around 06:00 until around 18:00 LT, then recover to the 1:1 ratio line. Corrected ra-tios of fluorescence in (b) do not follow the same trend of deviation from the 1:1 ratio line at 1. Flanking grey sections represent times of the day where the sun is less than 6 degrees below the horizon.
The night: unquenched data were then normalised and each profile was interrogated for maximum values below the near-surface yield. To ensure a deep maximum value is not within the measurement error for each tag, a 95 % confidence interval for the error was calculated for each instrument us-ing bootstrappus-ing (1000 bootstrap samples). The upper con-fidence limit was set as a threshold value, subtracted from the deep maximum and added to the near-surface value. Only differences outside of this threshold were flagged as potential DFM, and these profiles were then visually inspected. Ver-tical profiles conforming to the shape of DFM in this data set were considered true DFM, independent of quenching (Fig. S2).
For the day: quenched data, we compare the results of flu-orescence quenching correction from two depths. The first is a density-derived MLD calculated from the concurrent CTD measurements of the FCTD-SRDL. Here, MLD is defined as the depth where the vertical density gradient equals or ex-ceeds a threshold value of1ρ=0.03 kg m−3; as employed by Xing et al. (2011, 2012) (de Boyer Montégut et al., 2004; Kara et al., 2000). The MLD in the region of interest tends to remain deeper than 50 m, even over the austral summer (Dong et al., 2008; Fig. 3). The second depth is the remotely derivedZeuusing Lee’s algorithm (2007). Separately, max-imum fluorescence yield between MLD and the surface, or Zeuand the surface, were then extended to fill in suppressed yield (Fig. 3).
For over 80 % of the day data set, mixed layer depth was deeper thanZeu. However, the small proportion (∼20 %) of waters with MLD shallower than Zeu proved problematic for correcting quenching. In these instances, correcting from MLD generates still-quenched values. Conversely, correcting fromZeuwould mask shallow but potentially true subsurface features. Where MLD shoaled aboveZeu, fluorescence data were thus flagged and removed from the data set.
3 Results
The at-sea phases of the 19 tagged southern elephant seals (Fig. 1) tended to start in November and end in late January of the following year, meaning data were collected over the height of the austral summer. In the top 10–15 m of the up-per mixed layer across all years of sampling, suppression of daytime fluorescence yield was significant (Fig. 2a).
To correct for quenching in deeply mixed waters, surface values collected between dawn and dusk were filled in with maximum values from the depth of the mixed layer, or the depth of Zeu. The difference between these methods is il-lustrated in Fig. 3, where individual normalised fluorescence profiles are treated with the two correction schemes. Cor-rected surface fluorescence yields are overestimated using the depth of the mixed layer, but perhaps more importantly, vertical complexity is lost. Correcting from Zeu serves to conserve unusual (not homogenous) dynamics on the verti-cal sverti-cale. This is illustrated in Fig. 3b, where phyotoplankton may either be settling into different layers (floristic shifts) or where Chla packaging has become measurably different between deep-mixed and shallow-mixed layers (photoaccli-mation).
The difference between the two methods is also evident looking at fluorescence sections in Fig. 4. Uncorrected ver-tical profiles in the top row (Fig. 4a, d and g) illustrate how evident suppression of daytime fluorescence yield is in the surface layers (greyscale bar with daylight hours in white and black for night). Quenching is corrected using MLD in the second row (Fig. 4b, e and h) andZeuin the third (Fig. 4c, f and i). The distinct subsurface fluorescence feature in (a) is within the mixed layer, and is thus masked when corrected from this depth (b). However, correcting fromZeuconserves vertical complexity while still correcting quenching at the surface (c). The deep fluorescence feature in Fig. 4d also has a maximal yield below euphotic depth but within the mixed layer. This deep signal is masked when correcting from MLD (e) but remains distinct when usingZeu(f). Finally, the dy-namics in Fig. 4g are lost when correcting from the depth of the mixed layer (h) but conserved when correcting fromZeu (i). The night data from this example in particular corrobo-rates complex Chladynamics with depth.
Figure 3. Normalised vertical profiles of fluorescence (solid black
line) corrected using either the depth of the mixed layer (dashed red line) or the 1 % light level,Zeu(dashed blue line). The fluores-cence in profile (c) was measured at night and is unquenched (mixed layer is shown by the dashed red line butZeu is absent at night). Profiles (a), (b) and (d) were collected at varying times during the day. For each profile, quenched fluorescence is corrected using ei-therZeu(depth and corresponding fluorescence yield shown with dashed blue line) or MLD (depth and corresponding fluorescence yield shown with dashed red line).
between 2009 and 2013, 18 instruments measured DFM in the night (unquenched) data. For the combined night data set, approximately 30 % of the 797 profiles showed DFM (mean=13; standard deviation=9) (Fig. S3). Correcting withZeudoubled the number of DFM conserved in the day data (21 %) compared with MLD (10 %), but was still unable to fully match the percentage found in the night data.
4 Discussion
The phenomenon of non-photochemical quenching is well described and appears to be ubiquitous across oceans and seasons (Sackmann et al., 2008; Milligan et al., 2012). The depth where light levels are sufficient for photosynthesis but too weak to generate quenching is key for correcting in situ fluorescence data; ensuring fluorescence yield is representa-tive of vertical Chl a concentrations. However, when fluo-rescence data are collected autonomously, this depth cannot always be measured in space and time.
For this study, removing quenched fluorescence would mean discarding 1352 of the 2149 profiles collected by 19 animal-borne tags over several austral summers in the South-ern Ocean. Losing over 60 % of the data collected from such an undersampled region is simply not viable. Thus, two proxy depths are compared for quenching correction. The first is a density-derived MLD, calculated from CTD data measured concurrently by the tag (Xing et al., 2012; Guinet et al., 2013). The second is the depth of the remotely derived euphotic zone,Zeu(Lee et al., 2007).
During daylight hours, a proportion of the euphotic zone (defined as the surface to the 1 % light level) will be light-saturated relative to photosynthetic efficiency (Behrenfeld and Falkowski, 1997). Shallow-mixed phytoplankton are ex-posed to a range of super-saturating light intensities, while deep-mixed phytoplankton will be exposed to low-levels of light intensity that are suboptimal for photosynthesis in the absence of photoadaptation.
Cells throughout any given euphotic zone adapt to varia-tions in the light field through a range of physiological strate-gies (Arrigo et al., 2010; Kropuenske et al., 2009, 2010). These include non-photochemical quenching for high light stress, and a range of dark adaptation strategies below a saturating light threshold. Photosynthesis typically saturates at light intensities of∼200 mmol photons m−2s−1(van der Poll et al., 2009) and below ∼100 mmol photons m−2s−1 cells must initiate dark adaptation strategies (Garcia and Pur-die, 1992). By definition, such dark-adapted phytoplankton at the base of the euphotic zone are not experiencing high light stress. However, light is still sufficient for photosynthe-sis. Indeed, Hameedi (1978), Platt et al. (1982) and Lee et al. (2010) have shown that shade-acclimated phytoplankton from the 1 % light level are more productive than phytoplank-ton from the 50 % light level (Alderkamp et al., 2011; Palmer et al., 2013).
At noon on a cloudless summer’s day, the South-ern Ocean can receive surface irradiance of up to 2000 mmol photons m−2s−1(Ross et al., 2008). Light satu-ration would be expected at 10 % surface light levels, while dark-adapted phytoplankton would be found at∼5 % of the maximal expected surface irradiance. Therefore, at the 1 % light level, phytoplankton are likely dark adapted (i.e. not exhibiting non-photochemical quenching) and actively pho-tosynthesizing.
Composites of MODIS Zeu are provided as evaluative products and these were used to determine euphotic depth, where light intensity would be too low to cause light stress and suppression of fluorescence yield. Lee’s algorithm for Zeuprovided accurate and reliable estimates ofZeuin open waters of the China Sea (Morel, 1988; Morel et al., 2007; Lee et al., 2007; Shang et al., 2011). We assume that this method can also reliably estimate the limit of the euphotic zone in the open waters of the Southern Ocean. However, validation with in situ light data at the high latitudes would be beneficial for measuring the accuracy of this product.
compro-Figure 4. Sections of fluorescence corrected using either the depth of the mixed layer (dashed red line) or the depth of the 1 % light level,
Zeu(dashed blue line). The greyscale bar attached to the top of each plot illustrates when fluorescence data were collected relative to the time of day, with black for night and white for day. The top row of vertical profiles (a), (d) and (g) show sections of uncorrected fluorescence data collected by different instrumented seals over austral summers. The fluorescence data in the second row (b), (e) and (h) have been corrected using mixed layer depth. The last row of fluorescence data (c), (f) and (i) have been corrected using euphotic depth. Conditions where MLD shoals aboveZeucannot be corrected and have been filtered from the day data set, but not from the night (unquenched).
mise, generating 16-day composites using SeaDAS 7.0 (Fu et al., 1998) would address the temporal compromise as well as fill in some of the gaps. However, this step requires cus-tom processing, rather than the use of freely available and pre-existing products. This may limit wider application of the method. Our aim is to create a method that is easily applied and universally useful for autonomously collected fluores-cence data in regions where waters tend to be deeply mixed. Surface waters of the Antarctic are deeply mixed and deep chlorophyll maxima were previously thought to be rare (Holm-Hansen and Hewes, 2004). However, while the verti-cal distribution of phytoplankton is controlled by turbulence and density, it is also driven by nutrient and light gradients (Navarro et al., 2006). Cell motility has been shown to prevail over dispersion by turbulence (Durham et al., 2013). When ideal levels of light and nutrients change with depth over time, so too will the vertical distribution of biomass in the water column (evolutionary stable strategy depth) (Mellard et al., 2011). Indeed, 19 of the 19 seals tagged with FCTD-SRDLs between 2009 and 2013 returned DFM in the night data. These in situ fluorescence data sets add to growing evi-dence that DCM may be regionally and seasonally persistent in the Southern Ocean (Holm-Hansen et al., 2005; Charrassin et al., 2010; Quéguiner, 2013).
Distinct DCM are only a part of the story, however. Het-erogeneous phytoplankton patterns within layers of homoge-nous density are a common feature of the North Atlantic, resulting from slow mixing rates (relative to growth rates) during periods without deep convective mixing (Taylor and Ferrari, 2011). Although we have no information on mixing or turbulence, finding deep maxima in 30 % of the night data points to moderate or even weak turbulence in the upper layer (Ross et al., 2011; Franks, 2014). Correcting fromZeuserves to conserve unusual (not homogenous) dynamics between the 1 % light level and MLD. From a biological perspec-tive, this vertical information may provide useful insights into mixing and settling patterns of different phytoplankton species (floristic shifts), or differences in chlorophyll pack-aging in the same species (photoacclimation). However, the fact that DCM and non-uniform phytoplankton patterns per-sist over the five summers recorded may also be interesting from a purely physical perspective.
outside of the high latitudes, we are only able to suggest that usingZeuimproves the current method in the deeply mixed waters of the Southern Ocean.
The Supplement related to this article is available online at doi:10.5194/os-12-83-2015-supplement.
Acknowledgements. This work received funding from the MASTS pooling initiative (The Marine Alliance for Science and Technol-ogy for Scotland) and their support is gratefully acknowledged. MASTS is funded by the Scottish Funding Council (grant refer-ence HR09011) and contributing institutions. A number of field assistants were involved in the deployment of tags on Marion and we are particularly grateful to Mia Wege. FCTD-SRDL tags and fluorescence data were generously provided by CEBC-CNRS as part of the research program supported by CNES-TOSCA, ANR-VMC, Total Foundation and IPEV. The Mammal Research Institute, University of Pretoria, covered Marion Island Argos transmission costs and we thank Trevor McIntyre for facilitating this. We are grateful to Sandy Thomalla and other reviewers for significantly improving this manuscript. Special thanks to Drew Lucas, Mick Wu and Hayley Evers-King for their assistance with the editing, statistics and bio-optics, respectively.
Edited by: M. Hoppema
References
Alderkamp, A. C., Garcon, V., de Baar, H. J., and Arrigo, K. R.: Short-term photoacclimation effects on photoinhibition of phyto-plankton in the Drake Passage (Southern Ocean), Deep Sea Res. Pt. I, 58, 943–955, doi:10.1016/j.dsr.2011.07.001, 2011. Arrigo, K. R., Mills, M. M., Kropuenske, L. R., van Dijken, G. L.,
Alderkamp, A. C., and Robinson, D. H.: Photophysiology in two major Southern Ocean phytoplankton taxa: photosynthesis and growth of Phaeocystis antarctica and Fragilariopsis cylindrus un-der different irradiance levels, Integr. Comp. Biol., 50, 950–966, doi:10.1093/icb/icq021, 2010.
Behrenfeld, M. J. and Boss, E.: Beam attenuation and chlorophyll concentration as alternative optical indices of phytoplankton biomass, J. Mar. Res., 64, 431–451, doi:10.1357/002224006778189563, 2006.
Behrenfeld, M. J. and Falkowski, P. G.: Photosynthetic rates de-rived from satellite-based chlorophyll concentration, Limnol. Oceanogr., 42, 1–20, doi:10.4319/lo.1997.42.1.0001, 1997. Behrenfeld, M. J., Westberry, T. K., Boss, E. S., O’Malley, R. T.,
Siegel, D. A., Wiggert, J. D., Franz, B. A., McClain, C. R., Feld-man, G. C., Doney, S. C., Moore, J. K., Dall’Olmo, G., Milli-gan, A. J., Lima, I., and Mahowald, N.: Satellite-detected fluo-rescence reveals global physiology of ocean phytoplankton, Bio-geosciences, 6, 779–794, doi:10.5194/bg-6-779-2009, 2009. Bester, M. N.: Chemical restraint of Antarctic fur seals and southern
elephant seals, South Afr. J. Wildl. Res., 18, 57–60, 1988.
Boehme, L., Lovell, P., Biuw, M., Roquet, F., Nicholson, J., Thorpe, S. E., Meredith, M. P., and Fedak, M.: Technical Note: Animal-borne CTD-Satellite Relay Data Loggers for real-time oceano-graphic data collection, Ocean Sci., 5, 685–695, doi:10.5194/os-5-685-2009, 2009.
Charrassin, J. B., Roquet, F., Park, Y. H., Bailleul, F., Guinet, C., Meredith, M., , Nicholls, K., Thorpe, S., Tremblay, Y., Costa, D., Göbel, M., Muelbert, M., Bester, M. N., Plötz, J., Bornemann, H., Timmermann, R., Hindell, M., Meijers, A., Coleman, R. C., Field, I. C., McMahon, C., Rintoul, S., Sokolov, S., Fedak, M., Lovell, P., Biuw, M., Kovacs, K., and Lydersen, C.: New insights into Southern Ocean physical and biological processes revealed by instrumented elephant seals, Proceedings of OceanObs 09: Sustained Ocean Observations and Information for Society (Vol. 2), edited by: Hall, J., Harrison, D. E., and Stammer, D., Venice, Italy, 21–25 September 2009, doi:10.5270/OceanObs09.cwp.15, ESA Publication WPP-306, 2010.
Claustre, H., Sciandra, A., and Vaulot, D.: Introduction to the spe-cial section bio-optical and biogeochemical conditions in the South East Pacific in late 2004: the BIOSOPE program, Biogeo-sciences, 5, 679–691, doi:10.5194/bg-5-679-2008, 2008. Cullen, J. J. and Eppley, R. W.: Chlorophyll maximum layers of
the Southern-California Bight and possible mechanisms of their formation and maintenance, Oceanologica Acta, 4, 23–32, 1981. de Boyer Montégut, C., Madec, G., Fischer, A. S., Lazar, A., and Iudicone, D.: Mixed layer depth over the global ocean: An examination of profile data and a profile-based clima-tology, J. Geophys. Res.-Ocean., (1978–2012), 109, C12003, doi:10.1029/2004JC002378, 2004.
Dierssen, H. M. and Smith, R. C.: Bio-optical properties and re-mote sensing ocean color algorithms for Antarctic Peninsula wa-ters, J. Geophys. Res.-Ocean., (1978–2012), 105, 26301–26312, doi:10.1029/1999JC000296, 2000.
Dong, S., Sprintall, J., Gille, S. T., and Talley, L.: Southern Ocean mixed?layer depth from Argo float profiles, J. Geophys. Res.-Oceans, 113, C06013, doi:10.1029/2006JC004051, 2008. Durham, W. M., Climent, E., Barry, M., De Lillo, F., Boffetta,
G., Cencini, M., and Stocker, R.: Turbulence drives microscale patches of motile phytoplankton, Nature communications, 4, 2148, doi:10.1038/ncomms3148, 2013.
Estrada, M., Marrase, C., Latasa, M., Berdalet, E., Delgado, M., and Riera, T.: Variability of deep chlorophyll maximum characteris-tics in the Northwestern Mediterranean, Marine Ecol. Progr. Ser., 92, 289–289, 1993.
Fairbanks, R. G., Sverdlove, M., Free, R., Wiebe, P. H., and Bé, A. W.: Vertical distribution and isotopic fractionation of living planktonic foraminifera from the Panama Basin, Nature, 298, 841–844, 1982.
Falkowski, P. G. and Kolber, Z.: Variations in Chlorophyll Fluo-rescence Yields in Phytoplankton in the World Oceans, Austr. J. Plant Physiol., 22, 341–355, 1995.
Falkowski, P. G., Barber, R. T., and Smetack, V.: Biogeochemical controls and feedbacks on ocean primary productivity, Science, 281, 200–206, 1998.
Franks, P. J.: Has Sverdrup’s critical depth hypothesis been tested? Mixed layers vs. turbulent layers, ICES J. Mar. Sci., doi:10.1093/icesjms/fsu175, online firstm, 2014.
Fu, G., Baith, K. S., and McClain, C. R.: SeaDAS: The SeaWiFS Data Analysis System, Proceedings of The 4th Pacific Ocean Re-mote Sensing Conference, Qingdao, China, 28–31 July, 73–79, 1998.
Garcia, V. M. T. and Purdie, D. A.: The influence of irradiance on growth, photosynthesis and respiration of Gyrodinium cf. aure-olum, J. Plankton Res., 14, 1251–1265, 1992.
Gordon, H. R. and Morel, A.: Remote Sensing of Ocean Color for Interpretation of Satellite Visible Imagery: A Review, (Springer-Verlag, New York), 1983.
Guinet, C., Xing, X., Walker, E., Monestiez, P., Marchand, S., Pi-card, B., Jaud, T., Authier, M., Cotté, C., Dragon, A. C., Dia-mond, E., Antoine, D., Lovell, P., Blain, S., D’Ortenzio, F., and Claustre, H.: Calibration procedures and first dataset of Southern Ocean chlorophyll a profiles collected by elephant seals equipped with a newly developed CTD-fluorescence tags, Earth Syst. Sci. Data, 5, 15–29, doi:10.5194/essd-5-15-2013, 2013.
Hameedi, M. J.: Aspects of water column primary productivity in the Chukchi Sea during summer, Marine Biol., 48, 37–46, 1978. Henson, S. A., Sarmiento, J. L., Dunne, J. P., Bopp, L., Lima, I., Doney, S. C., John, J., and Beaulieu, C.: Detection of anthro-pogenic climate change in satellite records of ocean chlorophyll and productivity, Biogeosciences, 7, 621–640, doi:10.5194/bg-7-621-2010, 2010.
Holm-Hansen, O. and Hewes, C. D.: Deep chlorophyll a max-ima (DCMs) in Antarctic waters, Polar Biol., 27, 699–710, doi:10.1007/s00300-004-0641-1, 2004.
Holm-Hansen, O., Kahru, M., and Hewes, C. D.: Deep chlorophyll a maxima (DCMs) in pelagic Antarctic waters. II. Relation to bathymetric features and dissolved iron concentrations, Marine Ecol. Progr. Ser., 297, 71–81, doi:10.3354/meps297071, 2005. Jaud, T., Dragon, A. C., Garcia, J. V., and Guinet, C.: Relationship
between Chlorophyll a Concentration, Light Attenuation and Diving Depth of the Southern Elephant Seal Mirounga leonina, PLoS one, 7, e47444, doi:10.1371/journal.pone.0047444, 2012. Johnson, K. S., Berelson, W. M., Boss, E. S., Chase, Z., Claustre,
H., Emerson, S. R., Gruber, N., Kortzinger, A., Perry, M. J., and Riser, S. C.: Observing Biogeochemical Cycles at Global Scales with Profiling Floats and Gliders: Prospects for a Global Ar-ray, Oceanography, 22, 216–225, doi:10.5670/oceanog.2009.81, 2009.
Kropuenske, L. R., Mills, M. M., van Dijken, G. L., Bailey, S., Robinson, D. H., Welschmeyer, N. A., and Arrigo, K. R.: Photophysiology in two major Southern Ocean phytoplankton taxa: photoprotection in Phaeocystis antarctica and Fragilariop-sis cylindrus, Limnol. Oceanogr., 54, 1176, doi:10.1111/j.1529-8817.2010.00922.x, 2009.
Kropuenske, L. R., Mills, M. M., Van Dijken, G. L., Alderkamp, A. C., Mine Berg, G., Robinson, D. H., Welschmeyer, N. A., and Arrigo, K. R.: Strategies And Rates Of Photoacclimation In Two Major Southern Ocean Phytoplankton Taxa: Phaeocystis Antarctica (Haptophyta) And Fragilariopsis Cylindrus (Bacillar-iophyceae) 1, J. Phycol., 46, 1138–1151, 2010.
Lavigne, H., D’Ortenzio, F., Claustre, H., and Poteau, A.: Towards a merged satellite and in situ fluorescence ocean chlorophyll
product, Biogeosciences, 9, 2111–2125, doi:10.5194/bg-9-2111-2012, 2012.
Lee, S. H., Stockwell, D., and Whitledge, T. E.: Uptake rates of dis-solved inorganic carbon and nitrogen by under-ice phytoplankton in the Canada Basin in summer 2005, Polar Biol., 33, 1027–1036, 2010.
Lee, Z., Weidemann, A., Kindle, J., Arnone, R., Carder, K. L., and Davis, C.: Euphotic zone depth: Its derivation and implication to ocean-color remote sensing, J. Geophys. Res.-Oceans (1978– 2012), 112, 223–227, doi:10.1016/0011-7471(66)91102-8, 2007. Lorenzen, C. J.: A method for the continuous measurement of in vivo chlorophyll concentration, Deep Sea Res. Oceanogr. Abstr., 13, 223–227, 1966.
Lorenzen, C. J. and Jeffrey, S. W.: Determination of chlorophyll in seawater, Unesco tech. pap. Mar. Sci., 35, 1–21, 1980.
McClain, C. R.: A Decade of Satellite Ocean Colour Observations, Ann. Rev. Marine Sci., 1, 19–22, 2009.
McIntyre, T., de Bruyn, P. J. N., Ansorge, I. J., Bester, M. N., Borne-mann, H., Plötz, J., and Tosh, C. A.: A lifetime at depth: vertical distribution of southern elephant seals in the water column, Polar Biol., 33, 1037–1048, 2010.
Mellard, J. P., Yoshiyama, K., Litchman, E., and Klaus-meier, C. A.: The vertical distribution of phytoplankton in stratified water columns, J. Theor. Biol., 269, 16–30, doi:10.1016/j.jtbi.2010.09.041, 2011.
Mengesha, S., Dehairs, F., Fiala, M., Elskens, M., and Goeyens, L.: Seasonal variation of phytoplankton community structure and ni-trogen uptake regime in the Indian Sector of the Southern Ocean, Polar Biol., 20, 259–272, 1998.
Mignot, A., Claustre, H., D’Ortenzio, F., Xing, X., Poteau, A., and Ras, J.: From the shape of the vertical profile of in vivo fluores-cence to Chlorophyll-a concentration, Biogeosciences, 8, 2391– 2406, doi:10.5194/bg-8-2391-2011, 2011.
Milligan, A. J., Aparicio, U. A., and Behrenfeld, M. J.: Fluorescence and nonphotochemical quenching responses to simulated vertical mixing in the marine diatom Thalassiosira weissflogii, Mar. Ecol. Progr. Ser., 448, 67–78, doi:10.3354/meps09544, 2012. Morel, A.: Optical modeling of the upper ocean in relation to
its biogenous matter content (case I waters), J. Geophys. Res.-Ocean., 93, 10749–10768, 1988.
Morel, A. and Berthon, J. F.: Surface pigments, algal biomass pro-files, and potential production of the euphotic layer: Relation-ships reinvestigated in view of remote-sensing applications, Lim-nol. Oceanogr., 34, 1545–1562, 1989.
Morel, A. and Prieur, L.: Analysis of variations in ocean color, Lim-nol. Oceanogr., 22, 709–722, 1977.
Morel, A., Huot, Y., Gentili, B., Werdell, P. J., Hooker, S. B., and Franz, B. A.: Examining the consistency of products derived from various ocean color sensors in open ocean (Case 1) wa-ters in the perspective of a multi-sensor approach, Remote Sens. Environ., 111, 69–88, doi:10.1016/j.rse.2007.03.012, 2007. Müller, P., Li, X. P., and Niyogi, K. K.: Non-photochemical
quench-ing. A response to excess light energy, Plant Physiol., 125, 1558– 1566, 2001.
Orsi, A. H. and Harris, U.: Locations of the various fronts in the Southern Ocean Australian Antarctic Data Centre-CAASM Metadata, 2001, available at: https://data.aad.gov.au/aadc/metadata/metadata_redirect.cfm? md=/AMD/AU/southern_ocean_fronts, 15, 1835–1852, updated 2014.
Palmer, M. A., van Dijken, G. L., Mitchell, B. G., Seegers, B. J., Lowry, K. E., Mills, M. M., and Arrigo, K. R.: Light and nu-trient control of photosynthesis in natural phytoplankton popula-tions from the Chukchi and Beaufort seas, Arctic Ocean, Limnol. Oceanogr., 58, 2185–2205, 2013.
Platt, T., Harrison, W. G., Irwin, B., Horne, E. P., and Gallegos, C. L.: Photosynthesis and photoadaptation of marine phytoplankton in the Arctic, Deep Sea Res. Pt A, 29, 1159–1170, 1982. Quéguiner, B.: Iron fertilization and the structure of planktonic
communities in high nutrient regions of the Southern Ocean. Deep Sea Res. Pt II, 90, 43–54, doi:10.1016/j.dsr2.2012.07.024, 2013.
Ross, O. N., Moore, C. M., Suggett, D. J., MacIntyre, H. L., and Geider, R. J.: A model of photosynthesis and photo-protection based on reaction center damage and repair, Limnol. Oceanogr., 53, 1835, doi:10.1029/2008JC005086, 2008.
Ross, O. N., Geider, R. J., Berdalet, E., Artigas, M. L., and Piera, J.: Modelling the effect of vertical mixing on bottle incubations for determining in situ phytoplankton dynamics. I. Growth rates, Marine Ecol. Progr. Ser., 435, 33–45, 2011.
Ryther, J. H. and Menzel, D. W.: Light adaptation by marine phyto-plankton, Limnol. Oceanogr., 4, 492–497, 1959.
Sackmann, B. S., Perry, M. J., and Eriksen, C. C.: Seaglider ob-servations of variability in daytime fluorescence quenching of chlorophyll-a in Northeastern Pacific coastal waters, Biogeo-sciences Discuss., 5, 2839–2865, doi:10.5194/bgd-5-2839-2008, 2008.
Sangrà, P., García-Muñoz, C., García, C. M., Marrero-Díaz, A., Sobrino, C., Mouriño-Carballido, B., Aguiar-González, B., Henríquez-Pastene, C., Rodríguez, S. A., Lubian, L., Hernán-dez, M., Hernández-León, S., Vázquez, E., and Estrada-Allis, S. N.: Coupling between upper ocean layer variability and size-fractionated phytoplankton in a non-nutrient-limited environ-ment, Marine Ecol. Progr. Ser., 499, 35–46, 2014.
Saulquin, B., Hamdi, A., Gohin, F., Populus, J., Mangin, A., and d’Andon, O. F.: Estimation of the diffuse attenuation coefficient K(dPAR) using MERIS and application to seabed habitat map-ping, Remote Sens. Environ., 128, 224–233, 2013.
Shang, S., Lee, Z., and Wei, G.: Characterization of MODIS-derived euphotic zone depth: Results for the China Sea, Remote Sens. Environ., 115, 180–186, 2011.
Soppa, M. A., Dinter, T., Taylor, B. B., and Bracher, A.: Satellite de-rived euphotic depth in the Southern Ocean: Implications for pri-mary production modelling, Remote Sens. Environ., 137, 198– 211, doi:10.1016/j.rse.2013.06.017, 2013.
Taylor, J. R. and Ferrari, R.: Shutdown of turbulent convection as a new criterion for the onset of spring phytoplankton blooms, Lim-nol. Oceanogr., 56, 2293–2307, doi:10.4319/lo.2011.56.6.2293, 2011.
Todd, R. E., Rudnick, D. L., and Davis, R. E.: Monitoring the greater San Pedro Bay region using autonomous underwater glid-ers during fall of 2006, J. Geophys. Res.-Ocean., 114, 483–495, doi:10.1029/2008JC005086, 2009. 2009.
van de Poll, W. H. and Buma, A. G. J.: Does ultraviolet radiation af-fect the xanthophyll cycle in marine phytoplankton?, Photochem. Photobiol. Sci., 8, 1295–1301, doi:10.1039/b904501e, 2009. Xing, X., Morel, A., Claustre, H., Antoine, D., D’Ortenzio, F.,
Poteau, A., and Mignot, A.: Combined processing and mutual in-terpretation of radiometry and fluorimetry from autonomous pro-filing Bio-Argo floats: Chlorophyll a retrieval, J. Geophys. Res.-Oceans, (1978–2012), 116, doi:10.1029/2010JC006899, 2011. Xing, X., Claustre, H., Blain, S., D’Ortenzio, F., Antoine, D., Ras,