Original Article
Correlations between apparent diffusion coefficient
values and histopathology classification of
breast invasive ductal carcinoma
Wei Zhang1*, Guanqiao Jin1*, Junjie Liu2*, Xiangyang Huang1, Wei Kang1, Dong Xie1, Ningbin Luo1, Danke Su1 Departments of 1Radiology, 2Ultrasound Diagnosis, Affiliated Tumor Hospital of Guangxi Medical University,
Nanning 530021, P. R. China. *Equal contributors.
Received September 26, 2015; Accepted January 9, 2016; Epub February 15, 2016; Published February 29, 2016
Abstract: Objective: The purpose of this study was to evaluate the correlation between apparent diffusion coefficient (ADC) values and histopathologic classification of breast cancer. Methods: Sixty-six cases of breast cancer con-formed by histopathology with histopathologic classification were recruited in this retrospective study. ADC values of lesions were measured; the mean (ADCmean) and minimum (ADCmin) were extracted from regions of interest (ROIs). The cases were divided into two groups, histopathologic classification and prognostic recurrence, according to the treatment and prognosis (histopathologic classification, lymph node status). Results: According to the analysis, ADCmean had no correlation with either histopathologic classification group or prognostic recurrence group. There was negative correlation between ADCmin and histopathologic classification group (r=-0.615, P=0.000) as well as prognostic recurrence group (r=-0.754, P=0.000). Conclusion: The ADCmin can be considered as an optimal DWI single parameter of medical plan before breast cancer surgery and the preliminary assessment of prognostic recur-rence.
Keywords: Breast cancer, histopathologic classification, apparent diffusion coefficient
Introduction
Breast MR has been improving rapidly since it was coming into existence. As the technology that has been widely used for diagnosis of breast cancer, diffusion-weighted imaging (DWI), which has been integrated into standard breast cancer for discrimination of breast lesions, possesses high sensitivity and speci-ficity for cancer detection. DWI is currently the only technique used for detecting Brownian motion of bulk water molecules in vivo, and it values the limitation of Brownian motion on these molecules through ADC values [1]. Breast cancer is a highly heterogeneous malignancy. The density, atypia of tumor cells and extracel-lular volume in different histopathologic grades will affect the Brownian motion of water mole-cules [2-5]. Currently, the correlation between the different histopathologic grades and ADC values has been discussed in literatures at home and abroad. Yet, since the regions of interest (ROIs) vary and method of
measure-ment differs, there are distinct differences between the conclusions. This study aimed to figure out the ADC value, which was a more reflection of histopathologic classification in breast cancer, by discussing whether different classification of breast cancer was correlated to either average or minimum ADC value. Materials and methods
Patients
before the MR imaging scan; (b) The breast lesions were confirmed by histopathological examination of specimens obtained by excision biopsy, core biopsy, or fine-needle aspiration.
MRI imaging protocol
MR imaging was performed with a 1.5 Tesla (T) clinical MR imaging system (MagnetomAvanto, Siemens Healthcare, Erlangen, Germany) equipped with a dedicated eight-channel phased array breast coil in the prone position. A transverse T2-weighted TIRM pulse sequence was performed with 5600/59/180 (repetition time/echo time/inversion time) ms, a 4 mm section thickness, a 0.8 mm intersection gap, a
field of view of 34×34 cm, a matrix of 314× 320. A transverse T1-weighted FLASH pulse sequence was performed with 8.6/4.7 (repeti-tion time/echo time [TR/TE]), a 1 mm sec(repeti-tion thickness, a 0.2 mm intersection gap, a field of view of 32×32 cm, a matrix of 323×448. DWI MR images were acquired in the axial planes by using an echo-planar imaging sequence, paral-lel imaging with sensitivity encoding (accelera-tion factor of two), fat suppression (in a spec-tral selective attenuated inversion-recovery sequence), volume shimming, b values of 0 and 800 s/mm2, TR/TE/TI=5800/86/180 ms, a 6 mm section thickness, a 0.2 mm intersection gap, a field of view of 32×32 cm, and a matrix of 323×448. The ADC maps were created
auto-Figure 1. A: ADCmean=1.368×10⁻³ mm2/s, ADC
min=1.062×10⁻³ mm2/s; B: Photomicrograph (hematoxylin-eosin
[image:2.612.89.526.72.256.2]stain-ing, original magnification 100×) showing pathological of grade I invasive ductal carcinoma in the right breast.
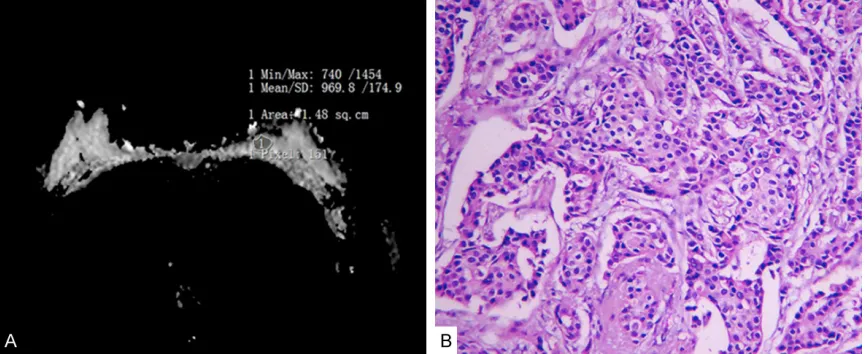
Figure 2. A: ADCmean=0.97×10⁻³ mm2/s, ADC
min=0.74×10⁻³ mm2/s; B: Photomicrograph (hematoxylin-eosin staining,
[image:2.612.91.524.308.485.2]matically by the system from the trace-weight-ed images with b values of 0 and 800. ADC val-ues were calculated according to the following formula: ADC=-(1/b) ln (S2/S1), where the S2 and S1 are the signal intensities at b value of 800 and 0, respectively.
MR imaging analysis
ROIs were freehanded along the border of tumor on ADC figures in order to cover the entire lesion areas, while the obviously necrotic, liquescent, hemorrhagic, cystic, or calcified areas were excluded (based on T1WI, T2WI, and dynamic contrast-enhanced MRI figures). Mean ADC (ADCmean) and minimum ADC (ADCmin) values of ROIs were figured out (Figures 1-3).
Histopathological assessment and analysis of MR imaging
The Bloom-Richardson semiquantitative clas-sification method improved by Elston and Ellis was used for the assessment of histological classification using a numerical scoring system according to tubule formation, nuclear pleo-morphism and mitotic count: (1) Tubule forma-tion: Scored 1 point when it was of >75%, scored 2 when its range is 10%~75% and scored 3 when its range below 10%. (2) Nuclear pleomorohism: Scored 1 point when its shape was of normal pancreatic ductal epithelial, reg-ular and fairly uniform; scored 3 when it was obviously pleomorphic and 2.5 times of the nor-mal ductal epithelial; scored 2 if the size and
pleomorohism was moderate. (3) Mitotic count: In the area where cells grew briskly (diameter 0.44 mm, area 0.152 mm2), mitotic count (/10 HPF) ranged between 0 and 5 scored 1 point, 6 to 10 scored 2 and scored 3 when it exceeded 11. All the scores were added up and the total score could range from 3 to 9, with a total score of 3~5 representative of grade I, a total score of 6-7 representative of grade II and a total score of 7-9 representative of grade III, which indicated well-differentiated, moderately differ-entiated and poorly differdiffer-entiated respectively. Firstly, the ADC values corresponded to grade I, II, and III in the classification above were divid-ed into group I, II and III. Secondly, according to the assessment of prognosis and recurrence, the grade I patients without lymph node metas-tasis into were assigned into group A and those grade II patients without lymph node metasta-sis in were assigned into group B. Patients with lymph node metastasis in any histopathologic grade were assigned into group C [5-8].
Statistical analysis
[image:3.612.92.523.71.250.2]Results were expressed as mean ± standard deviation (_x ± SD) and A p-value of less than 0.05 was judged as statistically significant. All the data were analyzed by One-way analysis of variance (One-way ANOVA), LSD test and Spearman’ rank correlation coefficients were used to evaluate the correlation between the ADC values and histopathologic classification and prognostic recurrence with SPSS 19.0 software.
Figure 3. A: ADCmean=0.896×10⁻³ mm2/s, ADC
min=0.444×10⁻³ mm2/s; B: Photomicrograph (hematoxylin-eosin
Results
All the cases underwent HE stain and histo-pathologic classification by pathologists who had been working in hospital for ten to fifteen years. Meanwhile, all the ADC values were mea-sured by radiologists with working experience of ten to fifteen years. One-way ANOVA was used in group I, group II and group III. There was no statistical difference within the groups of ADCmean values (F=0.963, P=0.387). On the contrary, the differences between the ADCmin values (F=23.793, P=0.000) were noticeable. The ADCmin values were compared using LSD test (Detail in Table 1). In the groups of prog-nostic recurrence (group A, B, C), One-way ANOVA was used again. The differences of ADCmean values (F=3.465, P=0.037) and ADCmin values (F=56.726, P=0.000) within the groups were statistically significant. LSD test again used to make a series of pair wise comparisons between ADCs. While only group B and group C had distinct difference in ADCmean value, all the groups differed from each other in minimum ADCs (P<0.05) (Detail in Table 2). The ADCmin values were evaluated using Spearman’ rank correlation coefficient method. The correlation coefficient r of ADCmin values in group I to III and group A~C were -0.615 (P=0.000<0.01) and -0.754 (P=0.000<0.01) respectively.
when degree of differentiation becomes lower. Accordingly, the arrangement becomes closer and its volume decreases. Nucleus of tumor cells becomes bigger, meanwhile, the amount of organelle increases. This will lead to a loss of cytoplasm and slow-down movement of water molecules. As a result, ADC values become lower.
[image:4.612.87.387.112.181.2]This study showed that the differences of ADCmean neither had statistical significance in histopathologic grades, nor in the prognostic recurrence groups. Above all, ADCs had no cor-relation with traditional prognostic factors such as tumor size, lymph node metastasis status and histopathologic classification, which was consistent with the conclusion of literatures [5, 6, 11]. Yet, the literatures had pointed out that the higher histopathologic grade is the more glandular tubes will be within per unit of area. In addition, the density of tumor cells increases and its atypia becomes more obvious. The high-er grade also results in a highhigh-er nucleus cyto-plasm ratio and smaller extracellular volume, and controlled diffusion of water molecules becomes more significant. The ADCs decreas-es accordingly. Therefore, there exists correla-tion between ADCs and histopathologic classifi-cation, and ADCs of breast cancer can help to Table 1. Results of ADC values in different histopathologic grades of
breast cancer and the results of pairwise comparions within groups examined by LSD test
Histological
grade Cases (n) ADCmean (
_ x ± SD, ×10-3 mm2/s) ADCmin (
_ x ± SD, ×10-3 mm2/s)
p value ADCmean ADCmin I 10 0.993±0.108 0.849±0.165 I:II 0.678 0.000 II 22 0.969±0.184 0.660±0.146 II:III 0.316 0.001 III 34 0.926±0.143 0.535±0.106 I:III 0.231 0.000
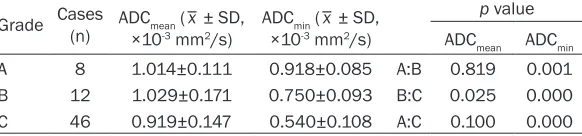
Table 2. Results of ADC values in different prognostic groups of breast cancer and the results of pairwise comparions within groups examined by LSD test
Grade Cases (n) ADCmean ( _ x ± SD,
×10-3 mm2/s) ADCmin ( _ x ± SD, ×10-3 mm2/s)
p value ADCmean ADCmin
A 8 1.014±0.111 0.918±0.085 A:B 0.819 0.001 B 12 1.029±0.171 0.750±0.093 B:C 0.025 0.000 C 46 0.919±0.147 0.540±0.108 A:C 0.100 0.000 Note: A is histological grade I without lymph node metastasis into, B is histological grade II without lymph node metastasis in, C is any histopathologic grade with lymph node metastasis.
Discussion
[image:4.612.94.385.243.311.2]forecast the degree of differentiation. This is certainly consistent with the conclusion of this study that ADCmin values had correlation in both histopathologic grades and prognostic recur-rence groups. The reports Diffusion-weighted imaging in breast cancer: relationship between apparent diffusion coefficient and tumour aggressiveness Costantini et al. [4] and Invasive ductal carcinoma: correlation of appar-ent diffusion coefficiappar-ent value with pathological prognostic factors Razek, et al. [12] took ADCmean as the reference value. However, in this study, the value was ADCmin. In terms of refer-ence value, the two methods lead to inconsis-tent results. In addition, the grade I (1.25×10⁻³ mm2/s), grade II (1.02×10⁻³ mm2/s) and grade III (0.92×10⁻³ mm2/s) in the report of Costantini et al. [4] also have differences with that of our study. The reasons can be summarize into fol-lowing aspects.
Due to the multiple factors such as microvascu-lar vessel density (MVD) and vascumicrovascu-lar endothe-lial growth factor (VEGF), the tumor cells of breast grow at different speed. Furthermore, differences are also generated in the amount of glandular ducts, nuclear pleomorohism and mitotic count, and the controlled diffusion of water molecules inside tumor shows in differ-ent degree. Hirano [13] had pointed out the maximum ADC value inside lesion reflects the highest cellular zone, and the minimum ADC value reflects the lowest cellular zone. Hence, the ADCs partially measured and ADCmean of the whole lesion in some degree deviated from the extent of expression of cell density and extra-cellular volume in different zones. Besides, fac-tors such as tumorous fibrosis inside lesion and tiny necrosis also affect ADCs, especially ADCmax, which results in the difference of patho-logical features reflected by ADCmean. ADCmin, as shown in the study, has correlation with histo-pathologica classification, and it can accurately reflect the degree of internal pathological grad-ing and the difference of tumor differentiation in different grades.
Both vascular endothelial growth factor (VEGF) and epidermal growth factor receptor (EGFR) increase when axillary lymph node metastasis takes place [14, 15]. Masses of new capillaries show up in tumor and internal MVD increases. This is consistent with the conclusion suggest-ed by literatures that MVD has positive correla-tion with axillary lymph node metastasis [16,
17]. The MVD increases and tumor cells grow at a higher speed, accordingly, extracellular vol-ume becomes smaller and cell density increas-es [11, 18, 19]. The diffusion of water mole-cules is limited in this case and the ADCs decline. Literatures [20-22] figured out that axillary lymph node metastasis usually take place with an increase in S-phase fraction (SPF). Phase S is the period where DNA is syn-thesized and duplicated. SPF is a good indica-tor for tumor proliferation reflection. Tumor cells actively proliferated when SPF increases. Tumor cell doubling time is short; both cell den-sity and nucleus cytoplasm ratio increase, which result in more limitation on diffusion of water molecules and thus lower the ADC val-ues. Generally, the breast tumor that grows too fast and larger than 5 cm in size is accompa-nied by axillary lymph node metastasis [11, 12, 23]. It can be seen that breast tumors with axil-lary lymph node metastasis, most of which are accompanied with VEGF and MVD. Their SPF values are relatively high, and tumor cells grow faster than average. Consequently, the ADCs are relatively low. Thus, the breast cancer with axillary lymph node metastasis generally has lower ADCs. This is probably the main reason why ADCmin had closer correlation with group A, B, C rather than histopathologic grades. Therefore, we found that when it came to the correlation with tumor histopathologic classifi-cation and traditional prognosis factor, the choice between ADCmean and ADCmin made a dif-ference on the assessment. ADCmin could bet-ter reflect the pathological features of tumor. Moreover, many studies have attempted to pre-dict prognosis in patients with breast cancer. It has been revealed that there are traditional prognostic factors such as tumor grade and lymph node status [5, 11-13, 17, 19]. It has been indicated that prognostic index (PI) as fol-lows: PI=tumor size*0.2+lymph node stage (1-3)+ histopathological grade (1-3) [7]. Of these prognostic factors, the pathological grad-ing of the breast cancer, the SPF, VEGF and MVD reflect the cellularity [11, 14, 15, 18-23]. And our results have showed that ADC values were relative good correlation with different pathological grading and lymph node status, so ADCs may be used as surrogated marker for prognosis of breast cancer.
(DCIS) and grade I was not enough. The further study shall be done when we have more cases. In addition, the patients of breast cancer with axillary lymph node metastasis who had not been immunohistochemically detected with VEGF, MVD or SPF shall be detected by immu-nohistochemical marking. Moreover, our study had not discussed whether different b values or equipments provided by different manufac-turers had any influence on the study result [24, 25]. At last, the resolution of ADC figures was relatively low and yet there existed volume effect. Only obvious liquescent, hemorrhagic, and calcified area could be avoided. The influ-ence made on average and minimum ADC val-ues by tiny liquefaction, hemorrhage and calci-fication in the lesion was still hard to distin-guish. It should be analyzed comprehensively with morphology.
Conclusions
In conclusion, ADCmin can be considered as an optimal DWI single parameter of medical plan before breast cancer surgery and initial assess-ment of prognostic recurrence. There existed correlation between ADCmin and both histopath-ologic grades and prognostic recurrence groups. Above all, ADCmin had strong negative correlation with group A, B and C.
Acknowledgements
This study was supported by Guangxi Science and Technology Department research pro-grams (No. 14124004-1-11).
Disclosure of conflict of interest
None.
Address correspondence to: Danke Su, Depart- ment of Radiology, Affiliated Tumor Hospital of Guangxi Medical University, He Di Rd. #71, Nanning 530021, P. R. China. Tel: +(86)-771-5334950; E-mail: [email protected]
References
[1] Kuroki Y, Nasu K, Kuroki S, Murakami K, Hayashi T, Sekiguchi R and Nawano S. Diffusion-weighted imaging of breast cancer with the sensitivity encoding technique: analy-sis of the apparent diffusion coefficient value. Magn Reson Med Sci 2004; 3: 79-85.
[2] Kul S, Cansu A, Alhan E, Dinc H, Gunes G and Reis A. Contribution of diffusion-weighted im-aging to dynamic contrast-enhanced MRI in the characterization of breast tumors. AJR Am J Roentgenol 2011; 196: 210-217.
[3] Park MJ, Cha ES, Kang BJ, Ihn YK and Baik JH. The role of diffusion-weighted imaging and the apparent diffusion coefficient (ADC) values for breast tumors. Korean J Radiol 2007; 8: 390-396.
[4] Costantini M, Belli P, Rinaldi P, Bufi E, Giardina G, Franceschini G, Petrone G and Bonomo L. Diffusion-weighted imaging in breast cancer: relationship between apparent diffusion coef-ficient and tumour aggressiveness. Clin Radiol 2010; 65: 1005-1012.
[5] Kim SH, Cha ES, Kim HS, Kang BJ, Choi JJ, Jung JH, Park YG and Suh YJ. Diffusion-weighted imaging of breast cancer: correlation of the apparent diffusion coefficient value with prognostic factors. J Magn Reson Imaging 2009; 30: 615-620.
[6] Jeh SK, Kim SH, Kim HS, Kang BJ, Jeong SH, Yim HW and Song BJ. Correlation of the appar-ent diffusion coefficiappar-ent value and dynamic magnetic resonance imaging findings with prognostic factors in invasive ductal carcino-ma. J Magn Reson Imaging 2011; 33: 102-109.
[7] Elston CW and Ellis IO. Pathological prognostic factors in breast cancer. I. The value of histo-logical grade in breast cancer: experience from a large study with long-term follow-up. Histopathology 2002; 41: 154-161.
[8] Colpaert C, Vermeulen P, Jeuris W, van Beest P, Goovaerts G, Weyler J, Van Dam P, Dirix L and Van Marck E. Early distant relapse in “node-negative” breast cancer patients is not predict-ed by occult axillary lymph node metastases, but by the features of the primary tumour. J Pathol 2001; 193: 442-449.
[9] Guo Y, Cai YQ, Cai ZL, Gao YG, An NY, Ma L, Mahankali S and Gao JH. Differentiation of clinically benign and malignant breast lesions using diffusion-weighted imaging. J Magn Reson Imaging 2002; 16: 172-178.
[10] Woodhams R, Matsunaga K, Kan S, Hata H, Ozaki M, Iwabuchi K, Kuranami M, Watanabe M and Hayakawa K. ADC mapping of benign and malignant breast tumors. Magn Reson Med Sci 2005; 4: 35-42.
[11] Choi SY, Chang YW, Park HJ, Kim HJ, Hong SS and Seo DY. Correlation of the apparent diffu-sion coefficiency values on diffudiffu-sion-weighted imaging with prognostic factors for breast can-cer. Br J Radiol 2012; 85: e474-479.
patho-logical prognostic factors. NMR Biomed 2010; 23: 619-623.
[13] Hirano M, Satake H, Ishigaki S, Ikeda M, Kawai H and Naganawa S. Diffusion-weighted imag-ing of breast masses: comparison of diagnos-tic performance using various apparent diffu-sion coefficient parameters. AJR Am J Roentgenol 2012; 198: 717-722.
[14] Liu Y, Wang G, Xu WG, Song JN, Yang XQ and Wang WY. [Relevance of tumor angiogenesis in occurrence and development of breast can-cer]. Zhonghua Yi Xue Za Zhi 2009; 89: 1687-1689.
[15] Qiao EQ, Ji M, Wu J, Li J, Xu X, Ma R, Zhang X, He Y, Zha Q, Song X, Zhu L and Tang JH. Joint detection of multiple immunohistochemical in-dices and clinical significance in breast cancer. Mol Clin Oncol 2013; 1: 703-710.
[16] Kanngurn S, Thongsuksai P and Chewa- tanakornkul S. Chalkley microvessel but not lymphatic vessel density correlates with axil-lary lymph node metastasis in primary breast cancers. Asian Pac J Cancer Prev 2013; 14: 583-587.
[17] Li JY, Zhang Y, Zhang WH, Jia S, Kang Y and Tian R. Effects of differential distribution of mi-crovessel density, possibly regulated by miR-374a, on breast cancer prognosis. Asian Pac J Cancer Prev 2013; 14: 1715-1720.
[18] Bogner W, Gruber S, Pinker K, Grabner G, Stadlbauer A, Weber M, Moser E, Helbich TH and Trattnig S. Diffusion-weighted MR for dif-ferentiation of breast lesions at 3.0 T: how does selection of diffusion protocols affect di-agnosis? Radiology 2009; 253: 341-351. [19] Buadu LD, Murakami J, Murayama S,
Hashiguchi N, Sakai S, Masuda K, Toyoshima S, Kuroki S and Ohno S. Breast lesions: corre-lation of contrast medium enhancement pat-terns on MR images with histopathologic find-ings and tumor angiogenesis. Radiology 1996; 200: 639-649.
[20] Pervez S, Khan MN and Nasir MI. Comparative predictive value of three prognostic markers--S-phase fraction, PCNA and Mitotic count on axillary lymph node metastasis in carcinoma breast. J Ayub Med Coll Abbottabad 2007; 19: 3-5.
[21] Bakhtawar H, Ali NM, Khan S, Aziz SA, Sliddiqui T and Pervez S. Evaluation and reinforcement of the correlation of S-phase fraction with nod-al metastases, tumor grade and tumor size in breast carcinoma patients in Pakistan. Pathol Res Pract 2001; 197: 531-536.
[22] Chadha M, Chabon AB, Friedmann P and Vikram B. Predictors of axillary lymph node metastases in patients with T1 breast cancer. A multivariate analysis. Cancer 1994; 73: 350-353.
[23] Kamitani T, Matsuo Y, Yabuuchi H, Fujita N, Nagao M, Jinnouchi M, Yonezawa M, Yamasaki Y, Tokunaga E, Kubo M, Yamamoto H, Yoshiura T and Honda H. Correlations between appar-ent diffusion coefficiappar-ent values and prognostic factors of breast cancer. Magn Reson Med Sci 2013; 12: 193-199.
[24] Donati OF, Chong D, Nanz D, Boss A, Froehlich JM, Andres E, Seifert B and Thoeny HC. Diffusion-weighted MR imaging of upper ab-dominal organs: field strength and intervendor variability of apparent diffusion coefficients. Radiology 2014; 270: 454-463.