Comparison of upper-limb and lower-limb exercise training
in patients with intermittent claudication.
ZWIERSKA, Irena.
Available from Sheffield Hallam University Research Archive (SHURA) at:
http://shura.shu.ac.uk/20710/
This document is the author deposited version. You are advised to consult the publisher's version if you wish to cite from it.
Published version
ZWIERSKA, Irena. (2005). Comparison of upper-limb and lower-limb exercise training in patients with intermittent claudication. Doctoral, Sheffield Hallam University (United Kingdom)..
Copyright and re-use policy
See http://shura.shu.ac.uk/information.html
W U ii 'C 1';• iC lU J L.-wuii ! Ui I'-; ; ; a .
Coll6C]i8ts Cresccf
\tv-smpus i
Sheffield S10 2BP I
1 0 1 8 5 3 2 6 5 X
ProQuest Number: 10702808
All rights reserved
INFORMATION TO ALL USERS
The quality of this reproduction is dependent upon the quality of the copy submitted.
In the unlikely event that the author did not send a com plete manuscript and there are missing pages, these will be noted. Also, if material had to be removed,
a note will indicate the deletion.
uest
ProQuest 10702808
Published by ProQuest LLC(2017). Copyright of the Dissertation is held by the Author.
All rights reserved.
This work is protected against unauthorized copying under Title 17, United States C ode Microform Edition © ProQuest LLC.
ProQuest LLC.
789 East Eisenhower Parkway P.O. Box 1346
Comparison of
Upper-Limb and Lower-Limb
Exercise Training in Patients with
Intermittent Claudication
Irena Zwierska
A thesis submitted in partial fulfilment of the requirements of Sheffield Hallam University
for the degree of Doctor of Philosophy
December 2005
Dedication
This thesis is primarily dedicated to the life and memory of Professor Richard F.M. Wood (1943-2003), for his relentless work with patients with intermittent claudication.
Professor Richard F.M. Wood, or “Prof’ as he was known, was Professor of Vascular Surgery, at the University of Sheffield (1994-2002), and was a key member of my PhD supervisory team. His vision, professionalism, intellect, support and kindness will always be remembered with great fondness. His unfortunate passing in April 2003, prior to study completion, meant that the study outcomes were unknown to him. His work however, lives on in the lives of so many that he encouraged, inspired and supervised, of which I am but one. I feel very honoured and proud to have known him.
This thesis is also dedicated to the other two gentlemen of my PhD supervisory team, namely; Dr John M. Saxton (Director of Studies and Exercise Physiologist, Sheffield Hallam University) and Professor A. Graham Pockley (Professor of Immunobiology, University of Sheffield).
Gentlemen, I shall always be grateful to you for your inspiration, vision, support and encouragement throughout this study, which deserves special recognition. I feel privileged and honoured to have been chosen to conduct this prestigious research, and to work alongside such expertise. I hereby formally acknowledge my unreserved
gratitude to you, for allowing me to be a part of your team. This study changed the lives of so many patients, this was your conception and I am grateful to bear its fruits.
The work submitted herewith is in recognition of these gentlemen’s endeavours.
Acknowledgments
This research was supported by a grant from the British Heart Foundation (Grant no. PG/2000042). I wish to acknowledge and thank the University of Sheffield and the Northern General Hospital for supporting this collaborative study, and Sheffield Hallam University for hosting it.
My eternal thanks are extended to the gentlemen who made this study and PhD possible, namely my supervisors; Dr. John M. Saxton, Professor A. Graham Pockley and Professor Richard F.M. Wood (R.I.P.). Dr. John M. Saxton, negotiated that the research should be undertaken at Sheffield Hallam University, and supervised the study on a day to day basis. His relentless work and support over the years is formally
acknowledged.
Mr. Shah Nawaz and Dr. Richard Walker, I wish to formally thank you for undertaking the preliminary 6-week study (Walker et al. 2000). This helped to secure the funding for this research. Dr Richard Walker is also acknowledged for the development of the macro-program, used to calculate walking distances from respective time measurements obtained during the incremental shuttle-walk test. Special thanks are extended to Mr. Jonathan Male, Dr. David Claxton and Mr. Carl Wells, for providing technical assistance during this study, and to Professor Edward Winter for statistical assistance.
I wish to acknowledge and thank Mr. Sohail Choksy, FRCS, for his support and commitment in clinically re-assessing all patients, recruited for this study. Also, I wish to acknowledge the support of all of the Vascular Consultants at the Sheffield Vascular Institute (S.V.I) for referring patients, and allowing access to recruit patients onto this study. I also wish to thank the administrative staff at the S.V.I for their assistance.
This study and the findings thereof would not have been possible without the participation, commitment, dedication, enthusiasm and co-operation of all the 104 patients recruited. Special thanks are extended especially to the 94 patients who completed the 24-week intervention period, for their twice weekly attendance at the training sessions, despite their advancing age. I remain eternally grateful to you all.
I also wish to acknowledge the use of the WIQ, EQ-5D, MOS SF-36 v2, PAD-PAR and
Statement of Originality
The strategy of using upper-limb exercise training to improve walking performance in patients with peripheral arterial disease (PAD) has previously only been described during a preliminary six-week study conducted by members of our investigatory team (Walker et al. 2000).
Following this preliminary work, a larger-scale six-month randomised controlled trial (RCT) was needed to prove that upper-limb exercise training can evoke positive health outcomes and to further understand the mechanisms of action. Patients’ perception of community-based walking ability and quality of life following such an exercise strategy also necessitated investigation. In addition, long-term (48-weeks) post-intervention follow-up was essential to compare patients walking ability, functional capacity,
community-based walking ability and quality of life, after undertaking such a structured upper-limb exercise regimen. Such a robustly designed trial has never been performed previously.
All of the recruitment, initial consultations and approximately 99.9% of all assessment and training sessions were performed by myself. Mr. Jonathan Male provided technical assistance in the majority of assessment and training sessions. Statistical analysis was performed by myself, with guidance and verification of findings confirmed by Dr. John. M. Saxton.
With the exception o f any statement to the contrary, all the data presented in this report are the result o f my own efforts. In addition, no parts o f this report have been copied from other sources. I understand that any evidence o f plagiarism and/or the use o f
unacknowledged third party data will be dealt with as a serious matter.
Signed...
QS/oS'jcrf'
Contents
Dedication...ii
Acknowledgements... iii
Statement of originality...iv
Contents... v
List of Tables... :xii
List of Figures... xiv
Appendices... xvi
Conference presentations and publications arising from this study... xvii
Abstract... xix
C h a p t e r 1 - I n t r o d u c t i o n ...l 1.1 Background information... 1
1.1.1 Natural history of intermittent claudication... . 2
1.1.2 Associated diseases and mortality...3
1.1.3 Diagnosis of intermittent claudication...4
1.1.3.1 Ankle to Brachial Pressure Index (ABPI)...5
1.1.3.2 ABPI interpretation... 7
1.2 Assessment of functional status... 8
1.2.1 Introduction... 8
1.2.2 Objective measurement of walking performance... 8
1.2.2.1 Claudication and maximum walking distance...8
1.2.2.2 Treadmill tests of walking performance... 9
1.2.2.3 Alternative testing modalities... 110 1.2.3 Questionnaires used to evaluate functional status... ..13
1.2.3.1 Introduction...13
1.2.3.2 Walking Impairment Questionnaire (WIQ)...14
1.2.3.3 Physical activity recall (PAD-PAR) questionnaire .15 1.2.3.4 Quality of life assessment - the Medical Outcomes Study SF-36 v2... 16
1.3 Current management of intermittent claudication... 19
1.3.1 Treatment of intermittent claudication... 19
( 1.3.2 Intervention therapies...20
1.3.3 Pharmacological therapies...22
1.3.4 Lifestyle management... 25
1.3.5 Risk factor modification... 26
1.3.6 Key modifiable risk factors in PAD... 27
1.3.6.1 Smoking... 27
1.3.6.2 Diabetes...29
1.3.7 Physical activity... 30
1.3.7.1 Introduction... 30
1.3.7.2 Exercise rehabilitation...30
1.3.7.3 Possible contraindications to exercise in diabetic patients with PAD... 32
1.3.7.4 Mechanisms associated with improved walking ability.. 33
1.3.7.5 Central and peripheral circulatory adaptations ..33
1.3.7.6 Local metabolic adaptations in skeletal muscle ...34
1.3.7.7 Other adaptations... 36
1.4 Exercise training... 37
1.4.1 Supervised vs. non-supervised exercise training...37
1.4.2 Importance of initial consultation sessions...39
1.4.3 Time of day preferences to undertake exercise...39
1.4.4 Limitations and long-term efficacy of structured exercise programmes...40
1.4.5 Adverse effects with exercise...40
1.4.6 Cardiovascular demand and safety during exercise... .41
1.4.7 Effects of exercise rehabilitation on cardiovascular risk factors...41
1.4.8 Optimum exercise programme and prescription... 42
1.4.9 Cost implications...45
1.5 Comparison of various modes of exercise training... 46
1.5.1 Walking exercise... 46
1.5.2 Potential problems with walking exercise rehabilitation programmes...47
1.5.3 Alternative training modalities...48
1.5.4 Physiology of upper- and lower-limb exercise... 50
1.6 Study aims...53
C h a p t e r 2 - M e th o d o lo g y ... 54
2.1 Research design... 54
2.2 Patient selection and accustomisation to test procedures...54
2.2.1 Selection and recruitment... 54
2.2.2 Inclusion criteria... 56
2.2.3 Exclusion criteria... 56
2.2.4 Power calculations for determination of sample size...57
2.2.5 Accustomisation of patients to the test procedures... 57
2.2.5.1 Accustomisation to Borg (RPE and CR-10) scales...57
2.2.5.2 Leg and arm-cranking accustomisation... 58
2.2.5.3 Incremental shuttle-walk accustomisation...59
2.2.6 Time of day preferences to undertake exercise... 59
2.2.8 Randomisation and frequency of attendance... 61
2.2.8.1 Patient randomisation... 61
2.2.8.2 Frequency of assessment sessions...61
2.3 Assessment sessions...61
2.3.1 Assessment of walking performance using the Incremental Shuttle-Walk Test...62
2.3.2 Precautions during the Shuttle-Walk assessment ... 63
2.4 Outcome measures during walking performance...64
2.4.1 Heart rate, perceived pain and perceived exertion... 64
2.4.2 Ankle-Brachial Pressure Index (ABPI)...64
2.4.3 Blood lactate... 65
2.5 Assessment of functional capacity... .65
2.5.1 Incremental arm- and leg-cranking assessments... .65
2.5.2 Standardisation of assessment sessions...67
2.6 Outcome measures during incremental exercise... 69
2.6.1 Maximum achieved power... 69
2.6.2 Pulmonary variables... 69
2.6.3 Cardiovascular variables ...70
2.6.4 Blood lactate... .70
2.6.5 Perceived exertion and pain...70
2.6.6 Other variables of interest... 71
2.6.6.1 Haematocrit... 71
2.6.6.2 Venepuncture... 71
2.6.6.3 Body mass index (BMI)... 71
2.6.6A BMI score interpretation... 72
2.7 Calibration of equipment... 72
2.7.1 Expired gas analysis (mass spectrometer)... 72
2.7.2 Calibration of YSI sport... 73
2.7.3 Calibration of cycle ergometers and arm-crankers... 74
2.8 Questionnaires... .74
2.8.1 Quality of life: Medical Outcomes Study SF-36 v2 and the EuroQol EQ-5D questionnaire... .74
2.8.2 Walking Impairment Questionnaire (WIQ)...75
2.8.3 Self-perceived walking ability...76
2.8.4 Confidence in walking... ..77
2.8.5 Physical activity recall (PAD-PAR)... 77
2.8.6 Self perception of physical activity status... 78
2.9 Supervised Exercise Sessions... ... 78
2.9.1 Structure of training sessions... 78
2.9.2 Exercise intensity during training sessions... 81
2.9.3 Precautions during the training sessions... 81
2.9.4 Monitoring of attendance... 81
2.9.5 Monitoring of control patients... 82
2.9.6 Medication... 82
2.10 Statistical analysis...82
C h a p t e r 3 - I n t e r v e n t i o n S tu d y R e s u l t s ...85
3.1 Demographics, Patient Attendance and Compliance... 85
3.1.1 Demographics... 85
3.1.2 Patients medication history... 86
3.1.3 Patients time of day preferences to undertake exercise... 87
3.1.4 Patient attendance and compliance...88
3.2 Intervention Study Walking Performance...89
3.2.1 Claudication Distance (CD)... .89
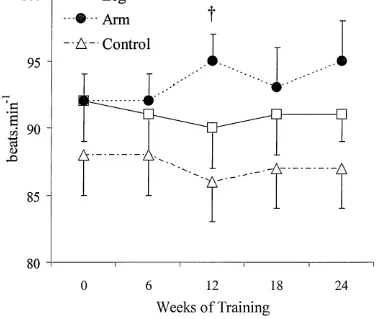
3.2.1.2 Heart rate at CD... 92
3.2.1.3 Perceived pain at CD... 93
3.2.2 Maximum Walking Distance (MWD)... 94
3.2.2.1 Peak heart rate at MWD.... ..91
3.22.2 Peak blood lactate at MWD... ...97
3.2.2.3 Blood lactate 5-min post MWD... .98
3.2.2.4 Perceived exertion and perceived pain at MWD... 100
3.2.3 Patients self perceived walking ability... 101
3.2.4 Confidence in walking...101
3.2.5 Changes in ABPI... 102
3.3 Walking Impairment Questionnaire domains... 103
3.3.1 Claudication Pain Severity, Walking Distance, Walking Speed and Stair Climbing Ability...103
3.3.2 Correlation of WIQ Indices with walking performance... 105
3.4 Physical Activity...107
3.4.1 Incentive to perform physical activity...107
3.4.2 Self perception of physical activity status... 107
3.4.3 Global PAD-PAR physical activity status... 108
3.4.3.1 PAD-PAR work, household and leisure activities..._109 3.5 Quality of life - SF 36 v2 questionnaire...111
3.5.2 The longer-term influence of exercise on the domains of
physical function... I ll
3.5.3 The short-term influence of exercise on the domains of
mental health...113
3.5.4 The longer-term influence of exercise on the domains of mental health...113
3.6 General Health Status identified using the EuroQol EQ-5D questionnaire 115 3.6.1 The short-term influence of exercise on EQ-5D domains ...115
3.6.2 The longer-term influence of exercise on EQ-5D domains ...115
3.7 Physical function as assessed during the incremental leg and arm-cranking assessments... ...117
3.7.1 Pre-intervention cardiorespiratory performance...117
3.7.2 Physical function during the intervention period... ...118
3.7.2.1 Peak power output... .118
3.7.22 Peak VOi... .121
3.7.2.3 Peak VCO2...121
3.7.2.4 PeakRER...121
3.7.2.5 Peak VE...125
3.12.6 Peak VEIVO2... ....125
3.12.1 Peak Breath Frequency...128
3.7.2.8 Peak Tidal Volume... 128
3.7.3 Peak cardiovascular responses throughout the intervention period. ..131
3.7.3.1 Peak Systolic Blood Pressure...131
3.1.32 Peak Diastolic Blood Pressure...131
3.1.3.3 Peak Heart Rate (HR)... .134
3.7.3.4 Peak Rate Pressure Product (RPP)...134
3.7.4 Peak blood lactate responses throughout the intervention period 137 3.7.5 Peak psycho-physiological responses throughout the intervention period... .139
3.7.6 Changes in haematocrit during the intervention period... 139
3.7.7 Changes in BMI during the intervention period... 140
C h a p t e r 4 - I n t e r v e n t i o n S tu d y D is c u s s io n ... 142
Overview... 142
Outcome measures - walking performance... 144
Mechanisms underpinning improved walking performance...147
Physiological responses to incremental upper- and lower-limb aerobic exercise in the whole cohort of patients... 153
Tolerance to upper- and lower-limb aerobic exercise... 153
Changes in upper- and lower-limb aerobic exercise capacity after upper- and lower-limb exercise training...156
Functional status measures...159
Walking Impairment Questionnaire (WIQ)... 160
SF-36 v2 and EQ-5D questionnaires...165
Short-term influence of exercise rehabilitation on quality of life... 166
Long-term influence of exercise rehabilitation on quality of life... 168
Compliance to the assessment and exercise training sessions...172
Physical activity status between groups... 176
C h a p t e r 5 - I n t e r v e n t i o n S tu d y C o n c lu s io n s ... 180
Conclusions... 180
C h a p t e r 6 - F o llo w - U p S tu d y R e s u l t s ...182
6.1 Patient attendance and compliance to the follow-up assessments... _182 6.2 Follow-up study walking performance...183
6.2.1 Claudication distance (CD)... 183
6.2.1.1 Heart Rate at CD... 185
6.2.1.2 Perceived Pain at CD... 186
6.2.2 Maximum Walking Distance (MWD)... 187
6.2.2.1 Peak Heart Rate at MWD... 190
6.2.2.2 Peak Blood Lactate at MWD...191
6.2.2.3 Peak Blood Lactate 5-min post MWD... 191
6.2.2A Perceived Exertion and Perceived Pain at MWD...193
6.2.3 Confidence in walking... 194
6.2.4 Changes in ABPI... 194
6.3 Walking Impairment Questionnaire domains..._196 6.3.1 Claudication Pain Severity, Walking Distance, Walking Speed and Stair Climbing Ability... 196
6.4 Physical Activity...198
6.4.1 Self perception of physical activity status...198
6.4.2 Global PAD-PAR physical activity...199
6.4.2.1 PAD-PAR work, household and leisure activities 199
6.5 Quality of life - SF-36 v2 questionnaire... 201
6.5.1 The influence of exercise on the domains of physical function during the follow-up period...201
6.5.2 The influence of exercise on the domains of mental health during the follow-up period... ... 203
6.7 Cardiorespiratory function as assessed during the incremental leg and
arm-cranking assessments... 207
6.7.1 Peak power output... 207
6.7.2 Peak VO2... 209
6.7.3 Peak VCO2...209
6.7.4 Peak RER... 209
6.7.5 Peak VE... 213
6.7.6 Peak VE/VO2... 213
6.7.7 Peak Breath Frequency...216
6.7.8 Peak Tidal Volume... 216
6.8 Peak cardiovascular responses throughout the follow-up period...219
6.8.1 Peak Systolic Blood Pressure... 219
6.8.2 Peak Diastolic Blood Pressure... 219
6.8.3 Peak Heart Rate (HR)... 222
6.8.4 Peak Rate Pressure Product (RPP)... 222
6.8.5 Peak Blood Lactate response... 225
6.9 Peak psycho-physiological responses throughout the follow-up period... .227
6.10 Changes in haematocrit during the follow-up period... .228
6.11 Changes in BMI during the follow-up period...229
C h a p t e r 7 - F o llo w - U p S tu d y D is c u s s io n ...230
Overview... .230
Outcome measures - walking performance...234
Physical activity status following exercise rehabilitation...236
Functional status measures following exercise rehabilitation...240
Exercise tolerance following exercise rehabilitation... 243
C h a p t e r 8 - F o llo w - U p S tu d y C o n c lu s io n s ...244
Conclusions... 244
Study limitations and strengths...244
Future research...246
A p p e n d ic e s ... 248
List of Tables
Tables Incorporated in Chapter 1 - Introduction
Table 1 ABPI interpretation... 7
Table 2 Definitions of the extreme scores in the MOS SF-36 questionnaire...18
Table 3 Improvement in CD and MWD in various studies... 44
Table 4 Patient anxieties associated with walking exercise...48
Table 5 Physiological mechanisms suspected to be responsible for the lower peak VOi values during arm-exercise compared to leg-exercise...51
Tables Incorporated in Chapter 2 - Methodology Table 6 Scoring of the lark / owl questionnaire... 59
Table 7 BMI score interpretation...72
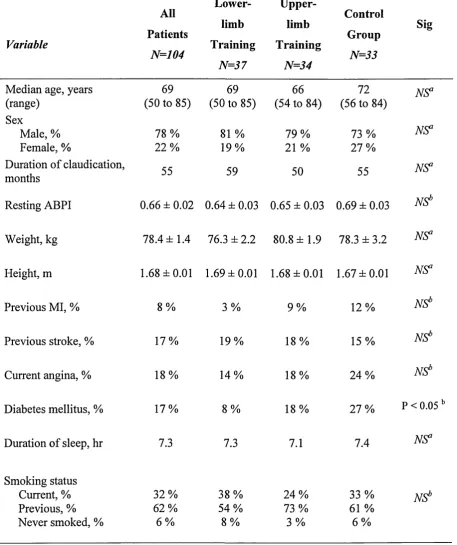
Tables Incorporated in Chapter 3 - Intervention Study Results Table 8 Demographics of the entire patient group and those of the three study groups...86
Table 9 Medication details of the entire patient group and of those of the three study groups... 87
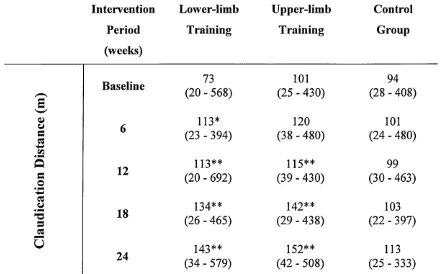
Table 10 CD data at each assessment stage of the intervention period...90
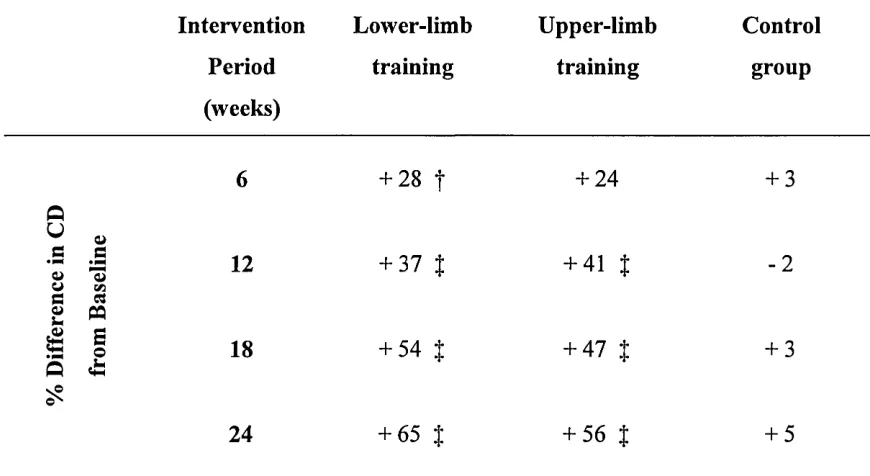
Table 11 Mean percentage change in CD from baseline at each assessment stage of the intervention period... 92
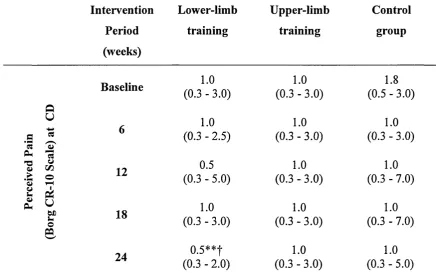
Table 12 Perceived pain (Borg CR-10 scale) at CD, at each assessment stage of the intervention period...94
Table 13 Mean percentage change in MWD from baseline at each assessment stage of the intervention period...95
Table 14 Perceived pain and perceived exertion at MWD at each assessment stage of the intervention period... 100
Table 15 Patients self perceived walking ability following the intervention____ 101 Table 16 Patients perceived confidence in walking, following the intervention. .102 Table 17 Resting, post shuttle-walk and mean individual difference in ABPI at each assessment stage of the intervention period...103
Table 19 Relationship between walking performance (MWD) and WIQ
scores for the entire patient group, pre-intervention... .105
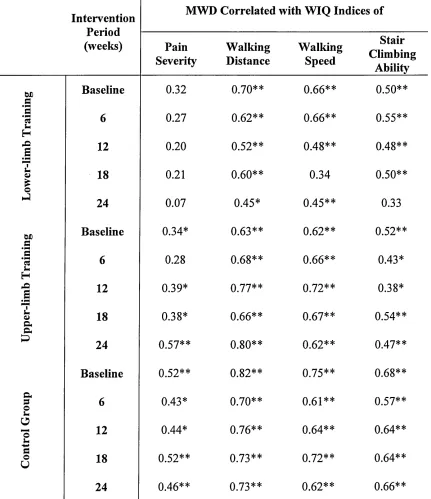
Table 20 Relationship between walking performance and WIQ scores for the three study groups at each assessment stage during the intervention... 106
Table 21 Patients self-assessed perception to perform physical activity... 107
Table 22 Patients self-assessed physical activity status... 108
Table 23 EuroQol EQ-5D questionnaire domains...116
Table 24 Cardiorespiratory, metabolic and perceptual responses at maximum exercise tolerance during the ACT and LCT assessments, for all patients and for the sub-group with higher arm aerobic exercise capacity... 118
Table 25 Peak power output at maximum exercise tolerance during the LCT and ACT at each assessment stage of the intervention period... 120
Table 26 Changes in perceived exertion and perceived pain at each assessment stage of the intervention period... 139
Tables Incorporated in Chapter 6 - Follow-Up Study Results Table 27 Number of patients attending at each follow-up assessment ...182
Table 28 CD data at each assessment stage of the follow-up period... 183
Table 29 Mean percentage change in CD from baseline at each assessment stage of the follow-up period...185
Table 30 Perceived pain at CD, throughout the follow-up period... 187
Table 31 Mean percentage change in MWD from baseline at each assessment stage of the follow-up period... 188
Table 32 Perceived pain and RPE at MWD throughout the follow-up period— 193 Table 33 Patients perceived confidence in walking at each assessment stage of the follow-up period...194
Table 34 Resting, post shuttle-walk and mean individual difference in ABPI at each assessment stage of the follow-up period...195
Table 3 5 Changes in WIQ domains... 197
Table 36 Patients self-assessed physical activity status...198
Table 37 EuroQol EQ-5D questionnaire domains... .206
Table 38 Peak power output at maximum exercise tolerance during the LCT and ACT at each assessment stage of the follow-up period ... 208
List of Figures
Figures Incorporated in Chapter 1 - Introduction
Figure 1 Patient undertaking a shuttle-walk test... 13
Figures Incorporated in Chapter 2 - Methodology Figure 2 Patient undertaking a LCT and an ACT assessment... 68
Figure 3 Patient undertaking upper-limb and lower-limb exercise training... 80
Figures Incorporated in Chapter 3 - Intervention Study Results Figure 4 Patients time of day preferences to undertake exercise...88
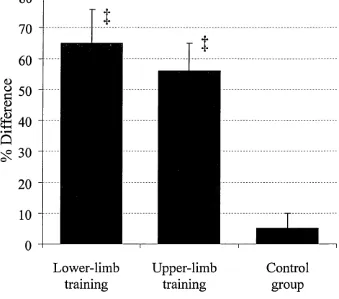
Figure 5 Changes in CD upon completing the intervention period...91
Figure 6 Changes in Heart Rate at CD...93
Figure 7 Changes in MWD upon completing the intervention period ...96
Figure 8 Changes in Heart Rate at MWD... ...91
Figure 9 Changes in Blood Lactate concentration at MWD and 5-min post MWD...99
Figure 10 Changes in global physical activity during the intervention period____108 Figure 11 PAD-PAR scores relating to work, household and leisure activities.... 110
Figure 12 Changes in the physical function domains of the SF-36 v 2... 112
Figure 13 Changes in the mental health domains of the SF-36 v2... ...114
Figure 14 Changes in Peak VO2during leg- and arm-cranking... 122
Figure 15 Changes in Peak FCO2 during leg- and arm-cranking... 123
Figure 16 Changes in Peak RER during leg- and arm-cranking... 124
Figure 17 Changes in Peak VEduring leg- and arm-cranking... 126
Figure 18 Changes in Peak VE/VO2during leg- and arm-cranking...127
Figure 19 Changes in Peak Breath Frequency during leg- and arm-cranking... 129
Figure 20 Changes in Peak Tidal Volume during leg- and arm-cranking...H30 Figure 21 Changes in Peak Systolic Blood Pressure during leg- and arm-cranking... 132
Figure 22 Changes in Peak Diastolic Blood Pressure during leg- and arm-cranking...—133
Figure 24 Changes in Peak Rate Pressure Product during leg- and
arm-cranking... 136
Figure 25 Changes in Peak Blood Lactate during leg- and arm-cranking...138
Figure 26 Changes in haematocrit during the intervention period... .140
Figure 27 Changes in BMI during the intervention period... 141
Figures Incorporated in Chapter 6 - Follow-Up Study Results Figure 28 Change in CD at 48-weeks follow-up... 484
Figure 29 Heart Rate at CD during the follow-up period... 186
Figure 30 MWD during the follow-up period... 189
Figure 31 Heart Rate at MWD during the follow-up period... 190
Figure 32 Changes in Blood Lactate concentration at MWD and 5-min post MWD...192
Figure 33 PAD-PAR global physical activity during the follow-up period...199
Figure 34 PAD-PAR scores relating to work, household and leisure activities... 200
Figure 35 Changes in the physical function domains of the SF-36 v2 ... 202
Figure 36 Changes in the mental health domains of the SF-36 v2 ...204
Figure 37 Changes in Peak VO2during leg- and arm-cranking... 210
Figure 38 Changes in Peak VCO2during leg- and arm-cranking... 211
Figure 39 Changes in Peak RER during leg- and arm-cranking... 212
Figure 40 Changes in Peak VEduring leg- and arm-cranking... 214
Figure 41 Changes in Peak VE / VO2during leg- and arm-cranking ... 215
Figure 42 Changes in Peak Breath Frequency during leg- and arm-cranking____217 Figure 43 Changes in Peak Tidal Volume during leg- and arm-cranking...218
Figure 44 Changes in Peak Systolic Blood Pressure during leg- and arm-cranking... 220
Figure 45 Changes in Peak Diastolic Blood Pressure during leg- and arm-cranking... 221
Figure 46 Changes in Peak Heart Rate during leg- and arm-cranking. ...223
Figure 47 Changes in Peak Rate Pressure Product during leg- and arm-cranking... 224
Figure 48 Changes in Peak Blood Lactate during leg- and arm-cranking...226
Appendices
Appendix 1 Patient inclusion and exclusion criteria... 248
Appendix 2 Letter to patient...249
Appendix 3 Patient information sheet... 250
Appendix 4 Patient consent form... 252
Appendix 5 PAR-Q form...253
Appendix 6 Borg RPE scale...254
Appendix 7 Borg CR-10 scale... 255
Appendix 8 Borg RPE scale instructions... 256
Appendix 9 Borg CR-10 scale instructions...257
Appendix 10 Modified Home and Ostberg (1976) questionnaire... 258
Appendix 11 Demographics...261
Appendix 12 Letter to GP...264
Appendix 13 Medical Outcomes Study SF-36 v2 questionnaire...265
Appendix 14 EuroQol EQ-5D questionnaire... 267
Appendix 15 Walking Impairment Questionnaire (WIQ)...270
Appendix 16 Self perceived walking ability... 271
Appendix 17 Confidence in walking... 272
Appendix 18 PAD-PAR questionnaire...273
Appendix 19 PAD-PAR physical activity card...275
Appendix 20 Self perception of physical activity status... 276
Appendix 21 Incentive to perform physical activity... 277
Conference Presentations and Publications
Arising from this Study
Publications
Zwierska I, Walker RD, Choksy SA, Male JS, Pockley AG, Saxton JM. (2005). Upper- versus lower-limb aerobic exercise rehabilitation in patients with symptomatic
peripheral arterial disease: a randomised controlled trial. J Vase Surg, 42: 1122-1130.
Zwierska I, Walker RD, Choksy SA, Male JS, Pockley AG, Saxton JM. (2006) Relative tolerance to upper- and lower-limb aerobic exercise in patients with peripheral arterial disease. EurJ Vase Endovasc Surg, 31: 157-163.
Published Abstracts
Poster communication to the Physiological Society, University o f York, December 2001.
Zwierska I, Saxton JM, Male JS, Pockley AG, Wood RFM (2002). Cardiorespiratory responses to incremental arm- and leg-cranking exercise in patients with peripheral arterial disease. Journal o f Physiology, 539P, 71P.
Poster communication to the European Physiological Society, Germany, April 2002.
Zwierska I, Saxton JM, Nawaz S, Wilkinson CH, Walker RD, Pockley AG, Wood RFM (2002). Comparison of treadmill and shuttle walk tests for assessing walking
performance in patients with intermittent claudication. European Journal o f Physiology,
443, S361-362.
Oral communication at the BASES Commonwealth Games Conference, Manchester, August 2002.
Zwierska I, Saxton JM, Male JS, Pockley AG, Wood RFM (2003). Relationship
Oral communication at the British Vascular Society, Belfast, November 2002.
Zwierska I, Saxton JM, Nawaz S, Wilkinson CH, Walker RD, Shackley P, Pockley AG, Wood RFM (2003). A comparison of the shuttle-walk and treadmill exercise tests for assessing patients with peripheral arterial disease. British J. o f Surgery, 90 (4), 491.
Oral communication to the Physiological Society, University College London, December 2002.
Zwierska I, Saxton JM, Male JS, Choksy S, Pockley AG, Wood RFM (2003). Walking performance and cardiorespiratory responses to upper- and lower-limb exercise training in patients with peripheral arterial disease. Journal o f Physiology, 547P, Cl 23.
Poster communication at the American College o f Sports Medicine Annual Meeting, San Francisco, May 2003.
Saxton JM, Zwierska I, Male JS, Choksy S, Pockley AG, Wood RFM (2003). Factors limiting upper and lower-limb aerobic exercise tolerance in patients with peripheral arterial disease. Medicine and Science in Sports and Exercise, 35, S39.
Poster communication at the BASES-BASEM Conference, Sheffield, September 2003.
Zwierska I, Male JS, Choksy S, Wood RFM, Pockley AG, Saxton JM (2004). Factors associated with incremental shuttle-walk performance in patients with peripheral arterial disease. Journal o f Sports Sciences, 22 (3), 296-297.
Oral communication at the BASES annual conference, Liverpool, September 2004.
Zwierska I, Male JS, Choksy SA, Pockley AG, Saxton JM (2005). Physiological and perceptual responses to upper- and lower-limb aerobic exercise in patients with peripheral arterial disease. Journal o f Sport Sciences, 23, (2), 143.
Poster communication at the Physiological Society, Kings College London, December 2004.
Zwierska I, Male JS, Choksy SA, Wood RFM, Pockley AG, Saxton JM (2005).
Abstract
Objectives: To investigate the effects of a 24-week programme of upper- and lower- limb aerobic exercise training on walking performance and quality of life in patients with symptomatic peripheral arterial disease (PAD) and to study the mechanisms, which could influence symptomatic improvement.
Methods: Following approval from the North Sheffield Local Research Ethics Committee, 104 patients (median age 69 y, range 50-85 y) with stable PAD were randomised into an upper- or lower-limb aerobic exercise training group, or to a non exercise training control group. Training was performed twice weekly for 24-weeks at equivalent relative exercise intensities. An incremental arm- and leg-crank test (ACT and LCT, respectively) to maximum exercise tolerance was performed before and at 6-,
12-, 18- and 24-weeks of the intervention to determine peak oxygen consumption
(VO2). Walking performance, defined as the claudication and maximum walking
distance (CD and MWD respectively) achieved before intolerable claudication pain, was assessed at the same time-points using a shuttle-walk protocol. Peak blood lactate concentration, ratings of perceived exertion (Borg RPE) and pain (Borg CR-10) were recorded during all assessments. Physical activity status, community-based walking ability and quality of life were assessed throughout the intervention period. Assessments were repeated 6-, 12-, 24- and 48-weeks following the intervention period.
Results: Both CD and MWD increased over time (.P <0.01) in both training groups.
At 24-weeks, CD had improved by 56% and 65% and MWD had improved by 30% and 35% (P <0.01) in the upper-limb and lower-limb exercise groups, respectively. These changes were associated with improvements in community-based walking distance, speed and stair-climbing ability (P < 0.01). All patients assigned to exercise training exhibited an increase in LCT peak VO2 at the 24-week time-point in relation to baseline
measures (P <0.01) and control patients (P < 0.01), whereas ACT peak VO2 at the 24-
week time-point was only improved in the upper-limb exercise training group (P <
0.05). An increase in peak blood lactate concentration (1.95 ± 0.14 vs. 2.40 ±0.17 mM, mean ± SEM; P < 0.05) and amount of pain experienced at MWD (P < 0.05) was only observed in the upper-limb exercise training group. This suggests that an alteration in exercise pain tolerance accounted, at least in part, for the improvement in MWD in this group. Upon completing the intervention period the general health status of both exercise training groups was improved in relation to the control group (P < 0.05). However, improvements in physical functioning and bodily pain in relation to baseline
(P < 0.05) and energy and vitality in relation to control patients (P < 0.05) were only observed in the upper-limb training group. At 48-weeks follow-up, CD remained
improved by 39% and 48% (P < 0.05) and MWD remained improved by 18% and 26%
(P < 0.05) in the upper-limb and lower-limb exercise groups, respectively, compared to baseline measures. A retained improvement in walking confidence (P <0.01) and community-based walking distance (P < 0.05) was also observed, however global physical activity status in both exercise trained patient groups, returned to baseline. Conclusions: Both upper- and lower-limb aerobic exercise training can be useful exercise training modalities for improving cardiovascular function, walking
Chapter 1 - Introduction
1.1 Background information
Peripheral arterial disease (PAD) is a clinical manifestation of atherosclerosis that is prevalent in industrialised societies (Mohler III et al. 2003). Epidemiological studies illustrate that PAD is very common when screening is performed in older adults (Newman, 2000). Intermittent claudication is the most common symptomatic
manifestation of mild to moderate PAD (Regensteiner et al. 1997a), typically occurring in one out of every 20 people over the age of 65 years in the general population (Beebe, 2001). The condition usually results from atherosclerotic narrowing of the lower-limb arteries (Santilli et al. 1996) and it is generally characterised by lesions within the aorto-iliac and/or superficial femoral arteries, popliteal arteries or femoropopliteal arterial segments.
In the presence of slowly progressive arterial stenosis, blood flow through collateral channels is usually sufficient to maintain normal metabolic function at rest, but is inadequate to meet an increased metabolic demand during exercise (McCombs and Subramanian, 2002). During ambulation, when the arterial oxygen supply is insufficient to meet the metabolic requirements of the exercising leg muscles (Beebe, 2001;
Regensteiner and Hiatt, 1995), the environment for substrate metabolism becomes relatively anaerobic, thereby resulting in the local accumulation of lactic acid and metabolic by-products; this accounts for the development of muscle pain and tightness (claudication) (McCombs and Subramanian, 2002).
The term ‘claudication’ is derived from the Latin word claudicare, meaning to “limp”, after the Roman Emperor Claudius who limped - limping is the typical gait pattern observed in patients with claudication (Hiatt and Nehler, 2001). Patients typically walk at a slower pace and exhibit a decreased step length and cadence compared with age- matched healthy individuals and these abnormal gait parameters impair walking ability (Scherer et al. 1998). The pain is often described as cramp-like (Beebe, 2001), and although this most commonly affects the calf muscles (Hiatt and Nehler, 2001), it can also affect the thigh and buttock regions in one or both legs during walking (Santilli et al. 1996). The pain usually subsides within ten minutes of rest (McDermott et al.
Compared with healthy individuals of a similar age, the peak treadmill walking
performance of patients with claudication is reduced by 50% to 60% (Hiatt and Nehler,
2001). Furthermore, on the basis of peak oxygen uptake (FO2) measurements, these
patients exhibit an approximately 50% reduction in peak aerobic exercise capacity compared to healthy age-matched control patients (Hiatt et al 1987; Hiatt et al. 1988) - the clinical condition of these patients is therefore of a similar severity as class III heart failure patients (Hiatt, 1999). The condition is also associated with an increased risk of cardiovascular morbidity and mortality (Regensteiner and Hiatt, 2002b).
Intermittent claudication is a relatively common condition (Beebe, 2001), with males developing claudication about twice as frequently as females (McCombs and
Subramanian, 2002). Approximately 2% of men aged 45-69 years and 1% of women
aged 50-69 years are affected (Hughson et al 1978). The Framingham study estimated
the incidence of claudication at 26.6 per 1000 males and 13.3 per 1000 females less than 65 years of age (Kannel and McGee, 1985). The prevalence of claudication increases with age, with up to 1 in 5 patients over the age of 75 years being affected (Spronk et al
2003). When questioned, many older patients consider increased difficulty in walking to be a normal consequence of ageing (Boccalon, 1999) and thus, do not report symptoms to a physician (Beebe, 2001). This might account for the fact that, despite its prevalence, PAD often remains undiagnosed and the risk of cardiovascular ischaemic events,
disease progression, functional disability, amputation and death are therefore increased (Treat-Jacobson and Walsh, 2003). An under-representation of the condition might also account for the observed gender differences in its incidence.
1.1.1 Natural history o f intermittent claudication
Despite the functional impairment caused by intermittent claudication, its natural
history, in terms of the risk of disease progression with respect to disability and eventual limb loss (McCombs and Subramanian, 2002) in the affected limb is relatively benign (Nehler and Hiatt, 1999b). Patients with PAD can often remain at the same level of walking impairment for years if not offered specific treatments (Regensteiner and Hiatt, 1995). Intermittent claudication can, however, progress in five different ways; i)
improvement, ii) stabilisation, iii) worsening of the disease, but with no
revascularisation required, iv) worsening of the disease with revascularisation required, and v) a requirement for amputation, usually after disease progression (Aquino et al
or remain stable (Gardner et al 2004b), particularly those who stop smoking and persevere with walking (Whyman and Ruckley, 1998). If patients with claudication ignore the symptoms, a gradual process of decline usually occurs (Beebe, 2001). It has been estimated that 30% to 40% of patients will experience a symptomatic and/or objective deterioration over time, as measured by the ankle to brachial pressure index
(ABPI) (Aquino et al. 2001), with approximately 25% of patients experiencing a
deterioration in symptoms over five years (Bloor, 1961; Jelnes et al 1986).
Rest pain is indicative of critical limb ischaemia (Creager, 2001), and further
deterioration could result in limb loss (Hiatt and Nehler, 2001). The cumulative 10-year risk of developing ischaemic rest pain and ischaemic ulceration is reported to be 23% and 30%, respectively (Aquino et al 2001). Studies during the last 40 years suggest that only about a quarter of patients with intermittent claudication will develop critical limb ischaemia, and this deterioration typically occurs during the first year after
diagnosis (Aquino et al 2001). The yearly incidence of amputation is low and reported
to be between 1.4% (McCombs and Subramanian, 2002) and 5% (McDaniel and Cronenwett, 1989).
1.1.2 Associated diseases and mortality
Patients with PAD are more likely to report exertional leg symptoms, and
musculoskeletal disease than non-PAD patients (McDermott et al 2002a). Population
studies of PAD confirm that older adults with PAD are disabled (Newman, 2000). Interestingly, despite the major impact on physical exercise performance, the emotional state and mental health of patients with intermittent claudication has been reported to be
relatively normal compared with age-matched healthy controls (Regensteiner et al
1996). However, some patients can feel very negative about their health and their future, and this can lead to unemployment, social isolation and depression (Binnie et al 1999).
Although the prognosis for the claudicating limb is reasonably good (Tisi and Shearman, 1998; Stewart and Lamont, 2001), PAD can be thought of as a marker of advanced systemic atherosclerosis (Beebe, 2001; Newman, 2000), since its
classed as being at a high risk of sustaining such a systemic ischaemic event (Hiatt and Nehler, 2001) and compared with aged-matched controls, patients with intermittent claudication exhibit excess cardiovascular morbidity and mortality rates (Tisi and Shearman, 1998; Stewart and Lamont, 2001).
Population studies confirm that patients with PAD have a high risk of total mortality (Newman, 2000). Epidemiological studies have shown there to be a two to three fold increase in cardiovascular disease (CVD) morbidity and mortality in patients with PAD (Newman, 2000). Mortality has been reported to be 60% over 10 years (Hiatt, 1997a), with most of these deaths resulting from MI, stroke (Regensteiner and Hiatt, 2002b) and other cardiovascular events (Creager, 2001). A four-fold increase in the overall
mortality rate among patients with large vessel PAD, as diagnosed by non-invasive testing, and a 15-fold increase in rates of mortality due to CVD and CHD among patients with large-vessel PAD which was both severe and symptomatic has been reported (Criqui et al 1992). The risk of CVD and mortality in patients with PAD is similar to those with a history of MI or stroke, therefore it has been suggested that patients with PAD should be subjected to the same measures as those recommended for secondary prevention in MI and stroke survivors (Newman, 2000).
Intermittent claudication is therefore an important clinical predictor of increased cardiovascular mortality (Boccalon, 1999). Lower ABPI, older age, stroke, and diabetes-requiring medication have been reported to be the four key predictive risk factors for mortality in claudicants (Aquino et al 2001). Cardiovascular mortality correlates inversely with ABPI, and the risk of death is greatest in those patients with most severe PAD (Creager, 2001). Prompt diagnosis and management of the condition are crucial (Olin, 2002), and it is recommended that patients with PAD receive anti platelet therapy in order to prevent ischaemic events (Regensteiner and Hiatt, 2002b).
1.1.3 Diagnosis o f intermittent claudication
PAD is probably the most under-diagnosed and least aggressively managed
aorto-iliac occlusive arteriosclerosis produces pain in the hip, buttocks or thigh, whereas pain associated with more distal femoropopliteal occlusive lesions typically occurs in the muscles of the calf (Beebe, 2001). Non-invasive approaches to locate lesions include magnetic resonance angiography, duplex scanning and haemodynamic localisation (Gey
et al. 2004).
The diagnosis of intermittent claudication is based on patient history and physical examination. Although these are extremely important, they may prove to be of limited value due to the lack of consistent sensitivity and specificity (Mohler, 2003). The arterial physical examination includes pulse evaluation and careful inspection of the leg. The most important predictor of clinical outcome has been reported to be the severity of objectively determined arterial occlusive disease on initial evaluation (Aquino et al.
2001).
Diagnosis is usually confirmed by assessing the ABPI (Santilli et al. 1996). In addition, occlusive lesions can be further localised by taking pressure measurements in the upper and lower thigh and calf (Doppler segmental limb pressures) (Hiatt and Nehler, 2001). Thigh pressures are decreased in patients with iliac occlusive disease, whereas patients with disease more distal in the leg may exhibit a normal thigh pressure, but decreased calf and ankle pressures (Hiatt and Nehler, 2001).
1.1.3.1 Ankle to Brachial Pressure Index (ABPI)
The ABPI provides important information regarding the diagnosis and prognosis of PAD (Hiatt and Nehler, 2001). Serial measurements of Doppler ankle pressures have been used extensively to quantify haemodynamic improvements produced by arterial reconstruction and exercise rehabilitation, and to determine the progression of occlusive disease (Baker and Dix, 1981). Screening based on ABPI using Doppler
ultrasonography may be more useful than physical examination alone (Gey et al. 2004).
ABPI is a simple, non-invasive and reliable approach for the measurement of impaired lower-extremity perfusion (McDermott et al. 2002b). The ABPI is the ratio of ankle (dorsalis pedis and posterior tibial arteries) to upper arm (brachial artery) systolic blood pressure, and it is determined using a standard blood pressure cuff and a simple,
continuous wave Doppler ultrasound instrument (Beebe, 2001). The resting ABPI in
most patients who experience intermittent claudication is reduced (Amirhamzeh et al.
1997). An ABPI of less than 0.90 is 95% sensitive and 99% specific for PAD (Olin, 1998) and supports the diagnosis of peripheral arterial insufficiency (Amirhamzeh et al.
1997). However, multiple baseline determinations should be obtained on patients studied longitudinally (Baker and Dix, 1981).
ABPI is calculated by dividing the ankle systolic pressure in each lower extremity by the brachial systolic pressure (McDermott et al. 1998b). Conflicting arguments exist regarding the use of dorsalis pedis or posterior tibial artery pressures. It is important to note that the dorsalis pedis artery may not be palpable in 5% of normal individuals (Beebe, 2001). Previously the highest arm pressure (Baker and Dix, 1981) and the higher of either the posterior tibial or dorsalis pedis systolic pressures in the more
severely diseased leg (Izquierdo-Porrera et al. 2000) have been recommended for
calculation of ABPI.
More recently the association between ABPI and lower-extremity function has been found to be strongest when ABPI is calculated by averaging the values from the dorsalis pedis and posterior tibial arteries (McDermott et al. 2000). The brachial arterial
1.1.3.2 ABPI interpretation
Table 1. ABPI interpretation (Treat-Jacobson and Walsh, 2003).
ABPI Diagnosis
Above 0.90 Normal
0.71-0.90 Mild Obstruction
0.41-0.70 Moderate Obstruction
0.00-0.40 Severe Obstruction
ABPI values between 0.41 and 0.90 represent mild to moderate PAD, and values of 0.40 or less are consistent with critical leg ischaemia (Hiatt and Nehler, 2001). On the basis of long-term follow-up of 1,244 patients with intermittent claudication having a
mean ABPI of 0.78, the average yearly decline in ABPI is 0.014 (Aquino et al 2001).
ABPI has been reported to be highly correlated with lower-extremity functional
measures (McDermott et al. 2002b). The ankle systolic pressure correlates closely with direct intra-arterial pressure recordings, except at extremes of very high (0.8) or very low (< 0.4) ABPI (Beebe, 2001). It is well correlated with disease severity and can be used to assess disease progression and predict cardiovascular and cerebrovascular mortality (Mohler, 2003). However, ABPI has not shown a good correlation with
walking performance in some studies (Beebe, 2001; Leder et al 2002).
An accurate ankle pressure may not always be obtained (Hiatt and Nehler, 2001), especially in patients with long standing diabetes (Beebe, 2001). Patients with diabetes mellitus or end-stage renal disease might have calcified tibial vessels (Hiatt and Nehler, 2001). With incompressible vessels (Blackburn and Peterson-Kennedy, 1994), pressures can be artificially increased (McDermott et al 2002b) and the clinical status
consequently appears to be better than it really is (Beebe, 2001). The pressure in these calcified arteries is much greater than in the arm (> 200-250 mm Hg), leading to an ABPI value of greater than 1.30 (Hiatt and Nehler, 2001). However, other reports have
found that mean ABPI is similar in PAD patients with and without diabetes (Dolan et
al 2002).
Approximately 5% of patients with PAD have a normal ABPI (McDermott et al
waveform evaluation of the lower-extremity arteries and an exercise test on a treadmill
to evaluate post-exercise ABPI (McDermott et al 2002b). A significant decrease in
post-exercise ABPI confirms the diagnosis of PAD (Hiatt and Nehler, 2001). With exercise testing it must change by at least 0.15 before it can be considered significant (Baker and Dix, 1981).
1.2 Assessment of functional status
1.2.1 Introduction
Improving walking ability is the primary goal of treating intermittent claudication. The condition is associated with a significant deterioration in functional capacity on exertion (Askew et al 2002). The limitation in exercise capacity reduces a patient’s level of everyday physical activity (Barletta et al 1996). Determination of peak VO2 is
considered to be important for assessing a patient’s functional capacity (Womack et al
1998) and is a common physiological variable measured during exercise testing, since its measurement helps to further define the extent of exercise intolerance and sheds light on the underlying causes (Askew et al 2002).
The assessment of both walking ability (Regensteiner et al 1990) and functional status in patients with intermittent claudication in the laboratory and community settings are important, so that the relative efficacies of the various treatments can be judged (Regensteiner, 1997). Quality of life should also be assessed, in order to ascertain the benefit of a given treatment for patients with PAD (Regensteiner, 2004). Treadmill protocols and questionnaire assessments are typically used (Regensteiner et al 1997a), since both provide a high degree of precision and accuracy, and are practical and reproducible (Regensteiner and Hiatt, 1995).
1.2.2 Objective assessment o f walking performance 1.2.2.1 Claudication and maximum walking distance
The primary measure of disability in patients with intermittent claudication is walking distance (Watson and Collin, 1998). The arterial insufficiency to the extremities due to the condition results in a mismatch of oxygen supply and demand to the working
muscles, causing ischaemic pain (Askew et al. 2002). Both claudication distance (CD,
improve the symptomatic status of patients with claudication will typically result in an increase in CD as well as MWD (Hiatt and Nehler, 2001). Determination of both CD and MWD is part of a routine programme in the angiological examination of patients with PAD (Muller-Buhl et al. 1999).
A prerequisite for any test that is used to quantify walking capacity in this patient group is that it displays acceptable test-retest reliability (Labs et al. 1998), as defined in terms of the coefficient of variation and intraclass and Pearson product moment correlation coefficients of repeated tests, and that there is no significant difference in the readings obtained from repeated tests. Most treadmill studies have reported coefficients of
variation for CD and MWD in the range of 15 - 40% (Cachovan et al. 1999; Gardner et
al. 1991; Labs et al. 1999b; Labs et al. 1998; Perakyla et al. 1998). The variability of test-retest reliability coefficients reported from treadmill studies can probably be
explained by differences in the testing protocols used and/or the way in which the test was administered, as well as the level of prior patient familiarisation and characteristics of the sample population (Zwierska et al. 2004).
The quantification of CD is the main outcome measure for clinical trials (Labs et al.
1998), since the daily activities of patients with PAD are typically governed by the onset of symptoms and not maximally tolerated discomfort (Mohler III et al. 2003). It has therefore been suggested that CD should receive greater attention than MWD in
everyday clinical practice (Muller-Buhl et al. 1999). However, MWD has been found
to correlate in a better way than CD with the objective and subjective assessment criteria of PAD (Muller-Buhl et al. 1999), since patients’ own estimations of their CD are very subjective and in many cases unreliable (Nasr et al. 2002). MWD rather than the CD therefore appears to be the most reliable (Chaudhry et al. 1997) and important criteria by which to assess these patients (Muller-Buhl et al. 1999). The assessment of walking ability is not only an objective measure of the effectiveness of therapy, but it is also a valuable tool for motivating and providing feedback to the patient (Binnie et al.
1999).
1.2.2.2 Treadmill tests o f walking performance
Walking is the most common mode of assessment of intermittent claudication (Askew
that is associated with severe limitations in physical functioning and ambulatory activity in the community (Regensteiner et al 1996). It is widely believed that treadmill testing is the gold standard means of assessment, since exercise performance can be
characterised and changes due to an intervention assessed (Regensteiner et al 1990). A change in treadmill performance in response to therapy is the most commonly used endpoint in clinical claudication trials (Nasr et al 2002). Typically, a 25% to 50% increase in treadmill performance is considered to be of clinical significance (Hiatt et al
1995a; Hiatt, 1999).
There are two internationally accepted treadmill protocols, namely the constant- workload protocol, which uses a constant speed and grade (mostly 2mph or S^km.h'1 and 12% grade) and the graded (incremental) test, in which the speed is kept constant, but the gradient is varied. This test begins on the horizontal, after which the incline increases in pre-defined increments (e.g. 2%) at pre-defined intervals (e.g. 2 minutes) (Labs et al 1999a).
The time or distance to the onset of claudication pain and maximal walking time or distance are recorded during an assessment (Nehler and Hiatt, 1999b). ABPI, blood pressure and heart rate can also be determined immediately after treadmill testing, while patients rest in the supine position on an examination table in close proximity to the treadmill (Montgomery and Gardner, 1998). The constant-load treadmill test and the graded-exercise treadmill tests show similar reproducibility (Cachovan, 1997). Constant-pace tests are generally easier to administer and do not require a
programmable treadmill. In addition, there is a larger historical database derived from constant-pace tests, as many of the earlier published studies have used such protocols.
However, incremental (graded) protocols have the advantage that they can be used to assess walking performance in more heterogeneous patient populations with wide- ranging walking abilities (Hiatt et al., 1995; Regensteiner and Hiatt 1995). In addition, incremental protocols are likely to be more useful for re-assessing patients after a treatment intervention (in which an improvement is expected), as they do not exhibit the
However, there is some evidence that constant-pace tests exhibit superior
reproducibility for those patients with MWD in the range 50 - 150 m (Cachovan, 1997).
1.2.2.3 Alternative testing modalities
There are well documented limitations associated with treadmill testing, in that CD measured during a maximal graded exercise test may not accurately reflect the effect of claudication on everyday physical activities (Montgomery and Gardner, 1998).
Furthermore, treadmill testing does not measure the effects of an intervention on the patient’s perceived ability to walk or carry out activities in the community setting
(Regensteiner et al. 1996). The test is costly and time-consuming (Montgomery and
Gardner, 1998), since treadmills are expensive and require the presence of trained personnel (Cameron et al. 1997). Treadmill testing might not be available, practical or feasible in all clinical and rehabilitation settings e.g. vascular screening clinics, nursing homes, and retirement communities (Montgomery and Gardner, 1998). As a
consequence, treadmill testing can be impractical in large epidemiologic studies or primary care settings (Regensteiner et al. 1990). Some elderly patients might also find treadmill assessments stressful (Amirhamzeh et al. 1997) or impossible to perform due to restricting factors other than claudication pain (Perakyla et al. 1999).
In addition to these potential problems, patients with claudication rarely need to walk at the intensity attained during a maximal, graded treadmill test (Gardner et al. 2001). Therefore, walking capacity assessed via incline treadmill testing might not accurately reflect the influence of claudication on everyday functional ability (Montgomery and Gardner, 1998; Coughlin et al. 2001), particularly walking ability on level ground in the non-laboratory setting (Regensteiner et al. 1990). Neither does treadmill testing directly assess a patient’s perception of functional impairment, nor whether therapy has resulted in benefit (Nasr et al. 2002; Regensteiner et al. 1996).
haemodynamic severity of PAD in patients with intermittent claudication, when compared with a graded treadmill protocol (Montgomery and Gardner, 1998).
Some studies have shown walking performance to improve significantly between the first and second test during the six-minute walk test, but not between the second and third test (Bauman and Arthur, 1997). These findings indicate that, as with treadmill testing, familiarisation is essential prior to data collection during this type of testing. However, in contrast, other studies (Montgomery and Gardner, 1998) have found no significant change between the first and second test, suggesting that accurate results can be obtained in patients with intermittent claudication following only one 6-minute walk test. Compared with the standard graded exercise test, the 6-minute walk test is easy to administer, requires less time, is less expensive, is better tolerated by patients and provides a better approximation of walking ability typically encountered during
activities of daily living (Montgomery and Gardner, 1998). However, the 6-minute walk test does have a few disadvantages, in that a walking test that is performed in a 100-foot corridor logistically prevents immediate post-exercise measurements from being
obtained because patients are far from an examination table upon test completion (Montgomery and Gardner, 1998). Personnel who administer the test must be trained to provide the same instructions to all patients (Montgomery and Gardner, 1998).
Furthermore, the 6-minute walk test may not be as accurate in evaluating ambulatory function in patients who have asymptomatic PAD (Fontaine Stage I), because of a ceiling effect, and in patients with rest pain (Fontaine Stage III) or tissue loss (Fontaine Stage IV), because of a floor effect (Montgomery and Gardner, 1998).
Other alternatives to treadmill testing include cycling. However, currently cycling has little place in the assessment of intermittent claudication or prescription of exercise, which might in some respect be due to the lack of data on the physiological responses to cycling in intermittent claudication that are required to help determine or predict its effectiveness, relative to walking as a mode of exercise assessment or prescription (Askew et al. 2002).
between two cones placed a set distance apart on flat ground at a pace which is controlled by audio-tape bleeps. Walking speed is increased incrementally - this
gradually stresses the cardio-respiratory system to a symptom-limited maximum (Singh
et al. 1992) and potentially makes it safer for patients with cardiac and respiratory conditions.
Figure 1. Patient undertaking a shuttle-walk test
The shuttle-walk test has recently been evaluated in patients with intermittent
claudication, with respect to test-retest reliability, cardiovascular responses and patient preferences (Zwierska et al. 2004). The test exhibited similar test-retest reliability as an internationally accepted treadmill protocol (Labs et al. 1999a), but evoked lower levels of cardiovascular stress. Furthermore, compared to the graded treadmill protocol, the incremental shuttle-walk test was the preferred method of assessing walking ability by a large proportion of patients who expressed a definite opinion (Zwierska et al. 2004).
1.2.3 Questionnaires used to evaluate functional status 1.2.3.1 Introduction
(Regensteiner and Hiatt, 1995). Certain well-established questionnaires assess walking capacity (Nehler and Hiatt, 1999b) and provide patient-based information on
claudication severity and response to therapy (Hiatt, 1997b). Questionnaires that evaluate functional status may play an important role in describing the benefits of interventions in patients with PAD (Regensteiner et al 1996; Regensteiner and Hiatt, 1995). To evaluate their validity, questionnaire responses have been correlated to objective measures of walking performance and have been shown to have a high degree of precision and accuracy, and to be practical and reproducible (Regensteiner and Hiatt, 1995).
It is important that a questionnaire is easy to administer and evaluate (Regensteiner and Hiatt, 1995) and in the case of patients with intermittent claudication the most important criterion for the quality of life is functional disability (Muller-Buhl et al 2003). The condition impairs patient’s general health, and patients exhibit low scores for physical, social and emotional function (Barletta et al 1996). The expected gain in quality of life should therefore be a crucial factor in the choice of treatment for patients with
intermittent claudication (de Vries et al 2002). Three such questionnaires that are used to evaluate disease-specific functional status/quality of life, generic health related quality of life and physical activity status are the Walking Impairment Questionnaire (WIQ), the Medical Outcomes Study SF-36 questionnaire and the PAD-Physical
Activity Recall (PAD-PAR) questionnaire, respectively (Regensteiner et al 1997a).
These questionnaires have been used to quantify improvements in a patient’s ability to walk distances and speeds, in the amount of habitual physical activity and in physical functioning after treatment interventions (Regensteiner et al 1997a). The overall impact of a treatment intervention on health status (Hiatt, 1997b) and the overall impact on claudication can be described (Hiatt, 1999). Activity monitors that evaluate
functional status can be used in conjunction with questionnaires to more fully describe the benefits of interventions in patients with PAD (Regensteiner et al 1996). The information derived from such questionnaires thus provides a valuable adjunct to laboratory-based measures (Regensteiner and Hiatt, 1995).
1.2.3.2 Walking Impairment Questionnaire (WIQ)
The Walking Impairment Questionnaire (WIQ, Appendix 15) was developed and validated specifically for patients with intermittent claudication by Regensteiner et al.
1995a) which quantifies patients’ self-reported claudication severity, the ability to walk defined distances, speeds and climb stairs (Regensteiner and Hiatt, 1995). It also
characterises the symptoms that limit walking ability in patients with PAD
(Regensteiner et al. 1990; Regensteiner et al. 1996) through a series of questions (Hiatt
et al. 1995a).
The WIQ is simple to administer (Hiatt, 1999) and has been validated for detecting changes in walking impairment due to interventions in patients with intermittent claudication (Regensteiner et al. 1990). A treadmill test cannot fully evaluate whether an intervention alters a patient’s perceived ability to walk in the community or non laboratory setting, and might not therefore characterise a patients functional ability (Regensteiner et al. 1990). In the WIQ, patients rank their ability to walk specific distances on a 0-4 Likert scale.
The WIQ responses are stable when repeated over time in control patients (Hiatt et al.
1995b). The WIQ has been validated by comparison with treadmill walking, peripheral bypass and angioplasty in patients with PAD (Regensteiner et al. 1990; Regensteiner et al. 1993a). Changes in walking ability with exercise training have also been evaluated (Hiatt et al. 1990; Regensteiner et al. 1990). Modest correlations (r = 0.68) between the WIQ questionnaire and peak treadmill walking time have previously been reported (Regensteiner et al. 1990). Following a 3-month randomised controlled trial of exercise conditioning or post-surgery, the WIQ has identified improvements in the walking distance and speed domains, which were corroborated by treadmill performance (Regensteiner et al. 1990). An advantage of this questionnaire is that it can be administered and scored in 6-8 minutes (Regensteiner and Hiatt, 1995).
1.2.3.3 Physical activity recall (PAD-PAR) questionnaire
Physical activity status is an important variable to measure in PAD, given the link between inactivity and cardiovascular disease morbidity and mortality (Sieminski et al.
1997). The PAD-Physical Activity Recall (PAD-PAR; Appendix 18) has been
condition limits the number and amount of activities of daily living that can be performed by patients (Sieminski et al. 1997).
The PAD-PAR provides a global measure of habitual physical activity levels. Patients evaluate time spent over the previous week performing work activities, household tasks/yard work and leisure activities (Otis et al. 2000; Hiatt et al 1995b; Sallis et al
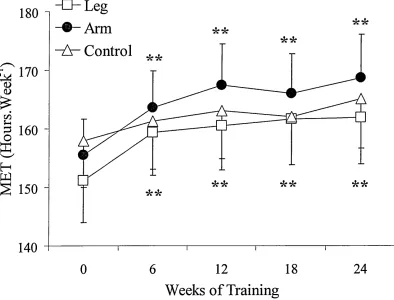
1985), classified as heavy, moderate, light and very light on the basis of metabolic equivalents (METs). One MET is equivalent to a resting VOi of 3.5ml.kg'1.min'1. Global physical activity status is obtained by estimating the total energy expenditure by summing the number of hours of physical activity per week in each of the four
categories, which is recorded in MET hours per week (MET-h.wk'1: hours per week multiplied by the MET value of the activity). Although the PAD-PAR must be
administered by an interviewer, typically it can be administered and scored in less than 12 min (Regensteiner and Hiatt, 1995).
1.2.3.4 Quality o f life assessment - the Medical Outcomes Study SF-36 v2
Intermittent claudication has detrimental effects on quality of life (Oka et al. 2003; Treat-Jacobson and Walsh, 2003). Patients are limited in their capacity to exercise and this consequently reduces their level of everyday physical activity (Barletta et al. 1996)
and functioning (Taft et al. 2001). The Medical Outcomes Short Form-36 (MOS SF-36
v2; Appendix 13) (Ware and Sherboume, 1992) is a self-administered health-related
quality of life questionnaire that is easy to score (Regensteiner and Hiatt, 1995). The SF-36 assesses multiple aspects of normal life function (Hiatt et al. 1995b). It is a non disease specific questionnaire (Hiatt and Nehler, 2001) and is a reliable and valid generic instrument which includes multi-item scales that assess two components of health, namely physical and mental (Gardner et al. 2001). More precisely, physical function and general health and well-being perceptions, as well as limitations due to
mental health, social function and vitality (Ware and Sherboume, 1992; McHomey et
al. 1993; Regensteiner et al. 1997a; Regensteiner, 1997; Tarlov et al. 1989; Gardner
et al. 2001; Stewart et al. 1989). Each domain of the SF-36 is scored from 0 (poorest health) to 100 (optimal health; Table 2).
PAD report profound limitations in all domains of quality of life which are related to their reduced physical health (Dumville et al 2004). The scores from these domains are generally worse than those given by patients with chronic pulmonary disease and
moderate to severe heart failure (Oka et al 2003). Patients frequently report a significant impairment in their general health and lower scores for physical function (Barletta et al 1996; Bauman and Arthur, 1997).
The effect of intermittent claudication on social and emotional function i