ISSN Online: 2169-3412 ISSN Print: 2169-3404
DOI: 10.4236/ojacct.2018.74013 Oct. 26, 2018 191 Open Journal of Accounting
What Causes Non-Performing Loans? The Case
of Greece Using Primary Accounting Data
Vasilios Giannopoulos
Department of Business Administration, University of Patras, University Campus, Rio-Patras, Greece
Abstract
In this paper we study the effect of independent variables in identifying non-performing loans during crisis period, using a binomial logistic regres-sion. We use a unique data of 2591 loans granted by one of the four systemic banks of Greece in 2005. Specifically we study a sample of loans granted to micro and small enterprises in order to cover working capital needs. Νon-performing loans dramatically increased as the recession of Greek economy deepens. Moreover we prove that in general the variables still affect in the same way the creation of non-performing loans during the studied pe-riod. Particularly, binomial logistic regression shows a positive correlation between non-performing loans and factors “Adverse”, “Age” and “LTT”. In contrast, we find a negative correlation between the probability of classifying a loan as non-performing and the independent variables “Collateral”, “Own Facilities”, “Property”, “Residence” and “Years of operation”. Finally the pre-dicted performance of the binomial logistic regression reduced as the crisis deepens.
Keywords
Banks, Non-Performing Loans, Micro and Small Enterprises, Credit Scoring, Binomial Logistic Regression, Economic Crisis
1. Introduction
Financial institutions play an important financial intermediation role in the economy: the development of the financial sector influences the level of the economy’s development. According to the Basel Committee on Banking Super-vision, Bank of International Settlements (2000) defined the credit risk as the potential risk that a bank borrower or counterparty will fail to its obligations in accordance with agreed terms. Credit risk induces financial distress on banks, How to cite this paper: Giannopoulos, V.
(2018) What Causes Non-Performing Loans? The Case of Greece Using Primary Ac-counting Data. Open Journal of Account-ing, 7, 191-206.
https://doi.org/10.4236/ojacct.2018.74013
Received: September 22, 2018 Accepted: October 23, 2018 Published: October 26, 2018
Copyright © 2018 by author and Scientific Research Publishing Inc. This work is licensed under the Creative Commons Attribution International License (CC BY 4.0).
DOI: 10.4236/ojacct.2018.74013 192 Open Journal of Accounting and its assessment requires advanced modeling techniques that will link it to the sources of uncertainty generated. The control of non-performing loans is a vital priority and necessity for the proper operation of financial institutions. The ne-cessity of reduction of non-performing loans expressed supremely in the recent global financial crisis, which began in the US in 2006 and spread to the rest of the world—especially in European Union, where it evolved into a sovereign debt crisis. The main predictive credit scoring models are distinguished on statistical models (linear discriminant analysis, logistic regression analysis, multivariate adaptive regression splines, etc.) and artificial intelligent models (artificial neural networks, decision trees, case based reasoning, support vector machines, etc.). The purpose of this paper is to study the behavior of a sample of loans granted by one of four systemic banks in Greece in a period of growth (01-12/2005), during the recent financial crisis and the recession in the Greek economy (12/2010-12/2011). The Greek economy till 2008 showed positive growth rates but then sank into recession. So we use a dataset of loans granted during an ex-pansion period and study their behavior during the recession period.
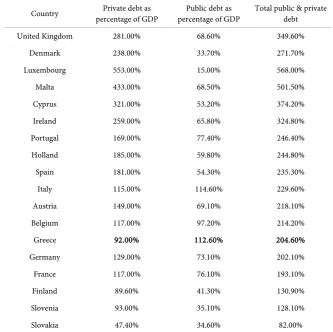
The sub-prime mortgage lending crisis, which took place in 2006, has shaken the financial stability of many developed countries. As expected, the transmitted financial crisis, received large dimensions, due to the fact that large credit insti-tutions was exposed in the so-called “junk bonds”. The financial crisis reached the threshold of Greece in the last quarter of 2008 (Aggelopoulos and Georgo-poulos, 2017 [1]). Especially in the case of Greece, the crisis was denatured ex-tensively to debt crisis and received great proportions due to the extremely high public debt, thereby plunging the economy into great recession. Unlike the pub-lic debt, private debt in Greece1 is lower than that of other European countries, as a result of, in general, conservative credit policies of the Greek banks (Table 1).
The paper exploits manually gathered individual-level loan application and loan performance data from 3294 SMEs loans that were granted in the expansion period (from January 2005 to December of 2005) by one of the four Greek sys-temic banks (i.e. the National Bank of Greece, Piraeus Bank, Alpha Bank and Eurobank), which as oligopolistic players exhibit a similar strategic behavior of-fering very comparable products. During the span of this study, the Greek banking sector has undergone several development phases with alternating time periods (Aggelopoulos and Georgopoulos, 2017): initially, an expansion period (2002-2007) with very high GDP growth levels, then an unstable period caused by the global financial crisis on September 2008, afterwards the Greek sovereign crisis on April 2010 which led to an accumulation of NPLs in the subsequent years (2010-2012) and finally the deep recession (2013-2016). In this turbulent environment, the analysis concentrates on the period 2010-2012 since NPLs in subsequent years increased to not-manageable levels due the vulnerable political scene that prevailed that period (so the incurred loan delays that period can be
DOI: 10.4236/ojacct.2018.74013 193 Open Journal of Accounting
Table 1. The public and private debt in Europe in 2009.
Country percentage of GDP Private debt as percentage of GDP Public debt as Total public & private debt
United Kingdom 281.00% 68.60% 349.60%
Denmark 238.00% 33.70% 271.70%
Luxembourg 553.00% 15.00% 568.00%
Malta 433.00% 68.50% 501.50%
Cyprus 321.00% 53.20% 374.20%
Ireland 259.00% 65.80% 324.80%
Portugal 169.00% 77.40% 246.40%
Holland 185.00% 59.80% 244.80%
Spain 181.00% 54.30% 235.30%
Italy 115.00% 114.60% 229.60%
Austria 149.00% 69.10% 218.10%
Belgium 117.00% 97.20% 214.20%
Greece 92.00% 112.60% 204.60%
Germany 129.00% 73.10% 202.10%
France 117.00% 76.10% 193.10%
Finland 89.60% 41.30% 130.90%
Slovenia 93.00% 35.10% 128.10%
Slovakia 47.40% 34.60% 82.00%
considered as mechanical). To sum up, the study explores the repayment beha-vior of the 3294 SMEs loans few years later after they were granted (2005) and throughout the early recession period from December 2010 to December 2011.
The main findings of our analysis show that in general the variables still affect in the same way the creation of non-performing loans. Using binomial logistic regression we prove a positive correlation between non-performing loans and factors “Adverse”, “Age” and “LTT”. In contrast, we find a negative correlation between the probability of classifying a loan as non-performing and the inde-pendent variables “Collateral”, “Own Facilities”, “Property”, “Residence” and “Years of operation”. Finally the predicted performance of the binomial logistic regression reduced as the crisis deepens. The rest of the paper is structured as follows. In Section 2 we provide a literature review for credit scoring models. In Section 3 we present the data and the employed variables. In Section 4 we dem-onstrate the research methodology followed by a presentation of the applicable credit scoring model. In Section 5 we provide the empirical results of this re-search, while Section 6 concludes the paper and discusses future research.
2. Literature Review
institu-DOI: 10.4236/ojacct.2018.74013 194 Open Journal of Accounting tions on credit risk. A good credit risk assessment method can help financial in-stitutions to grant loans to creditable applicants, thus increase profits; it can also deny credit for the non-creditable applicants, so decrease losses. The accuracy of credit scoring is critical to financial institutions profitability (Wang et al., 2012 [2]). Even 1% of improvement on the accuracy of recognizing applicants with bad credit will decrease a great loss for the financial institutions (Hand & Hen-ley, 1997 [3]). Accordingly, credit risk remains one of the major threats that fi-nancial institutions face, and it is essential to model the credit risk of fifi-nancial institutions. The Basel committee on Banking Supervision proposes a capital adequacy frame that allows banks to measure capital requirement for their banking books using internal assessments of key risk drivers. Thus, there is ne-cessity for systems to assess credit risk for banks (Lin, 2009 [4]).
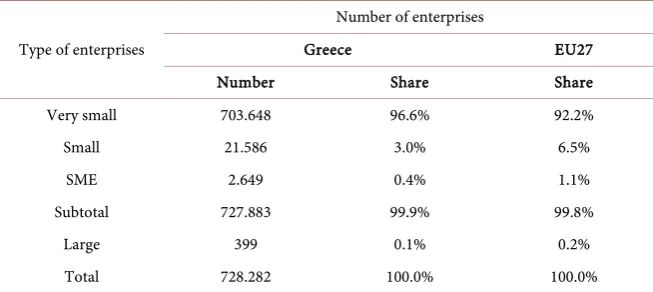
Credit scoring has four potential benefits in small business lending, namely, 1) reducing screening and monitoring costs of small business loans, 2) enhancing competition among banks in local markets, 3) adjusting lending interest rates commensurate with borrowers’ credit risks, and 4) increasing the availability of credit for risky marginal firms. Small businesses are widely viewed as the foun-tainhead of job creation and the engine of economic growth (Ono, 2014 [5]). Small and very small enterprises constitute 99.6% of all businesses operating in Greece, while the corresponding rate in the European Union amounts to 98.7%2 (Table 2).
[image:4.595.210.537.559.705.2]Lending to small business is beneficial to commercial banks because the mar-gins on small business lending are higher than on many other bank products (Petersen, Rajan, 1995 [6]; Tsaih et al., 2004 [7]). But it is difficult for bank to obtain detailed information from small firms since the financial reports of small firms are mainly for tax purposes (Bhattacharya, Thakor, 1993 [8]; Diamond, 1984 [9]). In addition, small firms are more subject to economic cycles, and they might be seriously affected by an economic downtown. The credit risk of small business alters because of the change of business environment. Hence, important features for small business lending are to reduce information asymmetry and to avoid the credit risk from lending to small firms (Tsaih et al., 2004 [7]).
Table 2. Enterprises’ distinction.
Type of enterprises
Number of enterprises
Greece EU27
Number Share Share
Very small 703.648 96.6% 92.2%
Small 21.586 3.0% 6.5%
SME 2.649 0.4% 1.1%
Subtotal 727.883 99.9% 99.8%
Large 399 0.1% 0.2%
Total 728.282 100.0% 100.0%
DOI: 10.4236/ojacct.2018.74013 195 Open Journal of Accounting Credit risk evaluation is a very important subject as it is a difficult task to pre-dict default probabilities and deduce risk classification. Basel II standard defines strict restrictions and auditing rules for credit risk evaluation process, thus banking activities are deeply impacted by proper risk system implementation (Danenas et al., 2011 [10]). In recent years, credit scoring has been become one of the primary ways for financial institutions to assess credit risk, improve cash flow, reduce possible risks and make managerial decision. The accuracy of credit scoring is critical to financial institutions’ profitability. Credit scoring was based on “Five Cs of Credit”, which is a method used by lenders to determine the cre-dit worthiness of potential borrowers. The system weighs five characteristics of the borrower, attempting to gauge the chance of default: the character of the consumer, the capital, the collateral, the capacity and the economic conditions. The goal of credit scoring models is to classify loan clients to either good credit or bad credit (Lee et al., 2002 [11]), predicting the bad payers (Lim & Sohn, 2007 [12]).
Many credit scoring techniques have been used to build credit scorecards. Two categories of automatic credit scoring techniques, i.e. statistical techniques and artificial intelligence techniques have been studied by prior studies (Wang et al., 2012 [2]). Some statistical techniques have been widely applied to build the credit scoring models, such as Linear Discriminant Analysis-Multivariate Dis-criminant Analysis (Altman et al., 1981 [13]; Altman & Saunders, 1998 [14]; Beaver, 1966 [15]; Karels & Prakash, 1987 [16]; Reichert et al., 1983 [17]), Logis-tic Regression Analysis—Logit and Probit models (Thomas 2000 [18]; Baesens et al., 2003 [19]; Lee & Chen, 2005 [20]; Desai et al., 1996 [21]; West, 2000 [22]; Gordy, 2000 [23]), Multivariate Adaptive Regression Splines (Friedman, 1991 [24]). Among them, logistic regression model is the most commonly used in the banking industry due to its desirable features (e.g. robustness and transparency) (Caouette et al., 1998 [25]; Desay et al., 1996 [21]; Hand & Henley, 1997 [3]; Louzada et al., 2012 [26]). The weakness of the linear discriminant analysis is the assumption of linear relationship between variables, which is usually non-linear and the sensitivity to the deviations from the multivariate normality assumption. The logistic regression analysis is predicting dichotomous outcomes and linear relationship between variables in the exponent of the logistic function, but does not require the multivariate normality assumption (Sustersic et al., 2007 [27]). Because of the linear relationship between variables both linear discriminant analysis and logistic regression analysis are reported to have a lack of accuracy (Thomas, 2000 [18]; West, 2000 [22]). On the other hand there are also studies showing that most of the consumer credit scoring data sets are only weakly non-linear and because of that linear discriminant analysis and logistic regres-sion analysis gave good performance (Beasens et al., 2003 [19]).
DOI: 10.4236/ojacct.2018.74013 196 Open Journal of Accounting 2009 [30]), Case Based Reasoning (Shin & Han, 2001 [31]) and Support Vector Machines (Schebesch & Stecking, 2005 [32]), can be used as alternative methods for credit scoring and show superior prediction accuracy. Among these the neural networks are very promising (Goonatilake & Treleaven, 1995 [33]) and the alternative to the linear discriminant analysis and logistic regression analysis, due to the possible complex non-linear relationship between variables. In the li-terature in most cases of credit scoring problems the neural networks are more accurate than linear discriminant analysis and logistic regression analysis (Desay et al., 1996 [21]; Lee et al., 2002 [11]; Piramuthu et al., 1999 [34]; Richeson et al., 1994 [35]; West, 2000 [22]). Although the use of these techniques has grown in recent years, they have problems with the results interpretability. These tech-niques have their weaknesses in their long training process and after obtaining the optimal network’s architecture, the model acts as a “black box” and there is not easy to identify the relative importance of potential input variables (Sustersic et al., 2007 [27]). The predictive quality of a credit scoring model can be eva-luated based on measures such as sensitivity, specificity, correlation coefficients and information measures, such as relative entropy and mutual information (Baldi et al., 2000 [36]). In fact, we cannot say that there is an overall best statis-tical technique used in building credit scoring models, so that the choice of a particular technique depends on the details of the problem, such as the data structure, the features used, the extent to which is possible to segregate the classes by using those features and the purpose of the classification (Hand & Henley, 1997 [3]).
3. The Data Set and the Employed Variables
The data set is collected manually from the internal Management Information System (MIS) of the bank under study and contains a very wide loan portfolio consisting of micro businesses and small enterprises as defined by the EU.3 The data set contained 2591 loan applications of micro and small enterprises spread across Greece granted in the late expansion period (2005). Specifically we study loans granted in order to cover working capital needs of the enterprises. The present study is based on a joint project between academic researchers with pre-vious professional banking experience and the top level lending management of the bank under investigation. This was carried out due to the necessity of identi-fying important drivers of credit risk related to borrowers’ characteristics and re-evaluating the existing internal credit scoring model of the bank under study during recession. In order to preserve the anonymity of the bank we could not give more details about the data sources.
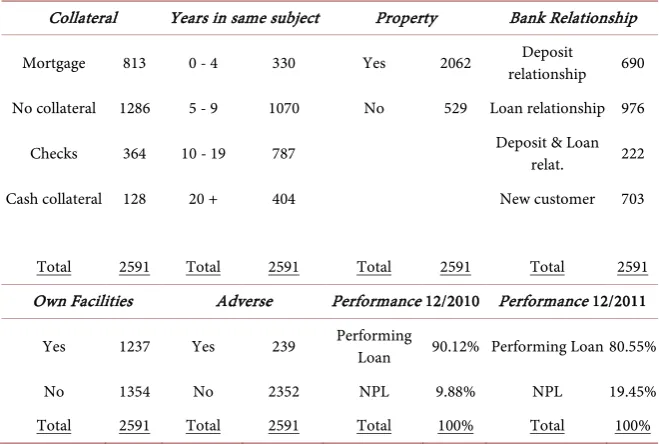
Table 3 presents the main descriptive statistics of the dataset. Almost 50% of the data are unsecured loans. Moreover 41.3% of loans were granted to busi-nesses operating for 5 - 9 years. Considering the bank relationship, 703 loans
3EU definitions for SMEs define a firm as micro if it has less than ten employees and an annual
DOI: 10.4236/ojacct.2018.74013 197 Open Journal of Accounting
Table 3. Descriptive Statistics.
Collateral Years in same subject Property Bank Relationship
Mortgage 813 0 - 4 330 Yes 2062 relationship Deposit 690
No collateral 1286 5 - 9 1070 No 529 Loan relationship 976
Checks 364 10 - 19 787 Deposit & Loan relat. 222
Cash collateral 128 20 + 404 New customer 703
Total 2591 Total 2591 Total 2591 Total 2591 Own Facilities Adverse Performance 12/2010 Performance 12/2011
Yes 1237 Yes 239 Performing Loan 90.12% Performing Loan 80.55%
No 1354 No 2352 NPL 9.88% NPL 19.45% Total 2591 Total 2591 Total 100% Total 100%
(27.1%) were granted to new customers. Regarding the performance of loans on December 2010, 90.12% were performed loans and 9.88% were NPLs. The per-centage of NPLs rise to 19.45% on December 2011.
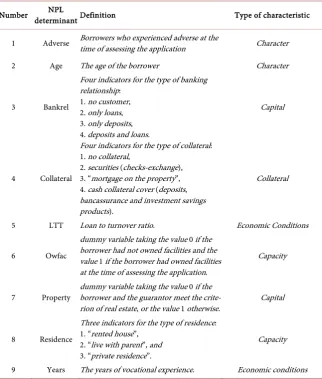
In our analysis, we set as a dependent variable the “performance of the loan” during the studied period. For the definition of a loan as non-performing, we use the basic rules of Basel I & II, where NPLs are those loans that are up to ninety days past due. As a time frame for the identification of the behavior of a NPL, empirical studies (Makri, et al. 2014 [37]; Louzis, et al. 2012 [38]) specify either the performance of loans in a specific month or the performance of loans during a specific period, usually 12 months. In our analysis we check the performance of loan on December 2010 and December 2011. As independent variables we use quantitative and qualitative loan characteristics derived from the loan applica-tion at the time of evaluaapplica-tion. In particular, qualitative informaapplica-tion (such as the age of the borrower, the type of the loan etc.) is significant in explaining a firm’s credit risk (Artavanis et al., 2016 [39]; Gupta et al., 2015 [40]) justified by the “Five Cs of Credit” and used by lenders for credit worthiness evaluation of po-tential borrowers. In our research analysis, we utilize the nine main characteris-tics of the credit scoring model used by the bank under study as independent va-riables (loan characteristics). Table 4 summarizes the definition of these inde-pendent variables.
4. Methodology
DOI: 10.4236/ojacct.2018.74013 198 Open Journal of Accounting
Table 4. The association of micro and small firms idiosyncratic features with the
forma-tion of NPL’s.
Number determinant Definition NPL Type of characteristic
1 Adverse Borrowers who experienced adverse at the time of assessing the application Character
2 Age The age of the borrower Character
3 Bankrel
Four indicators for the type of banking relationship:
1. no customer, 2. only loans, 3. only deposits, 4. deposits and loans.
Capital
4 Collateral
Four indicators for the type of collateral: 1. no collateral,
2. securities (checks-exchange), 3. “mortgage on the property”, 4. cash collateral cover (deposits, bancassurance and investment savings products).
Collateral
5 LTT Loan to turnover ratio. Economic Conditions
6 Owfac
dummy variable taking the value 0 if the borrower had not owned facilities and the value 1 if the borrower had owned facilities at the time of assessing the application.
Capacity
7 Property
dummy variable taking the value 0 if the borrower and the guarantor meet the
crite-rion of real estate, or the value 1 otherwise. Capital
8 Residence
Three indicators for the type of residence: 1. “rented house”,
2. “live with parent”, and 3. “private residence”.
Capacity
9 Years The years of vocational experience. Economic conditions
the logit of the probability of the event (Cramer, 2003 [44]). Logistic regression analysis is widely used statistical modeling technique in which the response va-riable, the outcome (non-performing loans), is binary (0, 1) and can thus be used to describe the relationship between the occurrence of an event or interest and a set of potential predictor variables. In the context of credit scoring, the outcome corresponds to the credit performance of a client during a given period of time, in our case 24 months. A set of individual characteristics, such as age, years of experience, residence status, as well as information about his credit behavior, such as relationship with the bank, purpose, are observed at the time the clients apply for the credit.
DOI: 10.4236/ojacct.2018.74013 199 Open Journal of Accounting
(
)
(
)
(
)
(
)
1 1 1 1 exp e1 exp 1 e
n k ik k n k ik k n x k ik k
i n x
k ik k x P x β β β β = = = = ∑ ∑ = = + +
∑
∑
(1)where
Pi = the probability of ith loan being non-performing βk= the coefficient of the kth independent variable xi= the kth independent variable of ith loan
The objective of the logistic regression model in credit scoring is to determine the conditional probability of a specific client belonging to a class, given the val-ues of the independent variables of that credit applicant (Lee & Chen, 2005 [20]).
Our binomial logistic regression is as follows:
( )
(
)
(
)
(
)
(
)
(
)
(
)
(
)
(
)
(
)
log 0 1 log 2 log 3 log
4 log 5 log 6 log
7 log 8 log 9 log
Yi ADVESE AGE BANKREL
COLLATERAL LTT OWFAC
PROPERTY RESIDENCE YEARS
β β β β
β β β
β β β
= + ∗ + ∗ + ∗
+ ∗ + ∗ + ∗
+ ∗ + ∗ + ∗
(2)
We utilize as dependent variable the performance of loans successively at two specific time points: December 2010 and December 2011. Specifically the de-pendent variable is a binary variable that takes the value 0 for performing loans and the value 1 for non-performing loans. Regarding the independent variables, “ADVERSE” is a dummy variable taking the value 1 for borrowers who had al-ready experienced adverse at the time of assessing the application, or the value 0 otherwise. The variable “AGE” shows the age of the borrower or the age of the business’s owner. The variable “BANKREL” is a categorical variable which shows the relationship between the borrower and the bank. We set four indica-tors for the type of banking relationship: 1) Borrowers who have no collabora-tion with the bank before granting the loan (no customer), 2) Borrowers who have already granted loan from the bank and they apply for a new loan, 3) Bor-rowers who have more than 5.000€ in deposits accounts, 4) BorBor-rowers who al-ready have both deposit and loan collaboration. The “LTT” variable shows the Loan to Turnover Ratio, which measure the percentage of the loan as compared to the turnover of the business. The variable “OWFAC” is a dummy variable that takes the value 1 if the borrower operates in privately owned facilities or the val-ue 0 otherwise. The variable “PROPERTY” is a dummy variable that takes the value 1 if the borrower is owner of property free of liabilities, or the value 0 oth-erwise. The variable “RESIDENCE” is a categorical variable that shows the resi-dence status of the borrower. We set three indicators for the type of resiresi-dence: 1) Borrowers who live in a rented house, 2) Borrowers who live with their parents and 3) Borrowers who have a private residence. Finally the variable “YEARS” shows the years of operation of the business.
5. Empirical Study
DOI: 10.4236/ojacct.2018.74013 200 Open Journal of Accounting well as the relative influence of each factor in the creation of non-performing loans during the early recession of the Greek economy (December 2010, De-cember 2011). Below, using the binomial logistic regression, we tried to identify the effects of the independent variables in the determination of non-performing loans as well as to track changes in the effects of variables as the recession of the Greek economy deepens.
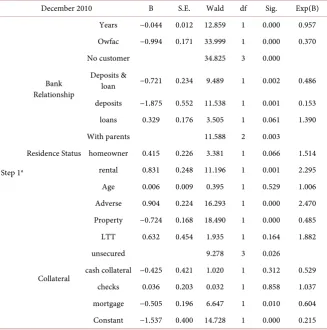
Table 5 shows that the effect of the independent variables on December 2010. We note that the variables associated with the welfare of borrowers (existence of own facilities, existence of sufficient property free of liabilities, existence of home ownership) as well as years of operation of borrower’s business, have a negative effect on the formation of non-performing loans. More specifically, the more years a company operates, the less the likelihood that the customer does not properly pay the loan installments. Factors positively associated with the finan-cial standing of customers are the existence of sufficient property, the existence of privately owned facilities and the existence of home ownership. The analysis confirmed that customers having sufficient property free of liabilities are less likely to develop non-performing loans. Additionally, customers who have owned facilities also have less chance of a disorderly debt service than those who maintain rented facilities. Finally, customer staying in private residence are less likely not to serve their loans than those living in rented house.
On the other side the factor of the borrower’s age is positively correlated with the probability of classifying a loan as non-performing. The older the borrower, the higher the probability of the loan to be classified as bad. Similarly, borrowers who had experienced adverse elements before granting the loan, are more likely not to pay their loan obligations. Regarding the factor “loan amount to compa-ny’s turnover ratio”, there is a positive correlation with the probability of the loan to be classified as non-performing. Regarding the factor of previous colla-boration between the client and the bank, we observe that customers without a pre-existing deposit collaboration with the bank behave better than those who retained only loan collaboration or they have no collaboration with the bank. Regarding the factor of the collateral of the loan, we observe that, compared to the loans covered only by personal guarantees, loans secured by cash collateral or mortgage on property adversely affect the formation of non-performing loans. On the other hand loans secured by pledging of customer checks noted positive effect on the determination of non-performing loans.
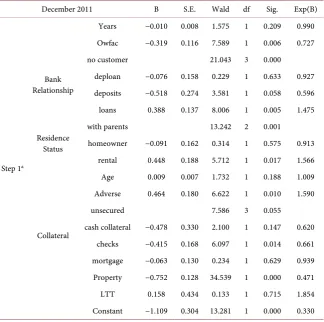
DOI: 10.4236/ojacct.2018.74013 201 Open Journal of Accounting before granting the loan are more likely to be characterized as bad borrowers. Regarding the factor “loan amount to company’s turnover ratio”, there is a posi-tive correlation with the probability of the loan to be classified as non-performing. Regarding the factor of previous collaboration between the client and the bank, we observe that customers without a pre-existing deposit collaboration with the bank behave better than those who have no collaboration with the bank. Customers who retained only loan collaboration have the worst performance. Concerning the collateral of the loan, we find that setting as base category loans without collaterals, all the other categories performed better. Loans covered by cash collateral have the strongest negative effect on the forma-tion of non-performing loans, followed by loans covered by clients’ checks.
[image:11.595.210.538.371.702.2]Table 7 shows the average accuracy and the estimated misclassification cost of the binomial logistic regression both on December 2010 and December 2011. We find that the predicted performance of the binomial logistic regression re-duced as the recession deepens. Specifically the average accuracy rere-duced from 90.8% (December 2010) to 81.5% (December 2011). On the other hand the esti-mated misclassification cost increased from 0.0452 (December 2010) to 0.157 (December 2011).
Table 5. Binomial logistic regression—December 2010.
December 2010 B S.E. Wald df Sig. Exp(B)
Step 1a
Years −0.044 0.012 12.859 1 0.000 0.957 Owfac −0.994 0.171 33.999 1 0.000 0.370
Bank Relationship
No customer 34.825 3 0.000 Deposits &
loan −0.721 0.234 9.489 1 0.002 0.486 deposits −1.875 0.552 11.538 1 0.001 0.153 loans 0.329 0.176 3.505 1 0.061 1.390
Residence Status
With parents 11.588 2 0.003
homeowner 0.415 0.226 3.381 1 0.066 1.514 rental 0.831 0.248 11.196 1 0.001 2.295 Age 0.006 0.009 0.395 1 0.529 1.006 Adverse 0.904 0.224 16.293 1 0.000 2.470 Property −0.724 0.168 18.490 1 0.000 0.485 LTT 0.632 0.454 1.935 1 0.164 1.882
Collateral
unsecured 9.278 3 0.026
cash collateral −0.425 0.421 1.020 1 0.312 0.529 checks 0.036 0.203 0.032 1 0.858 1.037 mortgage −0.505 0.196 6.647 1 0.010 0.604 Constant −1.537 0.400 14.728 1 0.000 0.215
DOI: 10.4236/ojacct.2018.74013 202 Open Journal of Accounting
Table 6. Binomial logistic regression—December 2011.
December 2011 B S.E. Wald df Sig. Exp(B)
Step 1a
Years −0.010 0.008 1.575 1 0.209 0.990 Owfac −0.319 0.116 7.589 1 0.006 0.727
Bank Relationship
no customer 21.043 3 0.000
deploan −0.076 0.158 0.229 1 0.633 0.927 deposits −0.518 0.274 3.581 1 0.058 0.596 loans 0.388 0.137 8.006 1 0.005 1.475
Residence Status
with parents 13.242 2 0.001
homeowner −0.091 0.162 0.314 1 0.575 0.913 rental 0.448 0.188 5.712 1 0.017 1.566 Age 0.009 0.007 1.732 1 0.188 1.009 Adverse 0.464 0.180 6.622 1 0.010 1.590
Collateral
unsecured 7.586 3 0.055
cash collateral −0.478 0.330 2.100 1 0.147 0.620 checks −0.415 0.168 6.097 1 0.014 0.661 mortgage −0.063 0.130 0.234 1 0.629 0.939 Property −0.752 0.128 34.539 1 0.000 0.471 LTT 0.158 0.434 0.133 1 0.715 1.854 Constant −1.109 0.304 13.281 1 0.000 0.330
a. Variable(s) entered on step 1: Years, Owfac, Bankrel, Residence, Age_A, Adverse, Collat, Property, LTT. b. In order to preserve the anonymity of the bank we could not give more details about the data sources.
Table 7. Predictive performance.
Metric December 2010 December 2011 Average accuracy 90.80% 81.50% Estimated misclassification cost 0.0452 0.1570
Notes: The average accuracy is calculated by the equation: AC = (TP + TN)/Total, where: AC: Average Ac-curacy; TP: True Positive (Predicted Performing Loans); TN: True Negative (Predicted Non-Performing Loans); Total: Total Loans. The estimated misclassification cost is calculated by the equation: EMC = (PL/Total)*Type Error 1 + (NPL/Total)*Type Error 2, where EMC: Estimated Misclassification Cost; Type Error 1 = FN/(TP + FN); Type Error 2 = FP/(TN + FP); PL: Performing Loans; NPL: Non-Performing Loans; FN: False Negative (Predicted Non-Performing Loans); TP: True Positive (Predicted Performing Loans); FP: False Positive (Predicted Performing Loans); TN: True Negative (Predicted Non-Performing Loans); Total: Total Loans.
6. Conclusions
[image:12.595.209.538.465.516.2]DOI: 10.4236/ojacct.2018.74013 203 Open Journal of Accounting non-performing, the conclusions are broadly expected. Particularly, binomial logistic regression shows a positive correlation between non-performing loans and factors “Adverse”, “Age” and “LTT”. Regarding the variable “Adverse”, the positive correlation between the probabilities of a loan not served and prior misbehavior borrower is demonstrated. An enterprise that has demonstrated bad trading behavior either to the public sector or to third banks, either to suppliers or customers, has many more chances not to serve the loan. Regarding the vari-able “Age”, it is demonstrated that the greater the borrower, the greater the probability of designating a loan as non-performing. Finally, the variable “LTT”, also shows a positive correlation with non-performing loans, with an increasing trend of correlation as the crisis deepens, which is absolutely normal as the higher borrowing proportionately with the dynamics of the business, as depicted in the company’s turnover, the more difficult is the ability to serve its obliga-tions.
In contrast, we find a negative correlation between the probability of classify-ing a loan as non-performclassify-ing and the independent variables “Collateral”, “Own Facilities”, “Property”, “Residence” and “Years of operation”. Specifically, the formation of non-performing loans is negatively affected by the collateral pro-vided ensuring growth within tensity depending on the strength of the collateral (cash collateral, mortgage, client checks), compared with loans secured only by personal guarantees. More specifically, the collateral of the loan is an important element for deciding to grant a loan or not. The posted collateral could be seen as a contribution or exchange of borrower for the credit risk assumed by the bank. The stronger the cover, i.e. the stronger the exchange offered by the client, the less the probability of default of the loan. In addition the financial soundness of a loan involved, is the guarantee for smooth repayment of the loan. Moreover, the existence of private facilities and owner-occupied dwellings reduces the probability that a loan is classified as non-performing, since the fixed obligations of businesses are smaller, giving them the opportunity to be more competitive. The existence of property also negatively associated with non-performing loans, precisely because of the financial standing of borrowers. Finally, years of opera-tion, also negatively correlated with the appearance of non-performing loans. The reason is that companies with a long presence in a sector, on the one hand have secured a certain market share, and on the other hand have created trust-worthiness with both suppliers and customers, making easier to cope with the liquidity problems caused by the recession.
like-DOI: 10.4236/ojacct.2018.74013 204 Open Journal of Accounting lihood of the borrower to default, is largely influenced by the unfavorable eco-nomic conditions, thereby reducing the effect of the independent variables.
This study highlighted the evolution of the importance of those factors that determine the likelihood of a loan not repaid at the current recession of the Greek economy, using data for one of the four systemic banks. It would be of particular interest to study whether there are common characteristics with other European countries in the south Europe (Italy, Spain, Portugal, France) in order the ECB to define a representative joint surveillance platform based on the spe-cific and the common characteristics of countries-states of the European Union. In addition, it would be interesting to study the behavior or loans that granted during the deep recession of the Greek economy (2013-2014), in order to check how crisis affect the evaluation process of loan application.
Conflicts of Interest
The author declares no conflicts of interest regarding the publication of this pa-per.
References
[1] Aggelopoulos, E. and Georgopoulos, A. (2017) Bank Branch Efficiency under Envi-ronmental Change: A Bootstrap DEA on Monthly Profit and Loss Accounting Statements of Greek Retail Branches. European Journal of Operational Research, 261, 1170-1188.https://doi.org/10.1016/j.ejor.2017.03.009
[2] Wang, G., Ma, J., Huang, L.H. and Xu, K.Q. (2012) Two Credit Scoring Models Based on Dual Strategy Ensemble Trees. Knowledge-Based Systems, 26, 61-68. https://doi.org/10.1016/j.knosys.2011.06.020
[3] Hand, D.J. and Henley, W.E. (1997) Statistical Classification Methods in Consumer Credit Scoring: A Review. Journal of the Royal Statistical Society: Series A (Statistics in Society), 160, 523-541.https://doi.org/10.1111/j.1467-985X.1997.00078.x
[4] Lin, S.L. (2009) A New Two Stage Hybrid Approach of Credit Risk in Banking In-dustry. Expert Systems with Applications, 36, 8333-8341.
https://doi.org/10.1016/j.eswa.2008.10.015
[5] Arito, O., Ryo, H. and Hideaki, H. (2014) Differentiated Use of Small Business Cre-dit Scoring by Relationship Lenders and Transactional Lenders: Evidence from Firm-Bank Matched Data in Japan. The Research Institute of Economy, Trade and Industry.
[6] Mitchell, P.A. and Raghura, R.G. (1995) The Effect of Credit Market Competition on Lending Relationships. The Quarterly Journal of Economics, 110, 407-443. https://doi.org/10.2307/2118445
[7] Ray, T., Liu, Y.-J., Liu, W. and Lien, Y.-L. (2004) Credit Scoring System for Small Business Loans. Decision Support Systems, 38, 91-99.
https://doi.org/10.1016/S0167-9236(03)00079-4
[8] Bhattacharya, S. and Thakor, A.V. (1993) Contemporary Banking Theory. Journal of Financial Intermediation, 3, 2-50.https://doi.org/10.1006/jfin.1993.1001
[9] Douglas, D.W. (1984) Financial Intermediation and Delegated Monitoring. Review of Economic Studies, 51, 393-414.https://doi.org/10.2307/2297430
DOI: 10.4236/ojacct.2018.74013 205 Open Journal of Accounting 1699-1707.https://doi.org/10.1016/j.procs.2011.04.184
[11] Lee, T.-S., Chiu, C.-C., Lu, C.-J. and Chen, I.F. (2002) Credit Scoring Using the Hy-brid Neural Discriminant Technique. Expert Systems with Applications, 23, 245-254.https://doi.org/10.1016/S0957-4174(02)00044-1
[12] Lim, M.K. and Sohn, S.Y. (2007) Cluster-Based Dynamic Scoring Model. Expert Systems with Applications, 32, 427-431.https://doi.org/10.1016/j.eswa.2005.12.006
[13] Altman, E.I., Avery, R., Eisenbeis, R. and Stinkey, J. (1981) Application of Classifi-cation Techniques in Business, Banking and Finance, Contemporary Studies in Economic and Financial Analysis, Vol. 3. JAI Press, Greenwich.
[14] Altman, E.I. and Saunders, A. (1998) Credit Risk Measurement: Developments over the Last 20 Years. Journal of Banking & Finance, 21, 1721-1742.
https://doi.org/10.1016/S0378-4266(97)00036-8
[15] Beaver, W. (1966) Financial Ratios as Predictors of Failure. Journal of Accounting Research, Supplement on Empirical Research in Accounting, 4, 77-111.
https://doi.org/10.2307/2490171
[16] Karels, G. and Prakash, A. (1987) Multivariate Normality and Forecasting of Busi-ness Bankruptcy. Journal of BusiBusi-ness Finance Accounting, 14, 573-593.
https://doi.org/10.1111/j.1468-5957.1987.tb00113.x
[17] Reichert, A.K., Cho, C.C. and Wagner, G.M. (1983) An Examination of the Con-septual Issues Involved in Developing Credit-Scoring Models. Journal of Business and Economic Statistics, 1, 101-114.
[18] Thomas, L.C. (2000) A Survey of Credit and Behavioural Scoring; Forecasting Fi-nancial Risk of Lending to Consumers. University of Edinburgh, Edinburgh. [19] Baesens, B., Setiono, R., Mues, C.H. and Vanthienen, J. (2003) Using Neural
Net-work Rule Extraction and Decision Tables for Credit-Risk Evaluation. Management Science, 49, 312-329.https://doi.org/10.1287/mnsc.49.3.312.12739
[20] Lee, C. and Chen, W.J. (2005) Management in the Information Technology Indus-try. International Journal of Management, 22.
[21] Desay, V., Crook, J.N. and Overstreet, G.A. (1996) A Comparison of Neural Net-works and Linear Scoring Models in the Credit Union Environment. European Journal of Operational Research, 95, 24-37.
https://doi.org/10.1016/0377-2217(95)00246-4
[22] West, D. (2000) Neural Network Credit Scoring Models. Computers & Operations Research, 27, 1131-1152.https://doi.org/10.1016/S0305-0548(99)00149-5
[23] Gordy, M.B. (2000) A Comparative Anatomy of Credit Risk Models. Journal of Banking and Finance, 24, 119-149.https://doi.org/10.1016/S0378-4266(99)00054-0
[24] Jerome, F.H. (1991) Multivariate Adaptive Regression Splines. The Annals of Statis-tics, 19, 1-67.https://doi.org/10.1214/aos/1176347963
[25] John, C.B., Edward, A.I. and Paul, N. (1998) Managing Credit Risk: The Next Great Financial Challenge. John Wiley & Sons, Hoboken.
[26] Francisco, L., Paulo, F.-S.H. and Carlos, D.A.R. (2012) On the Impact of Dispropor-tional Samples in Credit Scoring Models: An Application to a Brazilian Bank Data. Expert Systems with Applications, 39, 8071-8078.
https://doi.org/10.1016/j.eswa.2012.01.134
[27] Maja, S., Dusan, M. and Jure, Z. (2007) Consumer Credit Scoring Models with Li-mited Data. Expert Systems with Applications, 36, 4736-4744.
DOI: 10.4236/ojacct.2018.74013 206 Open Journal of Accounting https://doi.org/10.1016/0377-2217(95)00070-4
[29] Constantin, Z. and Michael, D. (2002) Multicriteria Classification and Sorting Me-thods: A Literature Review. European Journal of Operational Research, 138, 229-246.https://doi.org/10.1016/S0377-2217(01)00243-0
[30] Jiang, L., Li, C. and Cai, Z. (2009) Learning Decision Tree for Ranking. Knowledge and Information Systems, 20, 123-135.https://doi.org/10.1007/s10115-008-0173-z
[31] Shin, K. and Han, I. (2001) A Case-Based Approach Using Inductive Indexing for Corporate Bond Rating. Decision Support Systems, 32, 41-52.
https://doi.org/10.1016/S0167-9236(01)00099-9
[32] Schebesch, B.K. and Stecking, R. (2005) Support Vector Machines for Classifying and Describing Credit Applicants: Detecting Typical and Critical Regions. Journal of the Operational Research Society, 56, 1082-1088.
https://doi.org/10.1057/palgrave.jors.2602023
[33] Suran, G. and Philip, T.C. (1995) Intelligent Systems for Finance and Business. John Wiley & Sons, New York.
[34] Piramuthu, S., Shaw, M.J. and Gentry, J.A. (1994) A Classification Approach Using Multi-Layer Neural Networks. Decision Support Systems, 11, 509-525.
https://doi.org/10.1016/0167-9236(94)90022-1
[35] Richeson, L., Zimmermann, R.A. and Barnett, K.G. (1994) Predicting Consumer Credit Performance: Can Neural Networks Outperform Traditional Statistical Me-thods? International Journal of Applied Expert Systems, 2, 116-130.
[36] Pierre, B., Soren, B., Yves, C., Claus, A.A.F. and Henrik, N. (2000) Assessing the Accuracy of Prediction Algorithms for Classification: An Overview. Science & Ma-thematics, Bioinformatics, 16, 412-424.
https://doi.org/10.1093/bioinformatics/16.5.412
[37] Makri, V., Tsagkanos, A. and Bellas, A. (2014) Determinants of Non-Performing Loans: The Case of Eurozone. Panoeconomicus, 2, 193-206.
https://doi.org/10.2298/PAN1402193M
[38] Louzis, D., Vouldis, A. and Metaxas, V. (2012) Macroeconomic and Bank Specific Determinants of Non-Performing Loans in Greece: A Comparative Study of Mort-gage, Business and Consumer Loan Portfolios. Journal of Banking and Finance, 36, 1012-1027.https://doi.org/10.1016/j.jbankfin.2011.10.012
[39] Artavanis, N., Morse, A. and Tsoutsoura, M. (2016) Measuring Income Tax Evasion Using Bank Credit: Evidence from Greece. The Quarterly Journal of Economics, 131, 739-798.https://doi.org/10.1093/qje/qjw009
[40] Gupta, J., Gregoriou, A. and Healy, J. (2015) Forecasting Bankruptcy for SMEs Us-ing Hazard Function: To What Extent Does Size Matter? Review of Quantitative Finance and Accounting, 45, 845-869.https://doi.org/10.1007/s11156-014-0458-0
[41] Joseph, B. (1944) Application of the Logistic Function to Bio-Assay. Journal of the American Statistical Association, 39, 357-365.
[42] Ittner, B.C. (1934) The Method of Probits. Science, 79, 38-39.
https://doi.org/10.1126/science.79.2037.38
[43] Barnard, G.A. (1949) Statistical Inference. Journal of the Royal Statistical Society, 11, 115-149.
[44] Cramer, J.S. (2003) Logit Models from Economics and Other Fields. Cambridge University Press, Cambridge.https://doi.org/10.1017/CBO9780511615412