THE AIM OF THE SURVEY AND METHODOLOGY
The aim of the survey was to find out if it is possible to identify the differences in work motivation between people from large cities and people from small munici-palities, namely between the inhabitants of the Prague metropolitan area and smaller municipalities. The survey was carried out as a questionnaire analysis and the data obtained were processed using the variance
analysis (ANOVA), the correlation analysis and the factor analysis. Here we will focus only on the results detected in the variance analysis (ANOVA).
We used for the survey an EDMK questionnaire (Roe et al. 2001), which was described elsewhere, and several questions that we added to the EDMK questionnaire.
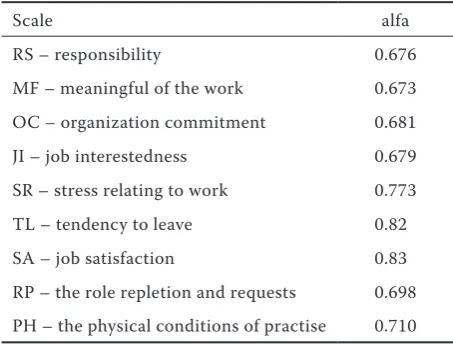
The reliability of the used scales was verified before the actual analysis using the calculation of Cronbach’s alfa.
Work motivation and the municipality size
Motivace pracovní činnosti a velikost sídla
L. KOLMAN, P. MICHÁLEK, H. CHAMOUTOVÁ, K. CHAMOUTOVÁ, L. MÜLLEROVÁ
Czech University of Life Sciences, Prague, Czech Republic
Abstract: The article shows the results of the grant project ofCzech Science Foundation 406/03/0896, which focused on the survey of work motivation and quality of working life issues in the Czech country. The results concern an analysis of vari-ation and a range of coefficients and show statistically significant differences in motivvari-ational coefficients in sets that differ in the respondent’s size of residence. The main aim of the survey was to find out if it is possible to identify the differences in work motivation between people from large cities and people from small municipalities, namely between inhabitants of the Prague metropolitan area and smaller municipalities placed near to the national boundary. The survey was conducted by means of the EDMK questionnaire, which is described elsewhere (see references). Some specific questions were added by the present authors. Statistical analysis of the data obtained resulted in the findings, as follows: (1) questionnaire scales used are sufficiently reliable (as proved by the Cronbachs’ alphas statistics); (2) statistically significant differences were iden-tified in the motivational patterns of the Prague Metropolitan Area and small municipalities inhabitants; (3) the quality of working life in Czechia was found as a rather low; it results in lower perceived responsibility and job involvement found in the whole sample of Czech responses.
Key words: motivation, working life quality, EDMK, Czech countryside
Abstrakt:Staťprezentuje výsledky výzkumu provedeného v rámci řešení grantového projektu GAČR 406/03/0896 zamě-řeného na výzkummotivace a kvality života při práci na českém venkově. Výzkum byl proveden jako dotazníková studie. Výsledky byly analyzovány pomocí metod analýza variance, korelační analýza a faktorová analýza. Výsledky vykázaly statis-ticky významné rozdíly v motivačních charakteristikách mezi soubory respondentů pocházejících z velkých a malých sídel. Hlavním cílem studie bylo zjistit zda lze identifikovat rozdíly v pracovní motivaci mezi obyvateli velkých měst a obyvateli malých obcí a také mezi obyvateli pražské metropolitní oblasti a malých obcí, zejména na okraji země. Dotazníkový výzkum byl proveden pomocí dotazníku EDMK, který je popsaný v citovaných pramenech. Několik dalších otázek připojili autoři. Zpracování dat vedlo k následujícím zjištěním: (1) použité škály jsou dostatečně spolehlivé (ověřeno výpočtem Cronbacho-vých alf); (2) byly nalezeny statisticky významné rozdíly v motivačních charakteristikách mezi obyvateli pražské metro-politní oblasti a menších obcí; (3) další výsledky ukazují, že kvalita života při práci v naší zemi je snížená, což se projevuje zejména nízkou vnímanou odpovědností a zaujatostí prací v celém souboru dat.
Klíčová slova: motivace, kvalita života při práci, EDMK, český venkov
RESULTS
The characterization of the data set
The basic descriptive data about the set of the ana-lysed data are shown in Table 1. The set consisted of approximately the same number of men and women, age 20 to more than 60, and the average age cor-responded with 31–45 years of age. The education of the respondents is mostly secondary education; there are fewer university graduates. In the case of the size of the residence (the abode of respondent), the average corresponds with a small town with up to 10 000 inhabitants.
Reliability
Šařecová and Hladíková (2005) give for the Cron-bach´s alfa following conditions:
– The scale is more reliable if the calculated Cronbach´s alfa is equal or bigger than 0.90;
– The scale is reliable if the calculated Cronbach´s alfa is equal or bigger than 0.85;
– The reliability of the scale is satisfactory and can be used if the calculated alfa is equal or bigger than 0.65.
In the case of two scales in the EDMK questionnaire, the values of Cronbach´s alfa did not reach the value 0.65. Therefore, these two scales were eliminated from further processing. The values, which were found in other scales, are shown in the Table 2.
The EDMK questionnaire was completed by our own questions which were coded as the DP questions. The reliability of the DP questions was not identified because it involves six one-item scales.
The analysis of variance
Using the ANOVA calculation, the researchers try to support the hypothesis of differences in work mo-tivation among Prague people, the Central Bohemia region and smaller villages. With the aid of the ANOVA calculation, three subsets of the whole process data set were compared, indicated as Prague, Central Bohemia and Klatovy. In the Tables 3–8, these three subsets are identified (in the same order) as Column 1, 2 and 3. There are submitted data from respondents, who give the information that they live in these regions, in the sets Prague and Central Bohemia. The name of the third subset is Klatovy. Into this set, the data obtained from respondents who were instructed to get answer back from respondents from small vil-lages were submitted. The following tables show that they meet the aim enough to support statistically significant results from the former determination (Kolman 2001).
In comparing these subsets, we found statistically significant difference only in the scale TL from the scales of the EDMK questionnaire. The finding, that in the small villages the tendency to leave is smaller than in the other two subsets, can be explained in that outside Prague and the Central Bohemia region, the chance to find a new employment is much smaller.
[image:2.595.62.531.85.170.2]The statistically significant difference was found in the question DP6 that determine the expected consequences of work for the respondent. Actually, agreement with the assertion on which the ques-tion DP6 was build means that the respondent feels Table 2. The reliability of the scale
Scale alfa
RS – responsibility 0.676
MF – meaningful of the work 0.673 OC – organization commitment 0.681
JI – job interestedness 0.679
SR – stress relating to work 0.773
TL – tendency to leave 0.82
SA – job satisfaction 0.83
[image:2.595.63.290.593.765.2]RP – the role repletion and requests 0.698 PH – the physical conditions of practise 0.710 Table 1. The descriptive data about the set analysed
N Minimum Maximum Average Standard deviation
Gender 882 1.00 2.00 1.4558 0.49832
Age 882 1.00 5.00 2.8095 0.86815
Education 882 1.00 6.00 3.8696 1.03295
that his/her manager does not care about effort and achievement of his/her subordinates, as is explained in more detail later . The results match with the find-ings from the former 2001 study.
On top of that, we found statistically significant differences among demographic characteristics of the subsets. All of them correspond with findings from the former study, which was quoted here before.
Table 3. The tendency to leave Factor
Selection Number Summation Average Dispersion
Column 1 87 1 044 12 16.30233
Column 2 161 1 936 12.02484 16.87438 TL
Column 3 297 3 277 11.03367 14.86373
ANOVA
Source of variability SS Difference MS F Value P F crit
Among selections 130.4838 2 65.24189 4.159365 0.016119 3.012351
All selections 8501.564 542 15.68554
Total 8632.048 544
Table 4. Consequences of work (question DP6) Factor
Selection Number Summation Average Dispersion
Column 1 87 199 2.287356 1.323443
Column 2 161 399 2.478261 1.226087 DP6
Column 3 296 779 2.631757 1.433429
ANOVA
Source of variability SS Difference MS F Value P F crit
Among selections 8.617259 2 4.308629 3.180683 0.042336 3.012382
All selections 732.8515 541 1.354624
Total 741.4688 543
Table 5. Age Factor
Selection Number Summation Average Dispersion
Column 1 87 254 2.91954 0.981823
Column 2 161 434 2.695652 0.725543
Column 2 161 434 2.695652 0.725543
Column 3 297 871 2.93266 0.819774
ANOVA
Source of variability SS Difference MS F Value P F crit
Among selections 6.224898 2 3.112449 3.806487 0.022823 3.012351
All selections 443.1769 542 0.81767
The Czech set on the EDMK scales
We were interested if the results of the Czech study are in some way different. The process, which we
finally chose, consisted in enumerating the maximum number of achieved points of each EDMK scale and then we defined how many percented of this calcu-lation convert the average value of the same scale
Table 6. Education Factor
Selection Number Summation Average Dispersion
Column 1 87 364 4.183908 0.849505
Column 2 161 641 3.981366 0.955901
Column 3 297 1 152 3.878788 1.039312
ANOVA
Source of variability SS Difference MS F Value P F crit
Among selections 6.391424 2 3.195712 3.245788 0.039696 3.012351
All selections 533.6379 542 0.984572
Total 540.0294 544
Table 7. The municipality size Factor
Selection Number Summation Average Dispersion
Column 1 87 505 5.804598 0.624165
Column 2 161 724 4.496894 3.126553
Column 3 297 1 141.5 3.843434 3.486384
ANOVA
Source of variability SS Difference MS F Value P F crit
Among selections 263.7661 2 131.883 45.07269 7.81E-19 3.012351
All selections 1585.896 542 2.926008
Total 1849.662 544
Table 8. The number of actively well-mastered languages Factor
Selection Number Summation Average Dispersion
Column 1 87 134 1.54023 1.321037
Column 2 161 184 1.142857 0.860714
Column 3 297 391 1.316498 0.885977
ANOVA
Source of variability SS Difference MS F Value P F crit
Among selections 9.076902 2 4.538451 4.789664 0.00867 3.012351
All selections 513.5726 542 0.947551
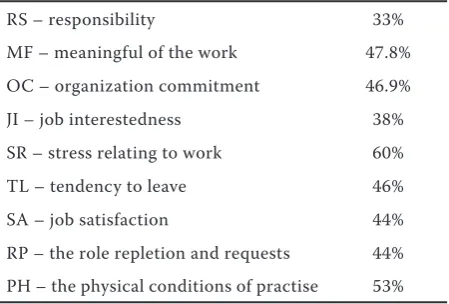
achieved in our survey. The results are given in the Table 9.
The Table 9 shows a surprisingly low percentage on the scale RS (responsibility) and the scale JI (job interestedness) likewise. Otherwise, the averages occur close to the centre of the scales.
DISCUSSION AND CONCLUSIONS
The contempory theories all at once and coinci-dently anticipate that the one who works well attains something, which is valuable for her/him. Generally, it is a payment, employee benefits, and social posi-tion. Sometimes it could be promotion and appre-ciation and they are the inner consequences as the aforementioned feeling of competency, realising the reason of doing the job and, last but not least, the development of the human personality. Not always it is self-evident that the labour performance has such consequences. We do not have to look further in the past to find examples of slavery, which was practised in hard physical conditions, in hunger, a threat and belittling without awards and a chance of improvement. Nowadays, we can still find these kinds of things in different parts of our world.
In the time of the “socialism as it existed”, it was not as bad as it was depicted in the previous para-graph. However, in that time it also did not matter how the employee worked. The “socialism as it ex-isted” referred to the class principle as its founding principle, but the reality was quite different from what was preached.. All people employed more or less worked better or worse. If someone worked well he/she would be suitable for the powerful. He/she was suitable for them only where he/she did the job well. The higher income, special awards or higher position were for those who already were there and not for them.
Table 9. Average as a percentage of the maximum number of points available
RS – responsibility 33%
MF – meaningful of the work 47.8% OC – organization commitment 46.9%
JI – job interestedness 38%
SR – stress relating to work 60%
TL – tendency to leave 46%
SA – job satisfaction 44%
RP – the role repletion and requests 44% PH – the physical conditions of practise 53%
Basically, the analogical experiences led to formula-tion of DP6 quesformula-tion. The DP6 quesformula-tion asks: “How probable is the following consequence of extraordi-nary labour performance: they will leave the worker in the same place, because he can do the job”. In the study which Kolman published in 2001, it appeared that respondents gave the higher probability to this consequence the older and less educated they were. The samples of employees from different organisations were compared in the study. It also appeared that a higher probability of this consequence of behaviour was given by employees from companies in which there were higher average age and less average educa-tion. At that time, Kolman interpreted the established facts within the meaning of previous paragraph as a reflection of the persisting ideas and convictions which were formed in people’s minds fifteen years ago and also as a consequence of sharing values in a social group.
The researchers found the conformable relation pattern during comparing three sets by the means of the Analysis of Variance (ANOVA). The tendency to attach a higher probability to the state described by DP6 question was statistically significant in the set of respondents from Klatovy who were in aver-age less educated and were from smaller villaver-ages. If we identify the inhabitants of smaller villages as the inhabitants of countryside in contrast to those who inhabit the Prague metropolitan area, then the results of the Analysis of Variance (Table 1 to 9) are the only differences between the motivation of people from the countryside and people from bigger villages that the researchers found in this survey.
There is a question to what extend the finding depicted in the Table 7 belong to the findings intro-duced in connection with DP6. As we can see in this table, the whole set is indicated with low values in the RS scale (responsibility) and also the JI scale (job interestedness). If there is in the Czech Republic a significant number of people who do not expect and believe that they will be regularly awarded for their intensity of labour, it does not surprise us that this matter will generally lower the responsibility and job interestedness. Anyway the data in Table 7 show the diminished quality of working life in the state.
of integration of social system in work place and technical systems as well, the same as in the Herzberg theory of the general humanization of work. There will be in some place the core of the problem. The responsibility was not transferred to the lower level of control in the former years. People do not believe their superiors and they in return do not believe them. The main aim in work was to cover small efficiency and someone who was devoted to work was seen as an odd person. After the political change, a manage-ment derived from primitive taylorism started to be applied and anything in the sense of humanization was considered “socialistic”. Apparently, the quality of working life in Czech organizations was then low and remains low even in these days. The correctness of our explanation would be necessary to check by further survey.
REFERENCES
Arnold J., Silvester J., Patterson F., Robertson I., Coo-per C., Burnes B. (2005): Work Psychology. Un-derstanding Human Behaviour in the Workplace. Prentice Hall, London.
Kolman L. (2001): Motivation and attributive proc-esses. Agrární perspektivy X., ČZU Praha; ISBN 80-213-0848-6.
Roe R.A., Zinovieva I.L., Dienes E., Ten Horn L.A. (2000): A comparison of work motivation in Bul-garia, Hungary and the Netherlands: Test of a model. Applied Psychology: An International Re-view, 49 (4): 658–687.
Šařecová P., Hladíková M. (2005): Kvalita zkušebních testů. In: Proceedings of the Conference Efficiency and Responsibility in Education, ČZU, Kostelec nad Černými Lesy, 20-21 June, pp. 205–212.
Arrived on 10th May 2006
Contact address: