warwick.ac.uk/lib-publications
Original citation:
Price, Daniel J, Cuello, Nicolás, Pinte, Christophe, Mentiplay, Daniel, Casassus, Simon,
Christiaens, Valentin, Kennedy, Grant M., Cuadra, Jorge, Sebastian Perez, M., Marino,
Sebastian, Armitage, Philip J., Zurlo, Alice, Juhasz, Attila, Ragusa, Enrico, Laibe, Guillaume
and Lodato, Giuseppe (2018) Circumbinary, not transitional: on the spiral arms, cavity,
shadows, fast radial flows, streamers, and horseshoe in the HD 142527 disc. Monthly
Notices of the Royal Astronomical Society, 477 (1). pp. 1270-1284.
doi:10.1093/mnras/sty647
Permanent WRAP URL:
http://wrap.warwick.ac.uk/102995
Copyright and reuse:
The Warwick Research Archive Portal (WRAP) makes this work by researchers of the
University of Warwick available open access under the following conditions. Copyright ©
and all moral rights to the version of the paper presented here belong to the individual
author(s) and/or other copyright owners. To the extent reasonable and practicable the
material made available in WRAP has been checked for eligibility before being made
available.
Copies of full items can be used for personal research or study, educational, or not-for profit
purposes without prior permission or charge. Provided that the authors, title and full
bibliographic details are credited, a hyperlink and/or URL is given for the original metadata
page and the content is not changed in any way.
Publisher’s statement:
This is a pre-copyedited, author-produced PDF of an article accepted for publication in
Monthly Notices of the Royal Astronomical Society following peer review. The version of
record Price, Daniel J, Cuello, Nicolás, Pinte, Christophe, Mentiplay, Daniel, Casassus, Simon,
Christiaens, Valentin, Kennedy, Grant M., Cuadra, Jorge, Sebastian Perez, M., Marino,
Sebastian, Armitage, Philip J., Zurlo, Alice, Juhasz, Attila, Ragusa, Enrico, Laibe, Guillaume
and Lodato, Giuseppe (2018) Circumbinary, not transitional: on the spiral arms, cavity,
shadows, fast radial flows, streamers, and horseshoe in the HD 142527 disc. Monthly
Notices of the Royal Astronomical Society, 477 (1). pp. 1270-1284.
doi:10.1093/mnras/sty647 is available online at:
http://dx.doi.org/10.1093/mnras/sty647
A note on versions:
The version presented here may differ from the published version or, version of record, if
you wish to cite this item you are advised to consult the publisher’s version. Please see the
‘permanent WRAP url’ above for details on accessing the published version and note that
access may require a subscription.
Circumbinary, not transitional: On the spiral arms, cavity, shadows,
fast radial flows, streamers and horseshoe in the HD142527 disc
Daniel J. Price
1?, Nicol´as Cuello
2,3,4, Christophe Pinte
1,5, Daniel Mentiplay
1, Simon
Casassus
6,3, Valentin Christiaens
6,3, Grant M. Kennedy
7, Jorge Cuadra
2,3,4, Sebastian
Perez M.
6,3, Sebastian Marino
7, Philip J. Armitage
8,9, Alice Zurlo
6,3, Attila Juhasz
7,
Enrico Ragusa
10, Guillaume Laibe
11and Giuseppe Lodato
101Monash Centre for Astrophysics (MoCA) and School of Physics and Astronomy, Monash University, Clayton Vic 3800, Australia 2Instituto de Astrof´ısica, Pontificia Universidad Cat´olica de Chile, Santiago, Chile
3Millennium Nucleus ‘Protoplanetary discs’, Chile 4N´ucleo Milenio de Formaci´on Planetaria (NPF), Chile
5Univ. Grenoble Alpes, CNRS, IPAG / UMR 5274, F-38000 Grenoble
6Departamento de Astronom´ıa, Universidad de Chile, Casilla 36-D, Santiago, Chile 7Institute of Astronomy, University of Cambridge, Madingley Rd, Cambridge, CB3 0HA, UK 8JILA, University of Colorado & NIST, UCB 440, Boulder, CO 80309-0440, USA
9Department of Astrophysical and Planetary Sciences, University of Colorado, 391 UCB, Boulder, CO 80309-0391, USA 10Dipartimento di Fisica, Universit`a Degli Studi di Milano, Via Celoria, 16, Milano, I-20133, Italy
11Univ Lyon, Univ Lyon1, Ens de Lyon, CNRS, Centre de Recherche Astrophysique de Lyon UMR5574, F-69230, Saint-Genis-Laval, France
ABSTRACT
We present 3D hydrodynamical models of the HD142527 protoplanetary disc, a bright and well studied disc that shows spirals and shadows in scattered light around a 100 au gas cavity, a large horseshoe dust structure in mm continuum emission, together with mysterious fast radial flows and streamers seen in gas kinematics. By considering several possible orbits consistent with the observed arc, we show that all of the main observational features can be explained by one mechanism — the interaction between the disc and the observed binary companion. We find that the spirals, shadows and horseshoe are only produced in the correct position angles by a companion on an inclined and eccentric orbit approaching periastron — the ‘red’ family from Lacour et al. (2016). Dust-gas simulations show radial and azimuthal concentration of dust around the cavity, consistent with the observed horseshoe. The success of this model in the HD142527 disc suggests other mm-bright transition discs showing cavities, spirals and dust asymmetries may also be explained by the interaction with central companions.
Key words: protoplanetary discs — planet-disc interactions — binaries: general — submil-limetre: planetary systems — accretion, accretion discs
1 INTRODUCTION
Around the young star HD142527 lies an enigmatic and spectacular protoplanetary disc. Cycle 0 observations with the Atacama Large Millimetre/submillimetre Array (ALMA) byCasassus et al.(2013) revealed a ‘horseshoe’ of dust continuum emission (first detected byOhashi 2008) surrounding a∼90–140 au central cavity (cavities being the defining feature of so-called ‘transitional’ or ‘transition discs’;Strom et al. 1989;Espaillat et al. 2014). The first ALMA observations also revealed diffuse CO gas inside the cavity along-side mysterious ‘streamers’ or ‘filaments’ seen in HCO+ emission, thought to indicate flow across a planet-induced gap (Casassus et al. 2013).
The star itself is a Herbig Fe star of spectral type F6 IIIe (M≈1.8 M) at a distance of156+7−6pc (Gaia Collaboration et al. 2016) in the Sco-Cen association (Biller et al. 2012;Mendigut´ıa et al. 2014). Modelling of the Spectral Energy Distribution (SED) suggested a disc gap between 30 and 130 au (Verhoeff et al. 2011), confirmed by the initial ALMA observations (Casassus et al. 2013). Earlier mid-infrared observations (van Boekel et al. 2004;Fujiwara et al. 2006) and more recent scattered light images (Avenhaus et al. 2017) found a small inner disc inside the cavity of∼10 au in radius. The high accretion rate onto the central star (≈2×10⁻⁷M
/yr;
Garcia Lopez et al. 2006;Mendigut´ıa et al. 2014) implies that the small inner disc must be refilled from the outer disc, most likely in an episodic manner (Casassus et al. 2013).
Even before ALMA, the disc around HD142527 had proved spectacular, with a spiral arm detected atR&100au in scattered
light observations in the near IR byFukagawa et al.(2006). Fur-ther observations revealed a wealth of spiral structure, including small near IR spirals at the edge of the cavity (Casassus et al. 2012; Canovas et al. 2013;Avenhaus et al. 2014,2017), a counterpart to theFukagawa et al.(2006) spiral seen in the CO emission in further ALMA observations, as well as two further large scale (∼500 au) spiral arms byChristiaens et al.(2014).
Fukagawa et al.(2006) first suggested that the spirals might be caused by an inner companion, with the presence of a 0.1–0.4 Mcompanion with a projected separation of∼13au confirmed
byBiller et al.(2012) using Sparse Aperture Masking (SAM) with the NACO instrument on the Very Large Telescope (VLT). More recent observations have refined both the orbit and the companion mass (Close et al. 2014;Lacour et al. 2016) (hereafterL16).
Scattered light images also revealed shadows cast across the outer disc (Fukagawa et al. 2006;Avenhaus et al. 2014).Marino et al.(2015a) satisfyingly reproduced the observed illumination pattern by assuming a compact∼ 10au inclined and thin inner disc casting shadows on the outer disc, with a relative inclination of∼70◦. This is consistent with the estimated inclination of the
inner binary with respect to the disc (L16).
Perhaps the greatest surprise were the complexities found in detailed kinematic studies using CO(6–5) molecular line data by Casassus et al.(2015a), with evidence for a warped disc and near free-fall motions within the central cavity, suggested to be related to theoretical models of ‘disc tearing’ in warped accretion discs (Nixon et al. 2013;Nealon et al. 2015).
Understanding the origin of features in the HD142527 disc is important because several of these appear common to a broad class of discs. In particular, dust horseshoes or rings surround-ing the central cavities in mm-bright transition discs appear to be widespread (van der Marel et al. 2016;Canovas et al. 2016; see re-view byCasassus 2016), with horseshoes normally interpreted as ‘dust traps’ caused by a vortex at the edge of a planet-induced gap (e.g.Pinilla et al. 2012;van der Marel et al. 2013;Baruteau & Zhu 2016;Marino et al. 2015b). Spirals are also observed in an increas-ing number of discs (Garufi et al. 2013;Benisty et al. 2015;P´erez et al. 2016;Benisty et al. 2017). Thus, unlocking the mystery of HD142527 may help to shed light on the origin of these features in this wider class of discs.
Our approach is to perform 3D hydrodynamical and dust-gas simulations of the disc-binary interaction, to try to explain the ob-served features in the HD142527 disc. We describe the key obser-vations in Section2, methods and initial conditions in Section3. Results are in Section4. We discuss in Section5and summarise in Section6.
2 OBSERVATIONAL CONSTRAINTS
The sheer volume of data collected on HD142527 provides tight constraints on theoretical models, and it seems optimistic to assume that a single model could explain multiple observed features simul-taneously. From a dynamical perspective the main puzzles are:
(i) Shadows. The close agreement found by Marino et al. (2015a) between their radiative transfer model and the scattered light images means these shadows are almost certainly cast by an inner circumprimary disc inclined to the outer disc plane by∼70◦. The size of such a disc would be consistent with the infrared obser-vations (Verhoeff et al. 2011). The constraints from ALMA CO observations of the inner disc suggests that it is small and with
un-usual (non-Keplerian) kinematics between the inner and outer disc (Perez et al. 2015;Casassus et al. 2015a).
(ii) Fast radial flows.Casassus et al.(2015a) suggested an expla-nation for fast radial flows in terms of disc tearing by an inclined inner binary (e.g.Nixon et al. 2013). However, subsequent sim-ulations by Dunhill and collaborators (reported inCuadra 2016) found that such a binary tended to simply break the disc into two distinct sections, as found byFacchini et al.(2013) and consistent with expectations of warp dynamics in thick (H/R∼0.1) proto-planetary discs.Rosenfeld et al.(2014) also found that the fast ra-dial flows were better explained by free-fall rara-dial velocities rather than a warp, suggesting material is somehow able to shed angular momentum and plunge into the central regions. Those authors pro-posed gravitational torques from giant planets or brown dwarfs as a possible solution.
(iii) Spiral arms. Spirals are seen immediately outside the cavity in both scattered light (Fukagawa et al. 2006;Rodigas et al. 2014; Avenhaus et al. 2014,2017) and in CO emission (Christiaens et al. 2014). These are usually attributed to the presence of either com-panions orbiting interior or exterior to the arms (Dong et al. 2015), to a gravitationally unstable disc (Dipierro et al. 2015a), or to some combination of both (Pohl et al. 2015).Quillen(2006) offered an explanation of similar spirals seen in the disc around HD100546 in terms of a precessing, warped disc driven by misaligned embed-ded protoplanets.Montesinos et al.(2016) also showed that spiral structure could be induced by temperature fluctuations caused by shadows.
(iv) Cavity. The origin of central cavities in transitional discs is not yet certain (Williams & Cieza 2011). Traditionally central holes were thought to arise from either photoevaporation of gas by the central star or depletion of gas and/or dust due to formation of planetary mass companions (Williams & Cieza 2011;Andrews et al. 2011;Espaillat et al. 2014;Owen 2016).Zhu et al.(2012) found that dust filtering by giant planets (e.g.Rice et al. 2006) could partially explain the mm-dust holes seen in many transition discs, but that the depletion in small particles was insufficient to ex-plain the near-IR deficit in the Spectral Energy Distribution (SED). An alternative possibility is the tidal truncation of the disc from a central binary (Artymowicz & Lubow 1994). While a low mass companion has been found in HD142527 (see below), previous au-thors (e.g.L16) have assumed that the projected orbital separation of∼13au is too small to tidally truncate the disc out to 100 au — the size of the observed CO cavity (Perez et al. 2015;Muto et al. 2015;Boehler et al. 2017).
(v) Dust horseshoe. Currently the main accepted model for pro-ducing dust horseshoes in mm-bright transition discs involves dust trapping by a gap-edge vortex (Pinilla et al. 2012; Lyra & Lin 2013).Ataiee et al.(2013) considered an alternative model where dust horseshoes could be produced by eccentric circumbinary cavi-ties, but dismissed this model based on their simulations. However, dust evolution was added only in post-processing which neglects the role of tidal torques on the dust and backreaction, leading to potentially misleading conclusions. Recently,Ragusa et al.(2017) showed that central binaries can produce both rings and horse-shoes in dust emission. Indeed, eccentricities around the cavity edge are a common feature in hydrodynamical simulations of cir-cumbinary discs (Kley & Dirksen 2006;Farris et al. 2014;Ragusa et al. 2016).Ragusa et al.(2017) showed that more massive com-panions produce progressively more asymmetric structures, with simulated ALMA observations closely matching observed discs.
com-500 400 300 200 100 0 100
RA (mas) 200
100 0 100 200
Dec (mas)
60 65 70 75 80
70 65 60 55 50 45 40 35 30
May 2014
March 2012
x [au]
-200 -100 0 100 200
y [mas]
y [au]
0 50
-20 0
20 B1
B2
B3
R1
[image:4.595.61.533.102.265.2]R2 R3
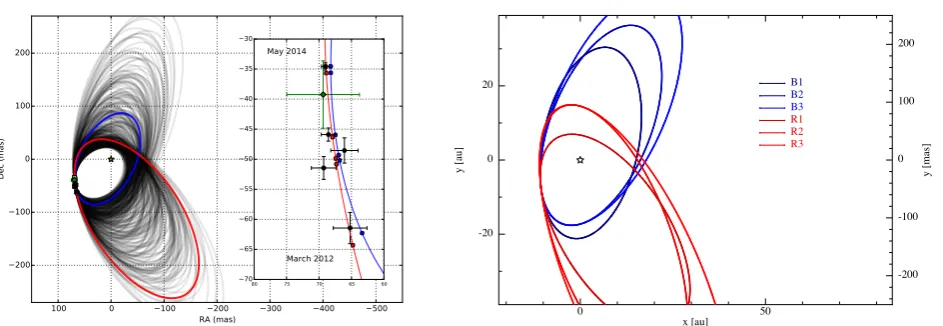
Figure 1.Binary orbit. Left: Orbital fits for HD142527B (Credit:Lacour et al. 2016, reproduced with permission ©ESO). Right: Selected trial orbits for HD142527B used in this paper, corresponding to the orbital elements listed in Table1. We assume the GAIA distance of 156pc. The star gives the location of the primary. Motion is clockwise.
monly in simulations of gap-opening by embedded planets in discs (e.g.Bryden et al. 1999;Lubow & D’Angelo 2006). However, it is not clear how the ‘filaments’ might be obviously related to either the companion or any other putative planets, nor how they relate to the fast radial flows, or whether they may be illumination effects due to shadowing from the tilted inner disc.
A clue to solving the puzzle is that all of the above features may in principle be caused by the interaction with an (inclined) central binary (Fukagawa et al. 2006). The main issue is how a binary with a∼13au projected separation could carve a∼90–
140au cavity. This ledL16to conclude that the cavity could not be created by the binary. However, the orbit is poorly constrained, with best fitting orbits fromL16suggesting significant eccentricity.
3 NUMERICAL METHODS
We perform 3D hydrodynamics simulations of the disc-binary in-teraction using the PHANTOM smoothed particle hydrodynamics (SPH) code (Price et al. 2018; for reviews of SPH seeMonaghan 2005;Price 2012). We also perform several models with dust and gas to see if we can simultaneously produce the dust horseshoe. Our approach to dust-gas modelling is similar to that used in our previous papers (Dipierro et al. 2015b,2016), where we model the dust using a separate set of particles coupled to the gas via a drag term (Laibe & Price 2012a,b;Price et al. 2018).
3.1 Initial conditions
3.1.1 Binary
We model the binary using sink particles that interact with the gas disc only via gravity and by accreting gas (Bate, Bonnell & Price 1995). The sink particles are free to migrate and also change mass and orbital parameters due to interaction with the gas disc. We set the primary mass to 1.8 M (from the spectral type), and con-strained by the total mass estimate of∼ 2.1±0.2Mfrom the
Keplerian motion of the outer disc (Casassus et al. 2015a) we set the companion mass to 0.4 M(the latest observational estimates
based on spectral fitting are in the range 0.2–0.4 M;Christiaens et al. 2018). Since our chosen mass of 0.4 Mis at the higher end of
Orbit a e i Ω ω f P θ
B1 26.5 0.24 119.9 349.7 218.0 25.93 91.8 40.4
B2 28.8 0.40 120.4 340.3 201.5 33.78 104 39.6
B3 34.3 0.50 119.3 159.2 19.98 35.04 135 80.7
R1 31.4 0.74 131.3 44.95 27.88 249.3 118 43.1
R2 38.9 0.61 120.3 19.25 354.0 268.3 164 45.3
R3 51.3 0.70 119.3 201.4 173.3 270.4 247 76.3
Table 1.Orbital elements for HD142527B for 6 trial orbits, drawn from fits to the observed arc withIMORBEL. From left to right: semi-major axis (a, au), eccentricity (e), inclination (i, deg), position angle of ascending node (Ω, deg; East of North), argument of pericentre (ω, deg), true anomaly (f, deg), orbital period (P, yrs) and relative angle between disc and binary (θ, deg).
this range, we also performed an additional set of calculations em-ploying lower mass companions. We found that our results are not strongly sensitive to the secondary mass, with companion masses as low as 0.1Mproducing the same cavity but with lower
ampli-tude perturbations around the cavity edge. The change in mass due to accretion is negligible in our simulations.
We fix the accretion radii for both sinks to1au in order to resolve the circumprimary disc, if present.
3.1.2 Binary orbit
After a few trial simulations with binaries of various semi-major axes and eccentricities, and from previous attempts at modelling HD142527 (seeCuadra 2016), we realised the importance of the known observational constraints on the orbit. To this end we em-ployedIMORBEL1to fit the orbit, written by Tim Pearce and Grant Kennedy (Pearce et al. 2015). The same code was also used inL16. Rather than taking the orbital fits directly fromL16, we pro-duced a revised set of orbital fits using the GAIA distance measure-ment and with our assumed primary and secondary masses. IMOR-BELproduces a plot similar to the one shown in figure 5 ofL16,
B1
B2
B3
R1
R2
100 au
0.5
1
col
um
n de
nsi
ty [ g/
cm
2
]
[image:5.595.46.543.98.408.2]R3
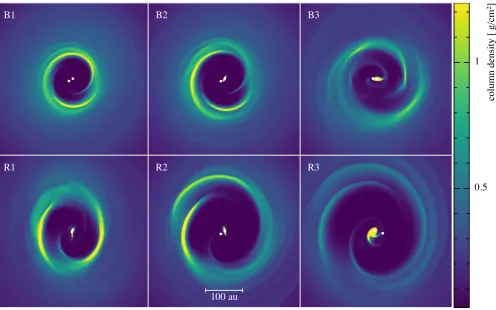
Figure 2.Gas surface densities after 20 orbital periods of the binary for the calculations withRin = 50au, showing the initial dynamical carving of the cavity for binary orbits shown in Figure1and listed in Table1. Top row shows the ‘blue’ orbits (binary just past periastron) while bottom row corresponds to the ‘red’ orbits (binary approaching periastron) fromL16. Cavity size scales with apastron separation, with more eccentric binaries (R2, R3) producing cavity sizes consistent with those observed in HD142527. Transient circumprimary discs are visible in all calculations except B1.
from which one may interactively select orbits with given parame-ters that match the observational constraints. Our guiding wisdom in selecting trial orbits was i) to examine orbits similar to the ‘blue’ and ‘red’ orbit families found in the Monte Carlo fitting shown in Figure 6 ofL16; and ii) to ensure an apoastron separation for the binary large enough to plausibly explain the cavity size.
Table1lists the orbital elements used for the six representative orbits shown in this paper, with the resultant orbits shown in Fig-ure1. For clarity we show three representative “blue” orbits (B1, B2, B3) and three “red” orbits (R1, R2, R3) listed in order of in-creasing semi-major axis. The most tightly constrained parameter is the inclination, which isi= 120◦for all but one of the orbits.
We choose eccentricities ranging from 0.24 to 0.7. The two classes of orbits are ‘families’ only in a projected sense, as the values of
Ωandω(and hence the orientation perpendicular to the sky plane) change dramatically. The main similarity between each family is simply the location of the periastron in position angle on the sky and thus whether the binary is approaching (red) or receding (blue) from periastron. The last column in Table1gives the angle between the disc and binary angular momentum vectors.
The Monte Carlo fitting performed byL16found semi-major axes11< a <40au, eccentricitiese= 0.5±0.2and inclinations
125±15degrees to within 1σ probability. Thus all our chosen orbits except R3 fall are probable to within 1σof these constraints. Finally, we adopted slightly different conventions for the or-bital elements to those used inPearce et al. (2015) andL16. In
particular, we removed the assumption byPearce et al.(2015) that the angle between the binary and the sky is restricted to be less than180◦ (thus flipping the observer from+z to −z depending on the orbit). Since the absolute orientation of the disc and binary are irrelevant in SPH, for convenience we defined the observer to be viewing the disc down thez−axis (i.e. fromz =∞). That is, we tilted both the disc and binary in our initial setup. This simpli-fied our analysis since replicating the observers view of HD142527 simply meant making anx-yplot in our computational coordinates. Finally, we adapted the setup routine in PHANTOMto use orbital el-ements fromIMORBELin the form given in Table1, such that the public codes are mutually compatible.
3.1.3 Circumbinary disc
We performed two sets of calculations, both with a 0.01 M cir-cumbinary gas disc but with inner radius set initially to either 50 or 90 au. TheRin= 50au calculations ensure that clearing of the
in-ner regions is entirely due to tidal effects, while starting withRin= 90au avoids transient formation of circumprimary and circumsec-ondary discs. We set the outer radius toRout = 350au (purely
for computational efficiency; the real disc extends to∼ 600au). We assume an initially power law surface density profileΣ∝R−1
log
Σ
[ g/cm
2]
10-3
10-2
10-1
1 B1 B2 B3
log
Σ
[ g/cm
2]
R [au] 102
50 200 500
10-3
10-2
10-1
1 R1
R [au] 102
50 200 500
R2
R [au] 102
50 200 500
[image:6.595.68.521.101.437.2]R3
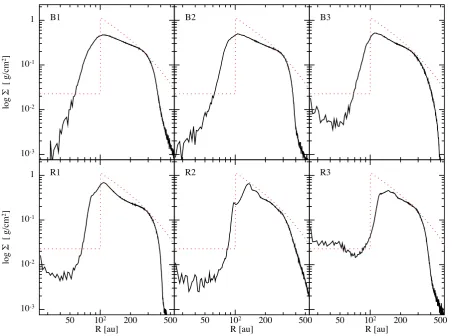
Figure 3.Cavity. Surface density as a function of cylindrical radius (in the sky plane) from theRin= 90au calculations after 50 binary orbits. Red dotted line shows the model adopted byPerez et al.(2015) from radiative transfer fitting to CO gas. Simulation R2 shows the closest match to the observed cavity size, withRcavwithin a few percent of the gas cavity size inferred from the CO data.
viscosityαSS≈0.005by setting a fixed artificial viscosity
param-eterαAV = 0.25in the code and using the ‘disc viscosity’ flag
(seeLodato & Price 2010). Since the artificial viscosity is explic-itly specified in SPH, the value ofαSS is directly related toαAV
according to
αSS= 1 10αAV
hhi
H , (1)
where the ratiohhiis the mean resolution length at a given radius andHis the disc scale height. There are no additional sources of numerical diffusion in SPH (seeLodato & Price 2010for detailed calibration and tests). For our chosen resolution the meanh/Hin the outer disc is 0.2 (i.e., 5 resolution lengths per scale height), hence the values ofαSSandαAVgiven above.
We prescribe temperature as a function of (spherical) radius according toT = 28K(r/rin)−0.3, consistent with the disc model
fit byCasassus et al.(2015a) to the observational temperature pro-file (we use spherical rather than cylindrical radius to avoid confu-sion when the disc is warped or inclined; seeLodato & Price 2010). This corresponds toH/R= 0.066atR=RinandH/R= 0.11
atR=Rout. More recent observations (Muto et al. 2015;Boehler et al. 2017) found higher temperatures which may suggest a thicker disc. Further modelling of the temperature changes in the disc due to the companion is beyond the scope of this paper but may be im-portant (Verhoeff et al. 2011).
The disc was oriented byi= 160◦with respect to thez= 0
plane, rotated about a Position Angle of−20◦. That is, our disc
is inclined by20◦to the line of sight but with the disc rotating clockwise on the sky, consistent with (e.g.)Casassus et al.(2015a).
3.2 Radiative transfer
To perform a direct comparison with observations of HD142527 we post-processed a subset of our simulations using the Monte Carlo radiative transfer codeMCFOST(Pinte et al. 2006,2009).MCFOST is particularly suited to post-processing data from SPH codes be-cause it uses a Voronoi tesselation where each cell corresponds to the position of an SPH particle. Properties such as density, temper-ature and velocity may then be mapped directly from the particles to the radiative transfer grid without interpolation.
To irradiate the disc we used the two sink particles as isotropic sources with stellar spectral models appropriate to their mass. Specifically, we adopt 3Myr isochrones fromSiess et al.(2000), with Teff = 4800K and a luminosity of 2.7 Lfor the primary
and Teff = 3700K and L = 0.22 Lfor the secondary. We
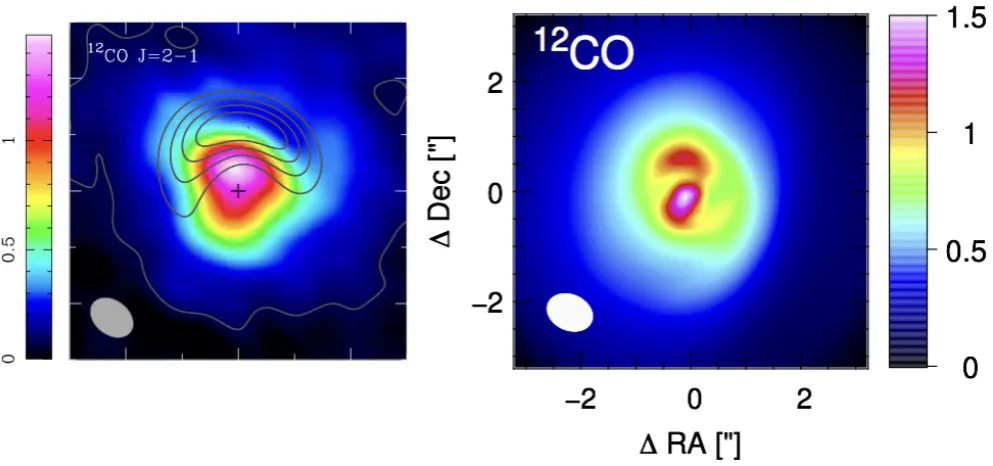
Figure 4.Gas inside the cavity. Predicted12CO J=2–1 from simulation R2 (right), compared to ALMA observations (left; credit: Figure 1 ofPerez et al. (2015) ©AAS, reproduced with permission). Sufficient gas remains inside the cavity to produce optically thick12CO emission, as observed.
M (<90au)
(×10−3M
)
Pitch ang. (PA265◦)
Pitch ang. (1st half)
Pitch ang. (2nd half)
SW Fork?
Obs 1.7±0.6 4.8◦ -3.6◦ 9.9◦ Yes
B1 2.0 1.5◦ 3.1◦ 0.0◦ No
B2 1.9 1.3◦ 3.2◦ 2.5◦ No
B3 1.6 5.1◦ 7.1◦ 3.2◦ No
R1 2.1 -1.8◦ -4.0◦ 0.6◦ Yes
R2 1.5 6.0◦ 6.4◦ 5.7◦ No
R3 1.4 3.6◦ 6.8◦ 0.4◦ No
Table 2.Gas mass interior to 90 au (first column); pitch angles along the outer spiral arm at position angle of265◦ (second column) and within
the first and second half of the spiral in position angle (third and fourth columns); comparing our simulations to the observations (top row) after 50 orbits of the binary. The final column indicates whether or not the spiral arms show a bifurcation or ‘fork’ towards the south-west. All simulations obtain residual mass interior to the cavity consistent with the observations. Simulations B3, R2 and R3 show pitch angles most consistent with the data.
as well as HCO+. We assume a uniform abundance of5×10−5, 7×10−7,2×10−7and10−9for12CO,13CO, C18O, and HCO+, respectively. We assume the gas is in local thermodynamic equilib-rium with Tgas = Tdust. We predicted only the line emission, not
the continuum, from our gas-only simulations under the assump-tion that the dust follows the gas. This is a good assumpassump-tion for grain sizes.10µm but for larger grains this assumption no longer holds (see Section4.5).
4 RESULTS
4.1 Cavity
Figure2shows the column density view of the six calculations cor-responding to the orbits listed in Table 2, shown after 20 binary orbital periods with initialRin = 50au. Transient circumprimary
discs are present in all calculations except B1. For both ‘blue’ and
‘red’ sets of orbits the cavity size scales with semi-major axis (left to right;Artymowicz & Lubow 1994). Cavity size also increases with eccentricity due to the increased apocentre separation (but de-creases with inclination;Miranda & Lai 2015). Comparison with the cavity size seen in scattered light, we can exclude binary or-bits witha & 50au. That with plausible orbits for the observed binary we can already produce a cavity sizetoo bigsolves one of the major mysteries of HD142527 — how a binary with a projected separation of 13 au can produce a 100 au cavity.
Figure3shows the surface density binned as a function of cylindrical radius in the sky plane (z = 0). The red dotted line shows the parameterised model adopted byPerez et al.(2015) from fits to the CO emission (specifically, we plot equation 6 from their paper, with parameters taken from their best fit model corrected for the GAIA distance, givingRcav = 100au). Simulation R2
pro-duces the closest match to the data, withRcavwithin a few percent
of the observational fit. The remarkable agreement demonstrates that orbits consistent with those inferred byL16indeed produce cavities of the correct size.
4.2 Gas inside the cavity
The drop in surface density seen in Figure3indicates that the cav-ity interior is not completely devoid of gas. To quantify this, Table2 lists the mass interior to 90 au in each of our simulations, compared to the observational measurement fromPerez et al.(2015). Regard-less of our choice of binary orbit the residual mass inside the cav-ity agrees with the observational estimate to within the error bars. For example, we measure a residual gas mass of1.5×10−3M
within 90 au in simulation R2 after 50 orbits, within 11% of the
(1.7±0.6)×10−3M
measured byPerez et al.(2015).
B1
B2
B3
R1
R2
100 au
0.5
1
col
um
n de
nsi
ty [ g/
cm
[image:8.595.44.544.81.406.2]R3
Figure 5.Spirals. Gas surface densities after 50 binary orbital periods in calculations with initialRin= 90au, showing the spiral arms. As in Figure2, top row shows the ‘blue’ orbits (binary just past periastron) while bottom row corresponds to the ‘red’ orbits (binary approaching periastron) fromL16. Comparison with the observed spiral structure (left panel of Figure6) favours the latter. Comparison with Fig.2shows the cavity size is independent of the initialRin. Red lines show polynomial fits to ‘inner’ and ‘outer’ spiral arms tracing a position angle range similar to the scattered light spirals (Fig.6).
cavity such that the12CO is optically thick, as observed. The bi-nary scenario thus naturally explains the residual gas found within the cavity around HD142527.
4.3 Spirals
Figure5shows the column density from theRin = 90au
calcu-lations after 50 binary orbital periods. In every case three or more prominent spiral arms are seen around the cavity. The companion thus already explains why spiral arms are present around the cavity without needing to invoke gravitational instability or other physics. Comparing theRin= 50au calculations shown in Figure2shows
that both calculations produce the same cavity sizes, with the cavity size approximately constant after&10orbits of the central binary. Comparing our results with scattered light (Avenhaus et al. 2014, 2017), 2 micron (Casassus et al. 2012, 2013) images of HD142527 shows that the blue orbits (top row) tend to produce spirals inconsistent with the observations. For a more quantitative comparison, we fit the spiral structure with a polynomial of the formr(θ) = P4
i=0aiθi. Aside from the formula used to fit the
spirals, the fitting procedure is otherwise identical to that described inChristiaens et al.(2014). That is, we trace pixels along the max-ima in column density and fit a polynomial to the resulting points using a least squares fit. Using this procedure we fit ‘inner’ and ‘outer’ spiral arms spanning the position angle ranges[260◦,305◦]
and[180◦,270◦], respectively, corresponding to the two main spi-rals seen to the south west of the cavity in the scattered light image.
Red lines in Figure5show the corresponding fits. For orbits B1 and B2 no inner spiral could be fitted, so we only show the outer arm.
Table2lists the resulting pitch angles for the outer spiral mea-sured at a position angle (PA) of265◦, and with the first and second half of the spiral (in position angle), corresponding to PA ranges
[180◦,225◦](third column) and[225◦,270◦](fourth column). Or-bits B1 and B2 in particular show pitch angles too small and little or no asymmetry in the gas distribution around a cavity which is close to circular. Orbit B3 shows promising spirals to the north-east of the cavity, but the spiral arms to the south-west show a series of almost-circular tightly wrapped arms not seen in the observations.
t=2358 yrs
[image:9.595.92.493.100.304.2]100 au
Figure 6.Shadows. Column density in the R1 orbit simulated with initialRin = 50au after 20 orbits at the observed orbital phase (right), showing the orientation of the (transient) circumprimary disc, compared to the scattered light (600-900nm) ZIMPOL polarisation image (left; taken from Figure 1 of Avenhaus et al.(2017) ©AAS, reproduced with permission). Dotted line indicates the expected shadow from our simulated inner disc (right), which lies close to the orientation of the observed shadows (left).
0
0.02
0.04
dust column density [g/cm
2]
R2 + large dust
0
5×10
-30.01
0.015
0.02
dust column density [g/cm
2]
R2 + medium dust
Figure 7.Dust. Dust column density in dust-gas simulations using orbit R2 with mm grains (left panel) and 100µm-sized grains (right panel). Our ‘large’ (mm) grains are close to Stokes number of unity, and hence quickly migrate to form a thin ring at the cavity edge. Decreasing the grain size by a factor of ten (right panel) produces a more radially extended dust structure.
4.4 Shadows
Figure2shows the formation of transient circumprimary discs in theRin = 50au calculations during the first 20 orbits, caused by
the clearing of the inner disc material. The orientation of these inner discs are highly sensitive to the orbit of the companion. For exam-ple, the circumprimary disc in calculation B3 is formed with major axis aligned east-west in our images (i.e. horizontal in Figure2) , while orbits R1 and R2 produce a disc aligned north-south (i.e.
ver-tical in Figure2) — a second piece of evidence favouring the red orbit family. Caution is required, however, since the inner disc pre-cesses with time, though on a timescale longer than our simulations (∼0.5Myr; e.g.Owen & Lai 2017). Furthermore, in ourRin= 90
[image:9.595.81.499.371.618.2]Figure 6.
Statistics of the multi-frequency morphological di↵erences inferred from Monte-Carlo (MC) simulations. All images
have been restored from
uvmem
models.
a)
: restored ATCA image at 34 GHz.
b)
: average of ATCA observations with 200
realizations of noise on the band 7 data.
c)
: average of the MC simulations for band 9
d)-g)
: di↵erent realizations of noise.
h)
: rms scatter of the band 9 simulations.
i)
: rms scatter of the band 7 simulations.
the following temperature profile:
T
= 70 K
,
if r
<
30 AU
,
or
(C1)
T
= 70 K(r
/
(30 AU)
0
.
5
if r
30 AU
.
However, setting the gas temperature to a representative
dust species in the outer disk (we chose the average
popu-lation of amorphous carbon grains) attenuates the depth
the underlying optical depth field. The decrements are
reproduced by the above prescription for the gas
temper-ature because the gas tempertemper-atures in the crescent, at
r
= 140 au, are
⇠
30 K, and cooler than the continuum
temperatures in the model, which reach 50 to 60 K. Thus
in this case the gas acts like a cold foreground on a
hot-ter continuum background, which afhot-ter continuum
sub-traction appears like foreground absorption. In fact, CO
at higher altitudes could be hotter than the background
0
0.02
0.04
dust column density [g/cm
2]
R2 + large dust
0
5×10
-30.01
0.015
0.02
dust column density [g/cm
2]
[image:10.595.65.530.84.602.2]R2 + medium dust
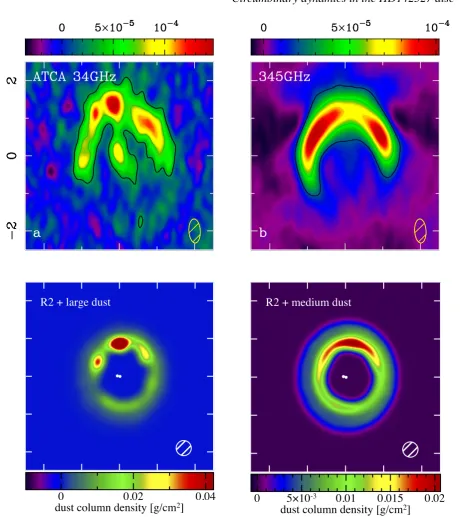
Figure 8.Horseshoe. Dust column density comparing observations (top) to our simulations (bottom). We show orbit R2 with grain sizes of 1 mm (‘large’) and 100µm (‘medium’) (bottom panels, left and right respectively) smeared to a beam size of 20 au (white circle). The larger grains (bottom left) show dust column densities consistent with the ATCA observations at cm wavelengths while the smaller grains (bottom right) produce an overdense ‘horseshoe’ in the dust surface density at the correct position angle to explain the ALMA observations (top right). Top row credit: Figure 6 ofCasassus et al.(2015b) ©AAS, reproduced with permission.
Figure6shows the resultant inner disc structure after 20 orbits (left), shown alongside the scattered light image taken from Aven-haus et al.(2017) (left). Despite the remaining uncertainty in the orbital dynamics the position angle of the expected shadow is con-sistent with the northern shadow seen in the scattered light image, and within 10◦of the southern shadow. A difference of 10◦is not significant — shadows do not exactly fall in the projected plane of the inner disc due to the vertical extension of the discs (Min
et al. 2017). We do not imply that this is theonlypossible orbital configuration which can explain the shadows — nor even the most probable — merely that it is possible to produce a satisfactory ori-entation of the inner disc to produce the correct shadow from our calculations. We also demonstrate that the orbital dynamics of the companion naturally produces a circumprimary disc with an ori-entation and size consistent with the structure invoked byMarino et al.(2015a) to explain the observed shadowing.
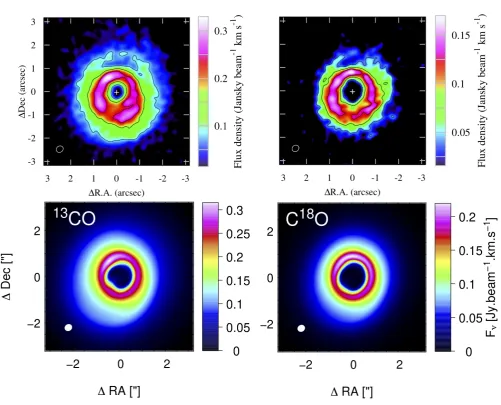
Figure 9.Gas. Predicted13CO J=3–2 and C18O J=3–2 emission (moment 0) from simulation R2 after 50 orbits (bottom two panels), compared toBoehler et al.(2017) ALMA data (top two panels; credit: Figure 1 ofBoehler et al.(2017) ©AAS, reproduced with permission). The ring-like feature seen in both spectral lines is reproduced in our simulations. The ‘broken ring’ effect seen in the observations is not reproduced in our models because we do not account for the temperature dip caused by the shadows from the circumprimary disc.
4.5 Dust horseshoe
Ragusa et al.(2017) found that dust horseshoes similar to those ob-served by ALMA could be naturally produced by eccentric cavities in gas and dust around binary stars. However, that paper assumed tightly coupled dust grains such that the dust structures merely re-flected those in the gas. Whether or not this is the case for the mm continuum emission in HD142527 (see discussion inCasassus et al. 2015b) depends on the Stokes number — the ratio of the dust stop-ping time to the disc orbital period.
Assuming subsonic Epstein drag the Stokes number depends only on the gas surface density, according to (Dipierro et al. 2015b)
St= 1
Σ 0.2g cm−2
−1
ρgrain 3g cm−3
sgrain
1mm
, (2)
whereρgrain is the intrinsic grain density andsgrain is the grain
size. Modelling dust-gas dynamics in discs is usually uncertain be-cause the gas surface density is poorly constrained, being measured
only from multiplying the dust continuum emission by a factor (typically 100). For HD142527 we are already confident in our as-sumed surface density profile because of our match to the measured gas mass inside the cavity and to the surface density profile (Fig.3). However, there remains uncertainty in the assumed CO-to-H2
con-version.
Our assumed gas disc mass of 0.01 Mcorresponds toΣ=
0.6 g cm−2 atR = Rin, giving a Stokes number for mm grains
of≈0.3 at 90 au and≈1at 300 au (see Fig.3). Thus we expect decoupling of grains in the outer disc, sinceSt= 1corresponds to
maximal radial drift (Weidenschilling 1977).
Since orbit R2 produces a cavity close to the observed size with a prominent asymmetry seen in the gas in the position angle similar to the observed mm horseshoe, we computed two additional simulations using grain sizes of1mm and 100µm, respectively. We set up dust disc initially betweenRin = 120andRout= 250
merely to avoid numerical problems during the initial disc response to the binary. This also ensures that any dust migration to the cavity edge occurs naturally rather than as a result of the initial conditions. Figure7shows the dust column density in these two simula-tions (left and right, respectively), shown after 62 and 63 binary orbits, respectively, such that the orbital phase of both the binary and the dust structures are consistent with the observations. We find that the dust in both simulations drifts radially, concentrating at the cavity edge within a few tens of orbits. The larger grains, with
St∼1, form a thin ring around the cavity edge (left panel). We also
observe dust grains collecting into azimuthally distinct structures, trapped by the pressure bumps at the locations where spiral arms in the gas cross the dust ring. Although these grains are nominally ‘mm-sized’ in our simulations, the resulting dust structures appear more similar to what is seen at cm wavelengths. Figure8shows a direct comparison with the ATCA 34 GHz image fromCasassus et al.(2015b) (top left shows the ATCA image; bottom left shows our simulation). To make this comparison we simply convolved our dust column density image to a beam size of 20 au (0.12”). In hind-sight this is not surprising, since the peak emission in wavelength is roughtly2πtimes the grain size.
Using grains ten times smaller produces slower migration to the cavity edge and, as a result, a more radially extended dust dis-tribution (right panel of Figure7). The asymmetry driven by the binary in the gas produces a horseshoe remarkably similar to the observed mm horseshoe. Figure8makes the direct comparison. The predicted continuum emission is shown in red in Figure11.
The main disagreement between the simulations and observa-tions concerns the prominent dip seen in the mm-horseshoe at a po-sition angle of∼10◦(top right). Caution is required in making this
comparison since our visualisation shown in Figure8assumes op-tically thin dust emission where spectral index variations show that the continuum emission is optically thick (Casassus et al. 2015b). Our models also do not account for any azimuthal variation in tem-perature. This is interesting, because a temperature decrement is indeed observed at this position angle caused by the shadow from the circumprimary disc. Such a temperature decrement will affect the dust emission and would need to be accounted for in making accurate radiative transfer predictions from our simulations. More-over, it suggests that thermodynamic effects from the shadow may be important (seeMontesinos et al. 2016).
Two conclusions stand out: i) decoupled dust dynamics around a binary-carved cavity can naturally explain the observed asymme-tries in HD142527 without recourse to vortices or additional com-panions; and ii) the distinct ‘blobs’ seen in the radio emission may be real and not just artefacts of noisy observations.
4.6 Gas density contrast
Casassus et al.(2015b) note that some of the asymmetry seen in the dust emission is also seen in the gas. To quantify this, Figure9 compares the predicted13CO J=3–2 and C18O J=3–2 (moment 0) emission maps from simulation R2 (bottom row) to the ALMA ob-servations recently published byBoehler et al.(2017) (top row; see alsoMuto et al. 2015). For both spectral lines we find a bright, asymmetric ring of emission surrounding the cavity at a radius be-tween 0.5 and 1” from the central source, as seen in the observa-tions.
The main source of disagreement is that we do not reproduce the two dips in emission at the position angles coincident with the scattered light shadows. This again suggests that the shadowing of the outer disc by the circumprimary disc needs to be accounted for
r [au]
vr
[km/s]
10 20 50 102
0 5 10
Figure 10.Fast radial flows. Maximum inflow velocity on the SPH particles binned as a function of radius, in our model R2 (red), compared to the radial velocity model used to fit the kinematic data (fromCasassus et al. 2015b; solid blue line). Fast radial flows of order 10 km/s occur naturally in the models caused by the streamers which penetrate the cavity.
in the CO emission. Our models suggest that the underlying gas density structure is more axisymmetric. If one neglects the dips caused by the shadows, then the contrast in emission around the cavity is similar between our simulations and the observations (i.e. roughly a factor of two).
Again, the close match with the observed line emission does not suggest alternative hypotheses other than the binary are needed.
4.7 Fast radial flows
Can the streamers seen in Figure2explain the fast radial flows? Figure10shows the radial velocity of the SPH particles, binned as a function of radial distance from the centre of mass (red line), com-pared to the model used to fit the kinematic data byCasassus et al. (2015b) (blue line). Inflow speeds can be seen to reach 10 km/s at a distance of 20–30 au, consistent with the ‘fast radial flows’ needed to fit the kinematic data. This suggests that these flows indeed orig-inate in the streams of material that feed the inner disc.
4.8 Gap-crossing filaments
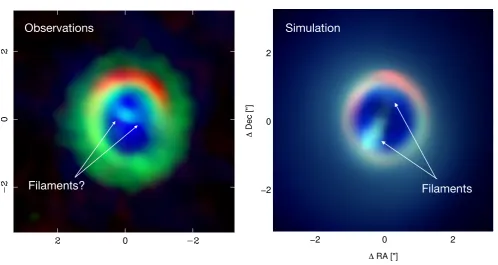
One of the great mysteries in HD142527 concerns the origin of the ‘filaments’ of gas seen across the cavity in HCO+ emission by Casassus et al.(2013). These were seen only in HCO+ emission in a particular range of velocity channels. Figure11compares the pre-dicted HCO+ J=4–3 emission from our simulations (right panel) to the corresponding figure fromCasassus et al.(2015a) (left panel). As in the observational figure, we show our predicted continuum map for the mm grains (extrapolated from our ”medium grains” dust simulation) in red, with the predicted HCO+ emission in se-lected velocity channels in green and the predicted12COemission in blue.
confir-12
Price et al.
−2 0 2
−2 0 2
Δ RA ["]
Δ
Dec ["]
[image:13.595.48.547.93.358.2]Filaments?
Figure 8. Summary of Cycle 0 band 7 observations, from MEM
maps, with continuum in red, HCO+(4-3) in green, and CO(3-2)
in blue. Velocities have been restricted to highlight the fainter structures seen in HCO+, which are otherwise dwarfed by the fast
HCO+central emission.
ing the UV radiation required to produce HCO
+in the
cavity, resulting in HCO
+filaments with wide opening
angles, as opposed to the thin protoplanetary
stream-ers predicted in hydrodynamic simulations. A problem
with this interpretation is that the outer ring is fairly
round in HCO
+, there are no obvious counterparts in
HCO
+of the scattered-light shadows. Perhaps this
re-flects a di↵erent production chain for HCO
+in the outer
disk, where it could be driven by charge-exchange with
cosmic-ray induced H
+3.
5. CONCLUSION
The new CO(6-5) data, along with the orientation of
the disk inferred from the scattered light shadows, have
allowed us to understand the intra-cavity kinematics in
HD 142527. Stellocentric accretion, starting from the
outer disk and reaching close to free-fall velocities, with
a steady-state mass flow fixed at the observed stellar
accretion, is consistent with the bulk properties of the
available CO isotopologue data. The observed HCO
+flows are also consistent with this stellocentric accretion,
but with an emissivity that is somehow modulated in
az-imuth. Fine structure in CO(6-5) also suggests non-axial
symmetry inside the cavity.
While the data are consistent with a continous, yet
abrupt and fast warp linking the two non-coplanar disks,
further observations are required to understand the
de-tailed structure of the intra-cavity kinematics and the
inner warp. For instance, the large relative inclination
observed between the inner and outer disks suggests that
the fast accretion could be due to disk tearing. If the
low-mass companion is contained in the inner disk and
is breaking the disks, then its orbit would also be highly
inclined with respect to the outer massive disk. The
com-panion may then undergo Kozai oscillations, with
high-eccentricity periods that may perhaps explain the large
cavity.
Based on observations acquired at the ALMA
Observa-tory, through program
ALMA#2011.0.00465.S. ALMA is
a partnership of ESO, NSF, NINS, NRC, NSC, ASIAA.
The Joint ALMA Observatory is operated by ESO,
AUI/NRAO and NAOJ. Financial support was provided
by Millennium Nucleus RC130007 (Chilean Ministry
of Economy), and additionally by FONDECYT grants
1130949, 1141175, 3140601, 3140634, 3140393.
S.M.
acknowledges CONICYT-PCHA / Magister Nacional /
2014-22140628. PR and VM acknowledge support from
CONICYT-ALMA grant alma-conicyt 31120006. AD
knowledges CONICYT-ALMA grant 31120007. PJA
ac-knowledges support from NSF award AST 1313021. MM
acknowledges CONICYT-Gemini grant 32130007. This
work was partially supported by the Chilean
supercom-puting infrastructure of the NLHPC (ECM-02).
APPENDIX
OBSERVATIONS
ALMA CO(6-5) data
Details on the instrumental setup are described in a companion article on the continuum emission (Casassus et al.
2015). We used self-calibration to improve the dynamic range of the continuum images. Applying the same gain
corrections to the line data also resulted in improved dynamic range. Before self calibration, the peak signal in the
systemic velocity channel reached 0.42 Jy beam
1, in natural weights (beam of 0.30
00⇥
0.25
00), with a noise level of
0.08 Jy beam
1clearly dominated by systematics rather than thermal noise. After self calibration, the peak signal
increased to 0.67 Jy beam
1, while the rms noise level decreased to 0.04 Jy beam
1.
Continuum subtraction under CO(6-5) was performed with a first-order fit to the continuum in the visibility domain.
The subset of channels neighboring the line was then split o↵ into another datafile, and subsequently re-sampled in
frequency into the LSRK frame.
The CO(6-5) dataset is presented in channel maps in Figs. 9 and 10, with three-channel bins. We chose to present
both the restored image and the underlying MEM model.
Observations
Simulation
Filaments
Figure 11.Streamers. Predicted HCO+ emission from simulation R2 (right; HCO+ in green), compared to the corresponding Cycle 0 image (left; credit: Figure 8 ofCasassus et al.(2015a) ©AAS, reproduced with permission). Both images show the mm dust horseshoe in red with HCO+ emission shown in green, with12CO emission in blue. A filament can be seen crossing the cavity in our simulations, similar to what is observed (albeit with a different position angle, indicating our orbit is not the correct one). We thus identify this feature with the streams of material feeding the primary across the circumbinary cavity.
mation that the dynamical interaction with the binary companion is the source of almost all of the mysterious features present in HD142527. It also suggests that HCO+ should be more widely em-ployed to detect intra-cavity flows in circumbinary discs. The main discrepancy our comparison with observations in Figure11is that the position angle of the stream differs from our simulation. This mainly indicates that orbit R2 is not the true orbit.
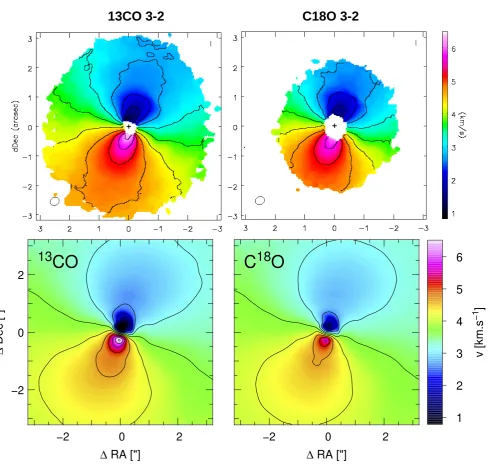
4.9 Kinematics
Finally, Figure12 compares the predicted moment 1 maps from simulation R2 in13CO and C18O emission (bottom row) with the equivalent maps taken fromBoehler et al.(2017) using ALMA data (top; see alsoMuto et al. 2015). Although the broad pattern is sim-ilar, there is a small discrepancy between the inner disc kinematics in the observations (top) compared to our simulations (bottom). We attribute this to the secular change in the disc orientation caused by the torque from the binary. This occurs because orbit R2 is not a stable binary-disc configuration. In particular, the torque from the binary on the outer disc vanishes only when the binary is either planar or perpendicular to the disc. It may therefore be fruitful in future investigations to search for orbits which match the observed data but are consistent with one of these arrangements (see discus-sion below).
5 DISCUSSION
If the observed companion can explain the otherwise unexplained features observed in HD142527 disc, this has potential implications for our understanding of mm-bright transition discs in general (c.f.
Casassus 2016;Owen 2016). These represent the fraction of tran-sition discs with large, mm-bright cavities and high mass accretion rates. Observations of transition discs with mass flow onto the cen-tral star continuing unabated despite the presence of a large cavity already led numerous authors to conclude that the transition disc population is not a homogeneous class (Najita et al. 2007; Alexan-der & Armitage 2007;Owen & Clarke 2012) and that the likely explanation for the mm-bright subclass is the presence of ‘objects massive enough to alter the accretion flow’ (Najita et al. 2015). Such an explanation was offered as far back as Skrutskie et al. (1990).
Cavities in transition discs are thought to be explained by ei-ther photoevaporation or companions — the latter eiei-ther by dynam-ical clearing, similar to gap opening, or by having simply used up the dust to form planets. We have shown that the cavity in HD142527 can be satisfyingly explained by dynamical interac-tion with the observed binary companion, hereby reclassifying it as a circumbinary disc. The streams of gas across the cavity pro-vide a natural explanation for the high accretion rate. Indeed, the average accretion rate in circumbinary discs withH/R ∼ 0.05
is expected to be similar (within a factor of a few) to that in a disc around a single object (e.g.Farris et al. 2014;Ragusa et al. 2016). In our simulations we measure a mass accretion rate of ≈10−7M
/yronto the primary, consistent with observational
es-timates of2(±1)×10−7M/yr(Mendigut´ıa et al. 2014).
rela-13CO 3-2
C18O 3-2
V
e
lo
c
it
y
V
e
lo
c
it
y
D
is
p
e
rs
io
n
Figure 5. Top: Maps of the velocity centroid for the13CO and C18O J=3-2 lines plotted between 0.8 to 6.5 kms 1. Contours
start from 1.75 km s 1 and are spaced by 0.5 kms 1. The systemic velocity is 3.75 km s 1. Bottom: map of the velocity
dispersion plotted between 0 to 0.65 km s 1. As a reference, contours have been drawn at 0.2, 0.4 and 0.6 km s 1.
This region coincides with the faint compact continuum
source discussed above (source c). It is also in this region
that
Casassus et al.
(
2013
) claimed to have observed gas
streamers in HCO+.
A
13CO J=3-2 line spectrum extracted from the region
of large velocity dispersion is shown on the top panel of
Figure
7
. The spectrum presents a large shoulder in
the velocity range -1.150 km s
1to 0.3 km s
1. The
integrated intensity map of the line emission in this
ve-locity range is displayed on the bottom panel of Figure
7
. Due to its association with the local dust continuum
emission
c, we argue that this emission might arise from
a planetary disk or streamers accreted through a giant
planet.
4.
ANALYSIS
4.1.
On the anti-correlation between dust and
molecular line emission
A decrease in the molecular line intensity from the disk
region corresponding to the dust continuum crescent has
−2
0
2
−2
0
2
−2
0
2
13
CO
∆
RA ["]
∆
Dec ["]
C
18
O
∆
RA ["]
v [km.s
−1
]
[image:14.595.55.546.93.563.2]1
2
3
4
5
6
Figure 12.Kinematics. Predicted moment 1 emission maps in13CO 3–2 and C18O from our simulation R2 (bottom left and right, respectively) compared to the observations with ALMA (top; credit:Boehler et al.(2017) ©AAS, reproduced with permission).
tively massive companions inside discs, given that the companion in this case is massive (stellar!) but was only discovered in 2012 due to its close proximity to the central star (Biller et al. 2012).
In a recent study,Ragusa et al.(2017) found that circumbi-nary discs could naturally explain the cavity-edge rings, asymme-tries and horseshoes seen in ALMA images of mm-bright transition discs including HD135344B, HD142527, SR21, DoAr 44 and Lk Hα330. Stellar mass companions were only required for the largest asymmetries (i.e., in HD142527). Substellar companions still pro-duce large cavities, but with lumpy rings around the cavity edge, rather than horseshoes. They found that the required companion masses were consistent with the observational upper limits for the above discs, with IRS 48 a possible exception.
There are already tentative detections of central
compan-ions in several other cases of discs with large cavities, including HD100546 (Quanz et al. 2013;Brittain et al. 2014;Currie et al. 2014;Quanz et al. 2015;Currie et al. 2015), LkCa 15 (Sallum et al. 2015) and even more intriguingly in MWC758 (Reggiani et al. 2017). There are strong hints in other cases (e.g. HD100453; Wag-ner et al. 2015). It does not require a great leap of imagination to suppose that the observed companions may be responsible for the central cavity, spiral arms, and other features in these cases too.
plan-ets, however, could perform a similar role in carving central holes in discs, as shown byRagusa et al.(2017).
No modelling is perfect, and despite some success, there are a number of remaining caveats to our modelling of HD142527. The main one from our perspective is the secular change in both the binary and outer disc orientation on long timescales (&100 or-bits). That is, the binary and the disc in our simulations are not in a steady configuration. Recent work byAly et al.(2015), Mar-tin & Lubow(2017) andZanazzi & Lai (2018) suggests that the equilibrium configuration for eccentric binaries inclined by more than∼60◦is for the disc to alignperpendicularto the binary (i.e. in a polar alignment). An interesting follow up would be to try to reproduce the disc features with a binary in such an equilibrium configuration, to see whether it can be ruled in or out (a binary or-bit with HD142527B at 90◦to the outer disc seems possible; see L16). An equilibrium configuration is likely given the typical align-ment timescale of order one thousand orbital periods (Martin & Lubow 2017) —105years in HD142527 — is much shorter than the disc lifetime (∼Myrs). Using better orbital constraints to de-termine whether the binary is in or out of equilibrium with the disc could therefore place strong constraints on formation models.
A second caveat is the mismatch in the orientation of the streams seen in HCO+ emission. Better orbital constraints should also help to solve this problem, since there are currently a wide range of possible orbits. The observed orientation of the streamers itself presents a powerful constraint on the orbit.
If large cavities are produced by eccentric massive compan-ions in the disc plane they should be observed, on average, at large projected separations, possibly even embedded in the disc (as ap-pears to be the case in HD100546). Polar orbits could help to solve this coincidence problem since for a face on disc (such as HD142527) the range in projected separation on the sky is much smaller. For the orbits we chose for HD142527, the companion spends 48%, 43% and 31% of its period at projected separations less than 20 au (0.13”) for orbits B1, B2 and B3, respectively. In orbits R1, R2 and R3 this fraction is 19%, 22% and 15%, respec-tively. So the coincidence problem is not too severe with our chosen orbits.
The most valuable observational follow up would thus be to better constrain the binary orbit and the companion mass, since this directly influences the modelling. Better observations of the inner disc similar to recent observations byAvenhaus et al.(2017) would be very valuable in helping to constrain its geometry, mass and orientation. Finally, we found that kinematic data provides a rich source of information on the cavity dynamic. In particular, HCO+ is a powerful probe of the streams of gas crossing the cavity. De-tection of similar streamers in other mm-bright transitional discs would be a powerful way to infer the presence of hidden compan-ions.
That such eccentric and inclined binaries appear to exist in na-ture opens many fruitful avenues for theoretical investigation into warped and inclined discs around binaries. For example,Owen & Lai(2017) proposed that large misalignments of inner and outer discs as in HD142527 may occur through a resonance between the precession period of the inner disc and the precession of the sec-ondary. However, they predict that the orbital plane of the binary should be aligned with the outer disc, which does not appear to be true in HD142527 based onL16and our models.
Another interesting direction (in our view) would be to try to infer the binary orbit from the spiral pattern induced around the cavity. This should be possible given sufficient observational con-straints on the temperature structure of the disc. Current analytic
prescriptions for spiral arms from companions work only in the linear regime (i.e. for low mass companions; seeOgilvie & Lubow 2002;Rafikov 2002), leading to potentially misleading conclusions regarding the number and mass of the required companions (e.g. Stolker et al. 2016).
The dynamical and thermodynamical influence of the circum-primary disc shadow on the outer disc in HD142527 also presents an interesting avenue for further investigation. For example, Mon-tesinos et al.(2016) showed that shadows can trigger additional spiral arms in the outer disc.
6 CONCLUSIONS
(i) The cavity, spiral arms, shadows, dust horseshoe, gap-crossing filaments and fast radial flows seen in HD142527 can all be explained, in part or in full, by the interaction with the observed central binary companion. HD142527 should therefore be firmly reclassified as a circumbinary rather than transitional disc.
(ii) Orbits drawn from the best fitting orbits considered byL16 readily produce a cavity of the required size in HD142527, imply-ing that the observed binary is likely the origin of the large≈90 au dust cavity in this disc. Constraints from the cavity size imply a binary semi-major axisa.50au.
(iii) Comparison of the spiral structure and shadows with the observations favours the ‘red’ family of orbits considered byL16 with the binary approaching periastron, with large eccentricitye= 0.6–0.7, and almost polar inclination with respect to the outer disc. (iv) Binary orbits from L16with the companion approaching periastron naturally produce an inclined circumprimary disc with major axis oriented north-south, fed by streams from the outer disc. This orientation of the inner disc is consistent with the radiative transfer model used byMarino et al.(2015a) to fit the shadows.
(v) We find radial velocities across the cavity of order 10 km/s, consistent with the observed ‘fast radial flows’. We thus offer an explanation for fast radial flows in terms of the streams of material connecting the inner and outer discs.
(vi) We find gas and dust are decoupled in HD142527. Dust mi-gration to the cavity edge produces features consistent with the ob-served dust emission, including the prominent mm-horseshoe.
Given that all of the features present in HD142527 are present in some or all mm-bright transition discs, explaining them may help to explain this class of discs in general. For example, spirals and shadows seen in scattered light around the∼45au dust cavity in the disc of HD135344B (Garufi et al. 2013) are best explained by an ‘inner dust ring’ inclined by 22◦and an ‘accretion funnel flow’ onto the star (Stolker et al. 2016). In the context of the model we have presented in this paper, these phrases sound eerily familiar.
ACKNOWLEDGEMENTS
and Discovery Projects DP130102078 and DP180104235. We ac-knowledge CPU time on Gstar/SwinStar at Swinburne University, funded by the Australian Government, and on the MonARCH clus-ter at Monash. NC acknowledges financial support from FONDE-CYT grant 3170680. JC and NC acknowledge Millenium Nucleus grant RC130007 (Chilean Ministry of Economy). GMK is sup-ported by the Royal Society as a University Research Fellow. JC ac-knowledges support from CONICYT-Chile through FONDECYT (1141175) and Basal (PFB0609) grants. We thank the anonymous referee for comments which have improved the manuscript.
REFERENCES
Alexander R. D., Armitage P. J., 2007,MNRAS,375, 500 Aly H., Dehnen W., Nixon C., King A., 2015,MNRAS,449, 65 Andrews S. M., et al., 2011,ApJ,732, 42
Artymowicz P., Lubow S. H., 1994,ApJ,421, 651
Ataiee S., Pinilla P., Zsom A., Dullemond C. P., Dominik C., Ghanbari J., 2013,A&A,553, L3
Avenhaus H., Quanz S. P., Schmid H. M., Meyer M. R., Garufi A., Wolf S., Dominik C., 2014,ApJ,781, 87
Avenhaus H., et al., 2017,AJ,154, 33 Baruteau C., Zhu Z., 2016,MNRAS,458, 3927
Bate M. R., Bonnell I. A., Price N. M., 1995, MNRAS,277, 362 Benisty M., et al., 2015,A&A,578, L6
Benisty M., et al., 2017,A&A,597, A42 Biller B., et al., 2012,ApJ,753, L38
Boehler Y., Weaver E., Isella A., Ricci L., Grady C., Carpenter J., Perez L., 2017,ApJ,840, 60
Brittain S. D., Carr J. S., Najita J. R., Quanz S. P., Meyer M. R., 2014,ApJ, 791, 136
Bryden G., Chen X., Lin D. N. C., Nelson R. P., Papaloizou J. C. B., 1999, ApJ,514, 344
Canovas H., M´enard F., Hales A., Jord´an A., Schreiber M. R., Casassus S., Gledhill T. M., Pinte C., 2013,A&A,556, A123
Canovas H., Caceres C., Schreiber M. R., Hardy A., Cieza L., M´enard F., Hales A., 2016,MNRAS,458, L29
Casassus S., 2016,PASA,33, e013
Casassus S., Perez M. S., Jord´an A., M´enard F., Cuadra J., Schreiber M. R., Hales A. S., Ercolano B., 2012,ApJ,754, L31
Casassus S., et al., 2013,Nature,493, 191 Casassus S., et al., 2015a,ApJ,811, 92 Casassus S., et al., 2015b,ApJ,812, 126
Christiaens V., Casassus S., Perez S., van der Plas G., M´enard F., 2014,ApJ, 785, L12
Christiaens V., et al., 2018, A&A, submitted Close L. M., et al., 2014,ApJ,781, L30
Cuadra J., 2016, in Resolving planet formation in the era of ALMA and extreme AO. Proceedings of the conference held 16-20 May, 2016 in Santiago, Chile, id.30. p. 30,doi:10.5281/zenodo.58297
Currie T., et al., 2014,ApJ,796, L30
Currie T., Cloutier R., Brittain S., Grady C., Burrows A., Muto T., Kenyon S. J., Kuchner M. J., 2015,ApJ,814, L27
D’Orazio D. J., Haiman Z., Duffell P., MacFadyen A., Farris B., 2016, MN-RAS,459, 2379
Dipierro G., Pinilla P., Lodato G., Testi L., 2015a,MNRAS,451, 5493 Dipierro G., Price D., Laibe G., Hirsh K., Cerioli A., Lodato G., 2015b,
MNRAS,453, L73
Dipierro G., Laibe G., Price D. J., Lodato G., 2016,MNRAS,459, L1 Dong R., Zhu Z., Rafikov R. R., Stone J. M., 2015,ApJ,809, L5 Draine B. T., 2003,ApJ,598, 1017
Dunhill A. C., Cuadra J., Dougados C., 2015,MNRAS,448, 3545 Espaillat C., Calvet N., D’Alessio P., Hern´andez J., Qi C., Hartmann L.,
Furlan E., Watson D. M., 2007,ApJ,670, L135
Espaillat C., et al., 2014,Protostars and Planets VI,pp 497–520 Facchini S., Lodato G., Price D. J., 2013,MNRAS,433, 2142
Farris B. D., Duffell P., MacFadyen A. I., Haiman Z., 2014,ApJ,783, 134 Fujiwara H., et al., 2006,ApJ,644, L133
Fukagawa M., Tamura M., Itoh Y., Kudo T., Imaeda Y., Oasa Y., Hayashi S. S., Hayashi M., 2006,ApJ,636, L153
Gaia Collaboration et al., 2016,A&A,595, A2
Garcia Lopez R., Natta A., Testi L., Habart E., 2006,A&A,459, 837 Garufi A., et al., 2013,A&A,560, A105
Guenther E. W., Esposito M., Mundt R., Covino E., Alcal´a J. M., Cusano F., Stecklum B., 2007,A&A,467, 1147
Ireland M. J., Kraus A. L., 2008,ApJ,678, L59 Kley W., Dirksen G., 2006,A&A,447, 369
Kohn S. A., Shkolnik E. L., Weinberger A. J., Carlberg J. K., Llama J., 2016,ApJ,820, 2
Lacour S., et al., 2016,A&A,590, A90 Laibe G., Price D. J., 2012a,MNRAS,420, 2345 Laibe G., Price D. J., 2012b,MNRAS,420, 2365 Lodato G., Price D. J., 2010,MNRAS,405, 1212 Lubow S. H., D’Angelo G., 2006,ApJ,641, 526 Lyra W., Lin M.-K., 2013,ApJ,775, 17
Marino S., Perez S., Casassus S., 2015a,ApJ,798, L44
Marino S., Casassus S., Perez S., Lyra W., Roman P. E., Avenhaus H., Wright C. M., Maddison S. T., 2015b,ApJ,813, 76
Martin R. G., Lubow S. H., 2017,ApJ,835, L28
Mendigut´ıa I., Fairlamb J., Montesinos B., Oudmaijer R. D., Najita J. R., Brittain S. D., van den Ancker M. E., 2014,ApJ,790, 21
Min M., Stolker T., Dominik C., Benisty M., 2017,A&A,604, L10 Miranda R., Lai D., 2015,MNRAS,452, 2396
Monaghan J. J., 2005,Reports on Progress in Physics,68, 1703
Montesinos M., Perez S., Casassus S., Marino S., Cuadra J., Christiaens V., 2016,ApJ,823, L8
Muto T., et al., 2015,PASJ,67, 122
Najita J. R., Strom S. E., Muzerolle J., 2007,MNRAS,378, 369 Najita J. R., Andrews S. M., Muzerolle J., 2015,MNRAS,450, 3559 Nealon R., Price D. J., Nixon C. J., 2015,MNRAS,448, 1526 Nixon C., King A., Price D., 2013,MNRAS,434, 1946 Ogilvie G. I., Lubow S. H., 2002,MNRAS,330, 950 Ohashi N., 2008,Ap&SS,313, 101
Owen J. E., 2016,PASA,33, e005
Owen J. E., Clarke C. J., 2012,MNRAS,426, L96 Owen J. E., Lai D., 2017,MNRAS,469, 2834
Pearce T. D., Wyatt M. C., Kennedy G. M., 2015,MNRAS,448, 3679 Perez S., et al., 2015,ApJ,798, 85
P´erez L. M., et al., 2016,Science,353, 1519 Pinilla P., et al., 2012,A&A,538, A114
Pinte C., M´enard F., Duchˆene G., Bastien P., 2006,A&A,459, 797 Pinte C., Harries T. J., Min M., Watson A. M., Dullemond C. P., Woitke P.,
M´enard F., Dur´an-Rojas M. C., 2009,A&A,498, 967
Pohl A., Pinilla P., Benisty M., Ataiee S., Juh´asz A., Dullemond C. P., Van Boekel R., Henning T., 2015,MNRAS,453, 1768
Pott J.-U., Perrin M. D., Furlan E., Ghez A. M., Herbst T. M., Metchev S., 2010,ApJ,710, 265
Price D. J., 2012,J. Comp. Phys.,231, 759
Price D. J., et al., 2018, preprint, (arXiv:1702.03930)
Quanz S. P., Amara A., Meyer M. R., Kenworthy M. A., Kasper M., Girard J. H., 2013,ApJ,766, L1
Quanz S. P., Amara A., Meyer M. R., Girard J. H., Kenworthy M. A., Kasper M., 2015,ApJ,807, 64
Quillen A. C., 2006,ApJ,640, 1078 Rafikov R. R., 2002,ApJ,572, 566 Raghavan D., et al., 2010,ApJS,190, 1
Ragusa E., Lodato G., Price D. J., 2016,MNRAS,460, 1243
Ragusa E., Dipierro G., Lodato G., Laibe G., Price D. J., 2017,MNRAS, 464, 1449
Reggiani M., et al., 2017, preprint, (arXiv:1710.11393)
Rice W. K. M., Armitage P. J., Wood K., Lodato G., 2006,MNRAS,373, 1619