http://www.scirp.org/journal/jct ISSN Online: 2151-1942
ISSN Print: 2151-1934
DOI: 10.4236/jct.2019.104022 Apr. 9, 2019 269 Journal of Cancer Therapy
Confounders in Adenoma Detection at Initial
Screening Colonoscopy: A Factor in the
Assessment of Racial Disparities as a Risk for
Colon Cancer
Yakira David
1,2*, Lorenzo Ottaviano
3, Jihye Park
4, Sadat Iqbal
1, Michelle Likhtshteyn
1,
Samir Kumar
1, Helen Lyo
1, Ayanna E. Lewis
3, Brandon E. Lung
3, Jesse T. Frye
3, Li Huang
3,
Ellen Li
3, Jie Yang
5, Laura Martello
1, Shivakumar Vignesh
1, Joshua D. Miller
3, Michele Follen
6,
Evan B. Grossman
1,71Department of Medicine, SUNY Downstate Medical Center, Brooklyn, NY, USA
2Department of Gastroenterology, Icahn School of Medicine at Mount Sinai, New York City, NY, USA 3Department of Medicine, Stony Brook University, Stony Brook, NY, USA
4Department of Applied Mathematics and Statistics, Stony Brook University, Stony Brook, NY, USA
5Department of Family, Population and Preventive Medicine, Stony Brook University, Stony Brook, NY, USA 6Department of Obstetrics and Gynecology, NYC HNC/Kings County, Brooklyn, NY, USA
7Department of Medicine, Division of Gastroenterology, NYC Health and Hospitals/Kings County, Brooklyn, NY, USA
Abstract
Background and Aims: The incidence and mortality of colorectal cancer is persistently highest in Black/African-Americans in the United States. While access to care, barriers to screening, and poverty might explain these findings, there in increased interest in examining biological factors that impact the co-lonic environment. Our group is examining biologic factors that contribute to disparities in development of adenomas prospectively. In preparation for this and to characterize a potential patient population, we conducted a retrospec-tive review of initial screening colonoscopies in a cohort of patients. Me-thods: A retrospective review was performed on initial average risk screening colonoscopies on patients (age 45 - 75 years) during 2012 at three institu-tions. Descriptive statistics and multivariable logistic regression models were used to examine the relationship between potential risk factors and the detec-tion of adenomas. Results: Of the 2225 initial screening colonoscopies 1495 (67.2%) were performed on Black/African-Americans and 566 (25.4%) on Caucasians. Multivariable logistic regression revealed that older age, male sex, current smoking and teaching gastroenterologists were associated with higher detection of adenomas and these were less prevalent among Black/African- Americas except for age. Neither race, ethnicity, BMI, diabetes mellitus, HIV How to cite this paper: David, Y.,
Otta-viano, L., Park, J., Iqbal, S., Likhtshteyn, M., Kumar, S., Lyo, H., Lewism A.E., Lung, B.E., Frye, J.T., Huang, L., Li, E., Yang, J., Martello, L., Vignesh, S., Miller, J.D., Fol-len, M. and Grossman, E.B. (2019) Con-founders in Adenoma Detection at Initial Screening Colonoscopy: A Factor in the Assessment of Racial Disparities as a Risk for Colon Cancer. Journal of Cancer Ther-apy, 10, 269-289.
https://doi.org/10.4236/jct.2019.104022
Received: March 5, 2019 Accepted: April 6, 2019 Published: April 9, 2019
Copyright © 2019 by author(s) and Scientific Research Publishing Inc. This work is licensed under the Creative Commons Attribution International License (CC BY 4.0).
http://creativecommons.org/licenses/by/4.0/
DOI: 10.4236/jct.2019.104022 270 Journal of Cancer Therapy nor insurance was associated with adenoma detection. Conclusion: In this sample, there was no association between race and adenoma detection. While this may be due to a lower prevalence of risk factors for adenomas in this sample, our findings were confounded by a lower detection rate by consultant gastroenterologists at one institution. The study allowed us to rectify the problem and characterize patients for future trials.
Keywords
Colorectal, Cancer, Screening, Adenoma, Quality
1. Introduction
Colorectal Cancer (CRC) is the fourth most common cancer in the United States (US) and second most lethal [1]. Most colon cancers develop via a multistep process involving a series of somatic genetic mutations and histopathologic changes that accumulate over time that is estimated to take approximately 10 - 15 years [2] [3] [4]. Consequently, screening with removal of adenomas and early detection of colorectal cancers has contributed to substantial decreases in the incidence and mortality of colorectal cancer in the United States over the past 10 years [5] [6] [7] [8].
Multiple studies have reported increased risk of colon cancer regardless of ra-cial group to be associated with age, male sex, family history in a first degree rel-ative, smoking, as well as diabetes mellitus and BMI which can be a reflection of diet and activity level [9] [10]. At the molecular level, inflammatory processes are associated with colon tumorigenesis [11]. We hypothesize that these factors also contribute to a higher incidence of precancerous colon polyps and sought to characterize the impact of these factors in our patients.
The incidence and mortality of colon cancer remains significantly higher in Blacks/African-Americans than all other races and ethnicities in this US [1] [12]. This persistent disparity is likely multifactorial in etiology. The incidence and risk of colon cancer is thought to be low in Africa. This may be a reflection of lower rates of detection due to lower screening rates. However investigators have suggested that the higher incidence in US Blacks/African-Americans may be due to biological risk factors as a result of gene-environment interactions [13] [14]
[15] [16]. Additionally, disparities in socioeconomic status could contribute to
unequal access to colon cancer screening here and abroad [17] [18]. We hypo-thesize that African-Americans have more risk factors for colorectal cancer and are also more likely to have a higher prevalence of adenomas.
DOI: 10.4236/jct.2019.104022 271 Journal of Cancer Therapy the New York Health and Hospital Corporation. DMC and Kings County are in central Brooklyn and SBUMC is in Long Island, New York. All three institutions educate residents and fellows and all three employ consultant gastroenterologists from time to time.
2. Methods
Collection of clinical data from initial screening colonoscopies performed in 2012
This study was approved by the Institutional Review Boards for all three in-stitutions (IRB # 802718 for DMC and Kings County, approved 07/21/2017; IRB # 966231 for SBUMC, approved 03/21/2017). Patients who underwent screening colonoscopies between January 1 and December 31, 2012, were identified using the endoscopy reporting software at each of the three institutions.
Patients age < 45 y or >75 y, a history of previous colonoscopy, a history of in-flammatory bowel diseases, known hereditary colorectal syndromes, detection of microscopic or macroscopic blood in stool and other alarm symptoms, detection of colonic masses or polyps on previous studies, were excluded from this analy-sis. We excluded colonoscopies that were incomplete (did not reach the cecum) and those associated with poor bowel preparation.
The clinical metadata was collected using the same data vocabulary at the three institutions and included: 1) age (y) at time of initial screening colonosco-py; 2) sex (male/female); 3) race (Black/Caucasian/Other); 4) ethnicity (Hispan-ic/non-Hispanic); 5) BMI (kg/m2); 6) diabetes mellitus (diagnosed, not diag-nosed); 7) smoking (current/ not current); 8) HIV-1 (diagnosed/not diagdiag-nosed); 9) gastroenterologist (teaching versus consultant); and 10) insurance status (Commercial, Medicare, Medicaid, Self-pay). Patients who had both Commer-cial and Medicare insurance were classified in the CommerCommer-cial category. Patients who had both Medicare and Medicaid insurance were classified in the Medicare category. Family history of colon cancer or a polyp in a first degree relative, was not included in the analysis since that data was unevenly collected.
2225 patients with colonoscopy screening were used in this analysis: DMC (N = 444, 20%), Kings County (N = 1134, 51%), SBUMC (N = 647, 29%). The out-comes of interest were: adenomas, advanced adenomas, and right colon adenomas.
Statistical analysis
DOI: 10.4236/jct.2019.104022 272 Journal of Cancer Therapy In each multivariable regression analysis, an OR > 1 indicates that one cate-gory has more risk of having adenoma detection than the reference catecate-gory, and OR < 1 indicates that one category has less risk of having adenoma detection than the reference category. Generalized linear mixed models considering pa-tients from the same institution as clusters were also considered. However, since there is no strong evidence that patients with same institution were highly cor-related, results from logistic regression models were only reported here. Statis-tical analysis was performed using SAS 9.4 and significance level was set at 0.05 (SAS Institute, Inc., Cary, NC).
3. Results
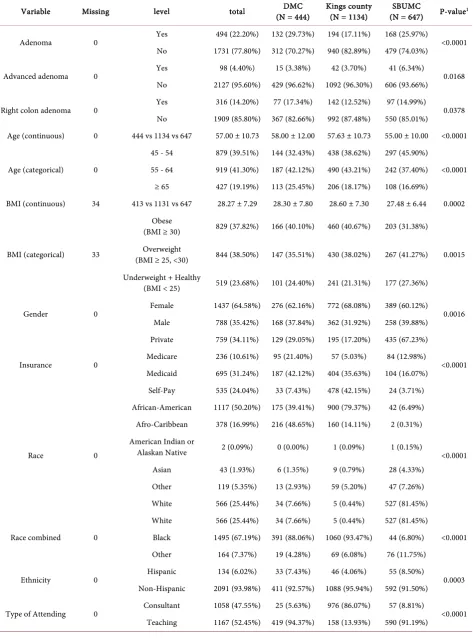
Table 1 displays the descriptive table for clinical outcomes and patients’
demo-graphics stratified by institution. Based on this table, marginally, all variables were significantly associated with the institutions. For example, 29.73% of pa-tients from DMC had adenoma, while 17.11% of papa-tients from Kings County had adenoma, and 25.97% of patients from SBUMC had adenoma (P-value1 < 0.0001).
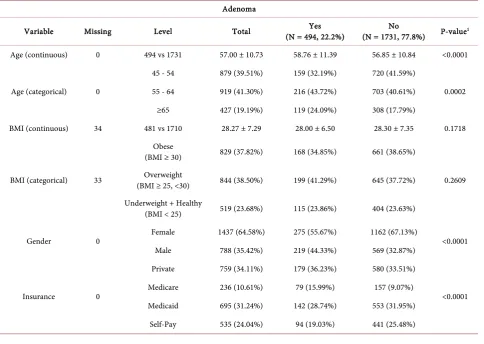
Table 2 describes patients’ demographics by the clinical outcomes of interest:
adenoma, advanced adenoma, and right colonic adenoma. Based on this table, marginally, age, gender, insurance, institution, race, type of attending, tobacco use, diabetes, and HIV-negative status were significantly associated with having an adenoma. For example, 28.54% of patients having adenoma had diabetes, while 23.74% of patients who do not have adenoma had diabetes (P-value = 0.0294). For advanced adenoma, institution, type of attending, fellow, and to-bacco use were marginally associated with having this outcome. For right colon adenoma, age, gender, insurance, institution, and type of attending were margi-nally associated with having this outcome.
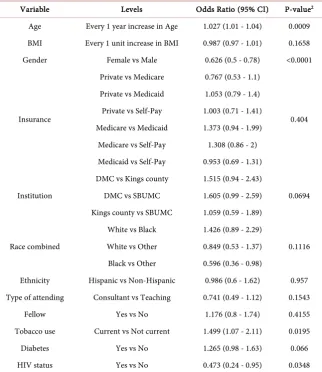
Table 3 shows the results of estimated Odds Ratios (ORs) and 95% confidence
intervals of potential risk factors for adenomas based on multivariable logistic regression model. After adjusting for other factors, age, gender, tobacco use, and HIV-negative status remain significantly associated with having an adenoma (P-values < 0.05). For example, female patients were significantly less likely to have adenoma than male patients (OR = 0.626, 95% CI: 0.5 - 0.78, P-value < 0.0001).
Table 4 shows the results of estimated ORs and 95% confidence intervals of
DOI: 10.4236/jct.2019.104022 273 Journal of Cancer Therapy
Table 1. Descriptive table for clinical outcomes and patients’ demographics by 3 institutions.
Variable Missing level total (N = 444) DMC Kings county (N = 1134) (N = 647) SBUMC P-value1
Adenoma 0 Yes 494 (22.20%) 132 (29.73%) 194 (17.11%) 168 (25.97%) <0.0001
No 1731 (77.80%) 312 (70.27%) 940 (82.89%) 479 (74.03%)
Advanced adenoma 0 Yes 98 (4.40%) 15 (3.38%) 42 (3.70%) 41 (6.34%) 0.0168
No 2127 (95.60%) 429 (96.62%) 1092 (96.30%) 606 (93.66%)
Right colon adenoma 0 Yes 316 (14.20%) 77 (17.34%) 142 (12.52%) 97 (14.99%) 0.0378
No 1909 (85.80%) 367 (82.66%) 992 (87.48%) 550 (85.01%)
Age (continuous) 0 444 vs 1134 vs 647 57.00 ± 10.73 58.00 ± 12.00 57.63 ± 10.73 55.00 ± 10.00 <0.0001
Age (categorical) 0
45 - 54 879 (39.51%) 144 (32.43%) 438 (38.62%) 297 (45.90%)
<0.0001
55 - 64 919 (41.30%) 187 (42.12%) 490 (43.21%) 242 (37.40%)
≥ 65 427 (19.19%) 113 (25.45%) 206 (18.17%) 108 (16.69%)
BMI (continuous) 34 413 vs 1131 vs 647 28.27 ± 7.29 28.30 ± 7.80 28.60 ± 7.30 27.48 ± 6.44 0.0002
BMI (categorical) 33
Obese
(BMI ≥ 30) 829 (37.82%) 166 (40.10%) 460 (40.67%) 203 (31.38%)
0.0015 Overweight
(BMI ≥ 25, <30) 844 (38.50%) 147 (35.51%) 430 (38.02%) 267 (41.27%) Underweight + Healthy
(BMI < 25) 519 (23.68%) 101 (24.40%) 241 (21.31%) 177 (27.36%)
Gender 0 Female 1437 (64.58%) 276 (62.16%) 772 (68.08%) 389 (60.12%) 0.0016
Male 788 (35.42%) 168 (37.84%) 362 (31.92%) 258 (39.88%)
Insurance 0
Private 759 (34.11%) 129 (29.05%) 195 (17.20%) 435 (67.23%)
<0.0001
Medicare 236 (10.61%) 95 (21.40%) 57 (5.03%) 84 (12.98%)
Medicaid 695 (31.24%) 187 (42.12%) 404 (35.63%) 104 (16.07%)
Self-Pay 535 (24.04%) 33 (7.43%) 478 (42.15%) 24 (3.71%)
Race 0
African-American 1117 (50.20%) 175 (39.41%) 900 (79.37%) 42 (6.49%)
<0.0001
Afro-Caribbean 378 (16.99%) 216 (48.65%) 160 (14.11%) 2 (0.31%)
American Indian or
Alaskan Native 2 (0.09%) 0 (0.00%) 1 (0.09%) 1 (0.15%)
Asian 43 (1.93%) 6 (1.35%) 9 (0.79%) 28 (4.33%)
Other 119 (5.35%) 13 (2.93%) 59 (5.20%) 47 (7.26%)
White 566 (25.44%) 34 (7.66%) 5 (0.44%) 527 (81.45%)
Race combined 0
White 566 (25.44%) 34 (7.66%) 5 (0.44%) 527 (81.45%)
<0.0001
Black 1495 (67.19%) 391 (88.06%) 1060 (93.47%) 44 (6.80%)
Other 164 (7.37%) 19 (4.28%) 69 (6.08%) 76 (11.75%)
Ethnicity 0 Hispanic 134 (6.02%) 33 (7.43%) 46 (4.06%) 55 (8.50%) 0.0003
Non-Hispanic 2091 (93.98%) 411 (92.57%) 1088 (95.94%) 592 (91.50%)
Type of Attending 0 Consultant 1058 (47.55%) 25 (5.63%) 976 (86.07%) 57 (8.81%) <0.0001
DOI: 10.4236/jct.2019.104022 274 Journal of Cancer Therapy
Continued
Fellow 0 Yes 247 (11.10%) 6 (1.35%) 132 (11.64%) 109 (16.85%) <0.0001
No 1978 (88.90%) 438 (98.65%) 1002 (88.36%) 538 (83.15%)
Tobacco use 68 Current 202 (9.36%) 53 (14.10%) 66 (5.82%) 83 (12.83%) <0.0001
Not current 1955 (90.64%) 323 (85.90%) 1068 (94.18%) 564 (87.17%)
Diabetes 0 Yes 552 (24.81%) 135 (30.41%) 339 (29.89%) 78 (12.06%) <0.0001
No 1673 (75.19%) 309 (69.59%) 795 (70.11%) 569 (87.94%)
HIV Status 1 Yes 85 (3.82%) 38 (8.56%) 42 (3.70%) 5 (0.77%) <0.0001
No 2139 (96.18%) 406 (91.44%) 1092 (96.30%) 641 (99.23%)
Insulin Use 7
Yes 165 (7.44%) 37 (8.45%) 114 (10.05%) 14 (2.17%)
<0.0001
No 380 (17.13%) 92 (21.00%) 225 (19.84%) 63 (9.75%)
No diabetes 1673 (75.43%) 309 (70.55%) 795 (70.11%) 569 (88.08%)
Metformin Use 8
Yes 365 (16.46%) 60 (13.70%) 253 (22.33%) 52 (8.05%)
<0.0001
No 179 (8.07%) 69 (15.75%) 85 (7.50%) 25 (3.87%)
No diabetes 1673 (75.46%) 309 (70.55%) 795 (70.17%) 569 (88.08%)
1For categorical variables, P-value was based on Chi-squared test with exact P-value from Monte Carlo simulation. For continuous variables, P-value was
[image:6.595.58.543.392.736.2]based on Wilcoxon rank sum test and median with IQR were reported. *Since 1 patient from DMC institution had BMI as “>30”, this patient was treated as having missing value when using BMI as continuous values.
Table 2. Descriptive table for patients’ demographics by 3 clinical outcomes.
Adenoma
Variable Missing Level Total (N = 494, 22.2%) Yes (N = 1731, 77.8%) No P-value1
Age (continuous) 0 494 vs 1731 57.00 ± 10.73 58.76 ± 11.39 56.85 ± 10.84 <0.0001
Age (categorical) 0
45 - 54 879 (39.51%) 159 (32.19%) 720 (41.59%)
0.0002
55 - 64 919 (41.30%) 216 (43.72%) 703 (40.61%)
≥65 427 (19.19%) 119 (24.09%) 308 (17.79%)
BMI (continuous) 34 481 vs 1710 28.27 ± 7.29 28.00 ± 6.50 28.30 ± 7.35 0.1718
BMI (categorical) 33
Obese
(BMI ≥ 30) 829 (37.82%) 168 (34.85%) 661 (38.65%)
0.2609 Overweight
(BMI ≥ 25, <30) 844 (38.50%) 199 (41.29%) 645 (37.72%)
Underweight + Healthy
(BMI < 25) 519 (23.68%) 115 (23.86%) 404 (23.63%)
Gender 0 Female 1437 (64.58%) 275 (55.67%) 1162 (67.13%) <0.0001
Male 788 (35.42%) 219 (44.33%) 569 (32.87%)
Insurance 0
Private 759 (34.11%) 179 (36.23%) 580 (33.51%)
<0.0001
Medicare 236 (10.61%) 79 (15.99%) 157 (9.07%)
Medicaid 695 (31.24%) 142 (28.74%) 553 (31.95%)
DOI: 10.4236/jct.2019.104022 275 Journal of Cancer Therapy
Continued
Institution 0
DMC 444 (19.96%) 132 (26.72%) 312 (18.02%)
<0.0001
Kings county 1134 (50.97%) 194 (39.27%) 940 (54.30%)
SBUMC 647 (29.08%) 168 (34.01%) 479 (27.67%)
Race 0
African-American 1117 (50.20%) 207 (41.90%) 910 (52.57%)
0.0005
Afro-Caribbean 378 (16.99%) 90 (18.22%) 288 (16.64%)
American Indian or
Alaskan Native 2 (0.09%) 0 (0.00%) 2 (0.12%)
Asian 43 (1.93%) 10 (2.02%) 33 (1.91%)
Other 119 (5.35%) 37 (7.49%) 82 (4.74%)
White 566 (25.44%) 150 (30.36%) 416 (24.03%)
Race combined 0
White 566 (25.44%) 150 (30.36%) 416 (24.03%)
0.0006
Black 1495 (67.19%) 297 (60.12%) 1198 (69.21%)
Other 164 (7.37%) 47 (9.51%) 117 (6.76%)
Ethnicity 0 Hispanic 134 (6.02%) 35 (7.09%) 99 (5.72%) 0.2604
Non-Hispanic 2091 (93.98%) 459 (92.91%) 1632 (94.28%)
Type of Attending 0 Consultant 1058 (47.55%) 181 (36.64%) 877 (50.66%) <0.0001
Teaching 1167 (52.45%) 313 (63.36%) 854 (49.34%)
Fellow 0 Yes 247 (11.10%) 60 (12.15%) 187 (10.80%) 0.4021
No 1978 (88.90%) 434 (87.85%) 1544 (89.20%)
Tobacco use 68 Current 202 (9.36%) 61 (12.79%) 141 (8.39%) 0.0036
Not current 1955 (90.64%) 416 (87.21%) 1539 (91.61%)
Diabetes 0 Yes 552 (24.81%) 141 (28.54%) 411 (23.74%) 0.0294
No 1673 (75.19%) 353 (71.46%) 1320 (76.26%)
HIV Status 1 Yes 85 (3.82%) 11 (2.23%) 74 (4.27%) 0.041
No 2139 (96.18%) 482 (97.77%) 1657 (95.73%)
Advanced adenoma
Variable Missing Level Total (N=98, 4.4%) Yes (N=2127, 95.6%) No P-value1
Age (continuous) 0 98 vs 2127 57.00 ± 10.73 57.46 ± 10.26 57.00 ± 10.78 0.4729
Age (categorical) 0
45 - 54 879 (39.51%) 33 (33.67%) 846 (39.77%)
0.4746
55 - 64 919 (41.30%) 45 (45.92%) 874 (41.09%)
≥65 427 (19.19%) 20 (20.41%) 407 (19.13%)
BMI (continuous) 34 98 vs 2093 28.27 ± 7.29 28.45 ± 7.30 28.20 ± 7.20 0.7217
BMI (categorical) 33
Obese
(BMI ≥ 30) 829 (37.82%) 34 (34.69%) 795 (37.97%)
0.5332 Overweight
(BMI ≥ 25, <30) 844 (38.50%) 43 (43.88%) 801 (38.25%)
Underweight + Healthy
DOI: 10.4236/jct.2019.104022 276 Journal of Cancer Therapy
Continued
Gender 0 Female 1437 (64.58%) 55 (56.12%) 1382 (64.97%) 0.0732
Male 788 (35.42%) 43 (43.88%) 745 (35.03%)
Insurance 0
Private 759 (34.11%) 31 (31.63%) 728 (34.23%)
0.0691
Medicare 236 (10.61%) 18 (18.37%) 218 (10.25%)
Medicaid 695 (31.24%) 25 (25.51%) 670 (31.50%)
Self-Pay 535 (24.04%) 24 (24.49%) 511 (24.02%)
Institution 0
DMC 444 (19.96%) 15 (15.31%) 429 (20.17%)
0.0168
Kings county 1134 (50.97%) 42 (42.86%) 1092 (51.34%)
SBUMC 647 (29.08%) 41 (41.84%) 606 (28.49%)
Race 0
African-American 1117 (50.20%) 41 (41.84%) 1076 (50.59%)
0.35
Afro-Caribbean 378 (16.99%) 17 (17.35%) 361 (16.97%)
American Indian or
Alaskan Native 2 (0.09%) 0 (0.00%) 2 (0.09%)
Asian 43 (1.93%) 1 (1.02%) 42 (1.97%)
Other 119 (5.35%) 8 (8.16%) 111 (5.22%)
White 566 (25.44%) 31 (31.63%) 535 (25.15%)
Race combined 0
White 566 (25.44%) 31 (31.63%) 535 (25.15%)
0.2252
Black 1495 (67.19%) 58 (59.18%) 1437 (67.56%)
Other 164 (7.37%) 9 (9.18%) 155 (7.29%)
Ethnicity 0 Hispanic 134 (6.02%) 5 (5.10%) 129 (6.06%) 0.6953
Non-Hispanic 2091 (93.98%) 93 (94.90%) 1998 (93.94%)
Type of Attending 0 Consultant 1058 (47.55%) 37 (37.76%) 1021 (48.00%) 0.047
Teaching 1167 (52.45%) 61 (62.24%) 1106 (52.00%)
Fellow 0 Yes 247 (11.10%) 19 (19.39%) 228 (10.72%) 0.0076
No 1978 (88.90%) 79 (80.61%) 1899 (89.28%)
Tobacco use 68 Current 202 (9.36%) 18 (18.37%) 184 (8.94%) 0.0034
Not current 1955 (90.64%) 80 (81.63%) 1875 (91.06%)
Diabetes 0 Yes 552 (24.81%) 29 (29.59%) 523 (24.59%) 0.2622
No 1673 (75.19%) 69 (70.41%) 1604 (75.41%)
HIV Status 1 Yes 85 (3.82%) 1 (1.02%) 84 (3.95%) 0.1801
No 2139 (96.18%) 97 (98.98%) 2042 (96.05%)
Right colon adenoma
Variable Missing Level Total (N = 316, 14.2%) Yes (N = 1909, 85.8%) No P-value1
Age (continuous) 0 316 vs 1909 57.00 ± 10.73 58.96 ± 10.49 57.00 ± 10.98 <0.0001
Age (categorical) 0
45 - 54 879 (39.51%) 98 (31.01%) 781 (40.91%)
0.002
55 - 64 919 (41.30%) 142 (44.94%) 777 (40.70%)
DOI: 10.4236/jct.2019.104022 277 Journal of Cancer Therapy
Continued
BMI (continuous) 34 305 vs 1886 28.27 ± 7.29 28.00 ± 6.70 28.30 ± 7.20 0.2358
BMI (categorical) 33
Obese
(BMI ≥ 30) 829 (37.82%) 106 (34.64%) 723 (38.34%)
0.4615 Overweight
(BMI ≥ 25, <30) 844 (38.50%) 123 (40.20%) 721 (38.23%)
Underweight + Healthy
(BMI < 25) 519 (23.68%) 77 (25.16%) 442 (23.44%)
Gender 0 Female 1437 (64.58%) 181 (57.28%) 1256 (65.79%) 0.0034
Male 788 (35.42%) 135 (42.72%) 653 (34.21%)
Insurance 0
Private 759 (34.11%) 110 (34.81%) 649 (34.00%)
0.0004
Medicare 236 (10.61%) 54 (17.09%) 182 (9.53%)
Medicaid 695 (31.24%) 89 (28.16%) 606 (31.74%)
Self-Pay 535 (24.04%) 63 (19.94%) 472 (24.72%)
Institution 0
DMC 444 (19.96%) 77 (24.37%) 367 (19.22%)
0.0378
Kings county 1134 (50.97%) 142 (44.94%) 992 (51.96%)
SBUMC 647 (29.08%) 97 (30.70%) 550 (28.81%)
Race 0
African-American 1117 (50.20%) 146 (46.20%) 971 (50.86%)
0.2208
Afro-Caribbean 378 (16.99%) 52 (16.46%) 326 (17.08%)
American Indian or
Alaskan Native 2 (0.09%) 0 (0.00%) 2 (0.10%)
Asian 43 (1.93%) 7 (2.22%) 36 (1.89%)
Other 119 (5.35%) 25 (7.91%) 94 (4.92%)
White 566 (25.44%) 86 (27.22%) 480 (25.14%)
Race combined 0
White 566 (25.44%) 86 (27.22%) 480 (25.14%)
0.0679
Black 1495 (67.19%) 198 (62.66%) 1297 (67.94%)
Other 164 (7.37%) 32 (10.13%) 132 (6.91%)
Ethnicity 0 Hispanic 134 (6.02%) 23 (7.28%) 111 (5.81%) 0.311
Non-Hispanic 2091 (93.98%) 293 (92.72%) 1798 (94.19%)
Type of Attending 0 Consultant 1058 (47.55%) 126 (39.87%) 932 (48.82%) 0.0032
Teaching 1167 (52.45%) 190 (60.13%) 977 (51.18%)
Fellow 0 Yes 247 (11.10%) 36 (11.39%) 211 (11.05%) 0.8588
No 1978 (88.90%) 280 (88.61%) 1698 (88.95%)
Tobacco use 68 Current 202 (9.36%) 35 (11.40%) 167 (9.03%) 0.1862
Not current 1955 (90.64%) 272 (88.60%) 1683 (90.97%)
Diabetes 0 Yes 552 (24.81%) 91 (28.80%) 461 (24.15%) 0.0764
No 1673 (75.19%) 225 (71.20%) 1448 (75.85%)
HIV Status 1 Yes 85 (3.82%) 6 (1.90%) 79 (4.14%) 0.056
No 2139 (96.18%) 309 (98.10%) 1830 (95.86%)
1For categorical variables, P-value was based on Chi-squared test with exact P-value from Monte Carlo simulation. For continuous variables, P-value was
DOI: 10.4236/jct.2019.104022 278 Journal of Cancer Therapy
Table 3. Estimated odds ratio and their 95% confidence intervals of all potential risk fac-tors for Adenoma based on multivariable logistic regression model (c-index: 0.647).
Variable Levels Odds Ratio (95% CI) P-value2
Age Every 1 year increase in Age 1.027 (1.01 - 1.04) 0.0009
BMI Every 1 unit increase in BMI 0.987 (0.97 - 1.01) 0.1658
Gender Female vs Male 0.626 (0.5 - 0.78) <0.0001
Insurance
Private vs Medicare 0.767 (0.53 - 1.1)
0.404 Private vs Medicaid 1.053 (0.79 - 1.4)
Private vs Self-Pay 1.003 (0.71 - 1.41) Medicare vs Medicaid 1.373 (0.94 - 1.99) Medicare vs Self-Pay 1.308 (0.86 - 2) Medicaid vs Self-Pay 0.953 (0.69 - 1.31)
Institution
DMC vs Kings county 1.515 (0.94 - 2.43)
0.0694
DMC vs SBUMC 1.605 (0.99 - 2.59)
Kings county vs SBUMC 1.059 (0.59 - 1.89)
Race combined
White vs Black 1.426 (0.89 - 2.29)
0.1116
White vs Other 0.849 (0.53 - 1.37)
Black vs Other 0.596 (0.36 - 0.98)
Ethnicity Hispanic vs Non-Hispanic 0.986 (0.6 - 1.62) 0.957
Type of attending Consultant vs Teaching 0.741 (0.49 - 1.12) 0.1543
Fellow Yes vs No 1.176 (0.8 - 1.74) 0.4155
Tobacco use Current vs Not current 1.499 (1.07 - 2.11) 0.0195
Diabetes Yes vs No 1.265 (0.98 - 1.63) 0.066
HIV status Yes vs No 0.473 (0.24 - 0.95) 0.0348
2P-value was based on type3 analysis from multivariable logistic regression model.
Table 4. Estimated odds ratio and their 95% confidence intervals of all potential risk fac-tors for advanced adenoma based on multivariable logistic regression model (c-index: 0.612).
Variable Levels Odds Ratio (95% CI) P-value2
Insurance
Private vs Medicare 0.448 (0.24 - 0.82)
0.0245 Private vs Medicaid 1.137 (0.66 - 1.95)
Private vs Self-Pay 0.875 (0.51 - 1.51)
Medicare vs Medicaid 2.54 (1.35 - 4.78)
Medicare vs Self-Pay 1.953 (1.03 - 3.7) Medicaid vs Self-Pay 0.769 (0.43 - 1.37)
Fellow Yes vs No 1.912 (1.13 - 3.24) 0.0158
Tobacco use Current vs Not current 2.362 (1.37 - 4.06) 0.0019
[image:10.595.211.539.548.711.2]DOI: 10.4236/jct.2019.104022 279 Journal of Cancer Therapy
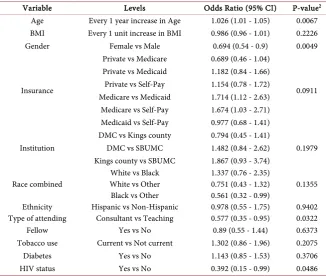
Table 5 shows the results of estimated ORs and 95% confidence intervals of
explanatory variables for having right colon adenoma based on multivariable lo-gistic regression model. After adjusting for other factors, age, gender, type of at-tending, and HIV-negative status were significantly associated with having a right colon adenoma. Older patients were significantly more likely to have right colon adenomas than younger patients (OR = 1.026, 95% CI: 1.01 - 1.05, P-value2 = 0.0067).
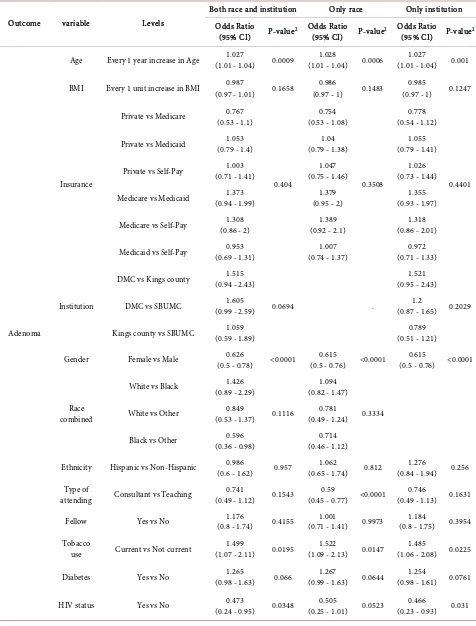
Table 6 demonstrates the extent to which the ADR of gastroenterologists
confounded the other risk factors. It describes the estimated odds ratio and their 95% confidence intervals of all potential risk factors for each clinical outcome based on three sets of multivariable logistic regression model (1st model: Both “race” and “institution” were used in the model; 2nd model: only “race” was used in the model; 3rd model: only “institution” was used in the model). The significant risk factors from all three multivariable regression models were con-sistent. For example, based on three sets of multivariable regression models, older people were more likely to have adenoma after controlling other factors (ORs > 1, P-values < 0.05). Negative HIV status was significantly associated with having an adenoma after controlling for other factors in 1st and 3rd model (P-values = 0.0348, 0.031, respectively). In contrast, HIV was not significantly associated with having an adenoma but the statistical significance was on the border-line (P-value = 0.0523) based on the 2nd model.
Table 5. Estimated odds ratio and their 95% confidence intervals of all potential risk fac-tors for right colon adenoma based on multivariable logistic regression model (c-index: 0.623).
Variable Levels Odds Ratio (95% CI) P-value2
Age Every 1 year increase in Age 1.026 (1.01 - 1.05) 0.0067
BMI Every 1 unit increase in BMI 0.986 (0.96 - 1.01) 0.2226
Gender Female vs Male 0.694 (0.54 - 0.9) 0.0049
Insurance
Private vs Medicare 0.689 (0.46 - 1.04)
0.0911 Private vs Medicaid 1.182 (0.84 - 1.66)
Private vs Self-Pay 1.154 (0.78 - 1.72)
Medicare vs Medicaid 1.714 (1.12 - 2.63)
Medicare vs Self-Pay 1.674 (1.03 - 2.71) Medicaid vs Self-Pay 0.977 (0.68 - 1.41)
Institution
DMC vs Kings county 0.794 (0.45 - 1.41)
0.1979
DMC vs SBUMC 1.482 (0.84 - 2.62)
Kings county vs SBUMC 1.867 (0.93 - 3.74)
Race combined White vs Other White vs Black 1.337 (0.76 - 2.35) 0.751 (0.43 - 1.32) 0.1355
Black vs Other 0.561 (0.32 - 0.99)
Ethnicity Hispanic vs Non-Hispanic 0.978 (0.55 - 1.75) 0.9402
Type of attending Consultant vs Teaching 0.577 (0.35 - 0.95) 0.0322
Fellow Yes vs No 0.89 (0.55 - 1.44) 0.6373
Tobacco use Current vs Not current 1.302 (0.86 - 1.96) 0.2075
Diabetes Yes vs No 1.143 (0.85 - 1.53) 0.3706
HIV status Yes vs No 0.392 (0.15 - 0.99) 0.0486
DOI: 10.4236/jct.2019.104022 280 Journal of Cancer Therapy
Table 6. Estimated odds ratio and their 95% confidence intervals of all potential risk factors for each clinical outcome based on multivariable logistic regression model.
Outcome variable Levels
Both race and institution Only race Only institution
Odds Ratio
(95% CI) P-value2 Odds Ratio (95% CI) P-value2 Odds Ratio (95% CI) P-value2
Adenoma
Age Every 1 year increase in Age (1.01 - 1.04) 1.027 0.0009 (1.01 - 1.04) 1.028 0.0006 (1.01 - 1.04) 1.027 0.001
BMI Every 1 unit increase in BMI (0.97 - 1.01) 0.987 0.1658 (0.97 - 1) 0.986 0.1483 (0.97 - 1) 0.985 0.1247
Insurance
Private vs Medicare (0.53 - 1.1) 0.767
0.404
0.754 (0.53 - 1.08)
0.3508
0.778 (0.54 - 1.12)
0.4401 Private vs Medicaid (0.79 - 1.4) 1.053 (0.79 - 1.38) 1.04 (0.79 - 1.41) 1.055
Private vs Self-Pay (0.71 - 1.41) 1.003 (0.75 - 1.46) 1.047 (0.73 - 1.44) 1.026
Medicare vs Medicaid (0.94 - 1.99) 1.373 (0.95 - 2) 1.379 (0.93 - 1.97) 1.355
Medicare vs Self-Pay (0.86 - 2) 1.308 (0.92 - 2.1) 1.389 (0.86 - 2.01) 1.318
Medicaid vs Self-Pay (0.69 - 1.31) 0.953 (0.74 - 1.37) 1.007 (0.71 - 1.33) 0.972
Institution
DMC vs Kings county (0.94 - 2.43) 1.515
0.0694 .
1.521 (0.95 - 2.43)
0.2029
DMC vs SBUMC (0.99 - 2.59) 1.605 (0.87 - 1.65) 1.2
Kings county vs SBUMC (0.59 - 1.89) 1.059 (0.51 - 1.21) 0.789
Gender Female vs Male (0.5 - 0.78) 0.626 <0.0001 (0.5 - 0.76) 0.615 <0.0001 (0.5 - 0.76) <0.0001 0.615
Race combined
White vs Black (0.89 - 2.29) 1.426
0.1116
1.094 (0.82 - 1.47)
0.3334 White vs Other (0.53 - 1.37) 0.849 (0.49 - 1.24) 0.781
Black vs Other (0.36 - 0.98) 0.596 (0.46 - 1.12) 0.714
Ethnicity Hispanic vs Non-Hispanic (0.6 - 1.62) 0.986 0.957 (0.65 - 1.74) 1.062 0.812 (0.84 - 1.94) 1.276 0.256
Type of
attending Consultant vs Teaching (0.49 - 1.12) 0.741 0.1543 (0.45 - 0.77) <0.0001 0.59 (0.49 - 1.13) 0.1631 0.746
Fellow Yes vs No (0.8 - 1.74) 1.176 0.4155 (0.71 - 1.41) 1.001 0.9973 (0.8 - 1.75) 1.184 0.3954
Tobacco
use Current vs Not current (1.07 - 2.11) 1.499 0.0195 (1.09 - 2.13) 1.522 0.0147 (1.06 - 2.08) 0.0225 1.485
Diabetes Yes vs No (0.98 - 1.63) 1.265 0.066 (0.99 - 1.63) 1.267 0.0644 (0.98 - 1.61) 0.0761 1.254
DOI: 10.4236/jct.2019.104022 281 Journal of Cancer Therapy
Continued
Advanced adenoma *Forward selection was
further considered
due to the limited event size
Insurance
Private vs Medicare (0.24 - 0.82) 0.448
0.0245
0.448 (0.24 - 0.82)
0.0245
0.448 (0.24 - 0.82)
0.0245 Private vs Medicaid (0.66 - 1.95) 1.137 (0.66 - 1.95) 1.137 (0.66 - 1.95) 1.137
Private vs Self-Pay (0.51 - 1.51) 0.875 (0.51 - 1.51) 0.875 (0.51 - 1.51) 0.875
Medicare vs Medicaid (1.35 - 4.78) 2.54 (1.35 - 4.78) 2.54 (1.35 - 4.78) 2.54
Medicare vs Self-Pay (1.03 - 3.7) 1.953 (1.03 - 3.7) 1.953 (1.03 - 3.7) 1.953
Medicaid vs Self-Pay (0.43 - 1.37) 0.769 (0.43 - 1.37) 0.769 (0.43 - 1.37) 0.769
Fellow Yes vs No (1.13 - 3.24) 1.912 0.0158 (1.13 - 3.24) 1.912 0.0158 (1.13 - 3.24) 0.0158 1.912
Tobacco use Current vs Not current (1.37 - 4.06) 2.362 0.0019 (1.37 - 4.06) 2.362 0.0019 (1.37 - 4.06) 0.0019 2.362
Right colon adenoma
Age Every 1 year increase in Age (1.01 - 1.05) 1.026 0.0067 (1.01 - 1.05) 1.027 0.005 (1.01 - 1.04) 0.0077 1.026
BMI Every 1 unit increase in BMI (0.96 - 1.01) 0.986 0.2226 (0.96 - 1.01) 0.986 0.2192 (0.96 - 1.01) 0.1789 0.985
Insurance
Private vs Medicare (0.46 - 1.04) 0.689
0.0911
0.676 (0.45 - 1.02)
0.1334
0.698 (0.46 - 1.05)
0.0994 Private vs Medicaid (0.84 - 1.66) 1.182 (0.79 - 1.54) 1.105 (0.84 - 1.66) 1.179
Private vs Self-Pay (0.78 - 1.72) 1.154 (0.73 - 1.58) 1.074 (0.79 - 1.74) 1.174
Medicare vs Medicaid (1.12 - 2.63) 1.714 (1.07 - 2.49) 1.635 (1.1 - 2.58) 1.689
Medicare vs Self-Pay (1.03 - 2.71) 1.674 (0.99 - 2.54) 1.588 (1.04 - 2.71) 1.68
Medicaid vs Self-Pay (0.68 - 1.41) 0.977 (0.68 - 1.4) 0.971 (0.69 - 1.44) 0.995
Institution
DMC vs Kings county (0.45 - 1.41) 0.794
0.1979
0.791 (0.45 - 1.4)
0.3305
DMC vs SBUMC (0.84 - 2.62) 1.482 (0.79 - 1.69) 1.156
Kings county vs SBUMC (0.93 - 3.74) 1.867 (0.87 - 2.46) 1.461
Gender Female vs Male (0.54 - 0.9) 0.694 0.0049 (0.54 - 0.89) 0.69 0.0043 (0.53 - 0.88) 0.681 0.003
Race combined
White vs Black (0.76 - 2.35) 1.337
0.1355
0.917 (0.65 - 1.3)
0.2423 White vs Other (0.43 - 1.32) 0.751 (0.37 - 1.08) 0.636
DOI: 10.4236/jct.2019.104022 282 Journal of Cancer Therapy
Continued
Ethnicity Hispanic vs Non-Hispanic (0.55 - 1.75) 0.978 0.9402 (0.59 - 1.85) 1.043 0.8865 (0.82 - 2.16) 0.2545 1.328
Type of
attending Consultant vs Teaching (0.35 - 0.95) 0.577 0.0322 (0.53 - 0.98) 0.718 0.0354 (0.35 - 0.96) 0.0331 0.58
Fellow Yes vs No (0.55 - 1.44) 0.89 0.6373 (0.66 - 1.5) 0.996 0.9851 (0.55 - 1.45) 0.6509 0.895
Tobacco
use Current vs Not current (0.86 - 1.96) 1.302 0.2075 (0.84 - 1.9) 1.266 0.2578 (0.86 - 1.95) 0.2206 1.292
Diabetes Yes vs No (0.85 - 1.53) 1.143 0.3706 (0.86 - 1.55) 1.155 0.3326 (0.85 - 1.52) 0.3861 1.138
HIV status Yes vs No (0.15 - 0.99) 0.392 0.0486 (0.16 - 1.02) 0.402 0.0544 (0.15 - 0.97) 0.0437 0.384
2P-value was based on type3 analysis from multivariable logistic regression model.
4. Discussion
In this study our hypothesis that older age, male sex and current smoking were associated with a higher risk of detecting anadenoma was confirmed. These findings concur with those observed in a large study conducted by Kaiser Per-manente and a meta-analysis of 18 studies examining risk factors for colon po-lyps [19] [20].
Given that Black/African-Americans have a higher incidence of colon cancer, our pretest hypothesis was that Black/African-American race would be asso-ciated with a higher risk of detecting adenomas. However, in the univariate analysis, Caucasian race was associated with a higher risk and in the multivaria-ble analysis race was not significantly associated with the risk of detecting ana-denoma. A similar finding was noted in a smaller study among uninsured pa-tients in New York [21] but is contrary to other larger studies which demon-strated an increased adenoma risk among Black/African-Americans [22] [23]
[24] [25]. There are several possible explanations for this finding including
dif-ferences in sex, smoking status, genetic background and adenoma detection rates of the gastroenterologist.
DOI: 10.4236/jct.2019.104022 283 Journal of Cancer Therapy Another factor that likely contributed to the lack of association between race and adenomas is that the analysis may have been confounded by significant dif-ferences in the ADR of the gastroenterologists performing the procedures. A significantly higher proportion of colonoscopies among Black/African-American patients was performed by non-teaching or consultant gastroenterologists who had a significantly lower ADR at one of the three institutions. A recent study on interval colon cancer in Medicare enrollees noted that a higher proportion of black persons (52.8%) than white persons (46.2%) received colonoscopies from physicians with a lower Polyp Detection Rate [28]. This rate was significantly associated with interval CRC risk.
A recent joint task force of the American College of Gastroenterology and the American Society of Gastrointestinal Endoscopy recommended ADR bench-marks of 25% for all patients and sex-specific rates of 30% for men and 20% for women [29]. Our study included colonoscopies performed during 2012, when the benchmark adenoma detection rate was 20% overall (15% female and 25% male). Our finding of a significant difference in ADR between teaching and con-tracted consultant gastroenterologists reinforces the concept that detection of colon polyps is operator dependent [30] [31] as we controlled for the patient factors that contribute to lower ADR such as bowel prep quality and cecal intu-bation rate. Unfortunately cecal withdrawal time was not recorded consistently so we were unable to control for this.
Various colonoscopy screening programs have been implemented to improve access of uninsured and minority patients to screening colonoscopies [32] [33]. While rates of colonoscopy completion have been used as measures of success of these programs, this finding in our study indicates the importance of continued surveillance of the quality of these colonoscopies to ensure that the optimal ben-efit is being achieved. Implementation of quality metric monitoring and direct feedback to gastroenterologists has been shown to improve ADR [34] [35] and this has been implemented at all the institutions in this study.
The lack of any association with Black/African-American race and proximal adenoma is contrary to the observed distribution of right sided colon cancers in this population [20] [36] [37] [38] [39] [40] and concurs with the findings of a similar study conducted by Freidburg et al. [41]. Either sample size or operator dependence could also have affected our results regarding the detection of proximal adenomas.
There have been conflicting observations of the prevalence of advanced ade-nomas in Black/African-American patients [39] [40] [41] and no association was observed in our study. The effect of operator dependence may have had less of an effect for this metric since most of the advanced adenomas were larger in size. One study has suggested that advanced adenoma detection is independent of
ADR [42].
DOI: 10.4236/jct.2019.104022 284 Journal of Cancer Therapy multiple societies [44]. However in our study the median age of initial screening among Black/African American patients was significantly higher than Caucasian patients. One reason for this is that acceptance of screening colonoscopies may be lower than the alternative of annual fecal immunochemical testing (FIT) in the Black/African/American population [45]. Furthermore it should be noted that current programs supporting free colorectal screening (largely FIT based), do not support initiating screening for individuals under the age of 50 [46].
Although it is hypothesized that HIV infection increases the risk of Non-AIDS defining malignancies [47], a meta-analysis of previous studies shows no associ-ation between HIV infection and colorectal cancer [48]. Conflicting results have been reported regarding the relationship between HIV infection and the detec-tion of adenoma [49] [50] [51]. In our study, no association between adenomas was observed in HIV-infected individuals. Discrepant findings may be as a result of the small number of HIV-infected patients in these studies, and may also be as a result of lower CRC screening rates among HIV-infected patients [52].
One of the major strengths of this study is the sample size and the representa-tion of Black/African-Americans in the sample which allowed for comparisons of multiple variables with the Caucasian population. Additionally, the exclusion criteria ensured that only patients with average risk screening colonoscopies were included. The exclusion criteria also removed other determinants of ADR as incomplete studies and those with inadequate prep.
A major limitation of our study is the variation in ADR due to the type of gas-troenterologist during 2012 which would have impacted the effect of other va-riables on detection of adenomas. Additionally, there are recent observations that some proximal serrated adenomas may have been misclassified as hyper-plastic polyps and this is variable amongst pathologists [53] [54] [55]. Due to the retrospective design of the study we were unable to control for this variability in pathologists. In our analysis we excluded all hyperplastic polyps regardless of site which may have resulted in an underestimation of adenoma.
5. Conclusion
DOI: 10.4236/jct.2019.104022 285 Journal of Cancer Therapy
Acknowledgements
We wish to thank all of the patients who contributed to this study and will con-tinue to contribute to further studies. We thank Dr Moro Salifu for facilitating the collaboration between Stony Brook University and SUNY Downstate Medi-cal Center. We also thank Jennifer Caceres, MD, Karthik Raghunathan, MD, Kirolos Iskander, MD, Michael Mann, Khalid Awwal for their assistance with data collection. We also acknowledge the biostatistical consultation and biosta-tistical support provided by the Biostabiosta-tistical Consulting Core at School of Med-icine, Stony Brook University. We would also like to thank those at NYC HHC Corp who reviewed and made constructive comments: Machelle Allen, MD, Steven Pulitzer, MD and Wendy Wilcox, MD.
Specific Author Contributions
Study concept and design: Joshua Miller, Ellen Li, Yakira David, Lorenzo Otta-viano. Data collection: Yakira David, Ellen Li, Lorenzo Ottaviano, Michelle Likhtshteyn, Sadat Iqbal, Samir Kumar, Brandon Lung, Helen Lyo, Jesse T. Frye, Ayanna E. Lewis. Analysis and Interpretation of Data: Ellen Li, Jihye Park, Jie Yang, Yakira David, Joshua Miller, Lorenzo Ottaviano,. Drafting of the Manu-script: Ellen Li, Yakira David, Michele Follen, Evan Grossman. Critical Review for Important Intellectual Content: Joshua Miller, Lorenzo Ottaviano, Shiva-kuarVignesh, Evan Grossman, Laura Martello, Ayanna E. Lewis, Michele Follen. Study Supervision: Laura Martello, Joshua Miller, Ellen Li, ShivakumarVignesh, Evan Grossman.
Financial Support
NCI P20 CA192994 (E.L.), Simons Foundation (E.L.), Stony Brook FUSION Seed Grant Award (J.D.M.). The work conducted is independent of the funding source.
Guarantor of Article
Evan Grossman MD.
Conflicts of Interest
The authors declare no conflict of interest.
References
[1] Howlander, N.N.A., Krapcho, M., Miller, D., Bishop, K., Kosary, C.L., Yu, M., Ruhl, J., Tatalovich, Z., Mariotto, A., Lewis, D.R., Chen, H.S., Feuer, E.J. and Cronin, K.A. (2016) SEER Cancer Statistics Review, 1975-2014. Institute NC, Bethesda, MD. [2] Haggar, F.A. and Boushey, R.P. (2009) Colorectal Cancer Epidemiology: Incidence,
Mortality, Survival, and Risk Factors. Clinics in Colon and Rectal Surgery, 22, 191-197. https://doi.org/10.1055/s-0029-1242458
DOI: 10.4236/jct.2019.104022 286 Journal of Cancer Therapy
Involved in Colorectal Cancer: Implications for Disease Behavior and Prevention.
International Journal of Molecular Sciences, 14, 16365-16385.
https://doi.org/10.3390/ijms140816365
[4] Pino, M.S. and Chung, D.C. (2010) The Chromosomal Instability Pathway in Colon Cancer. Gastroenterology, 138, 2059-2072.
https://doi.org/10.1053/j.gastro.2009.12.065
[5] Zauber, A.G. (2015) The Impact of Screening on Colorectal Cancer Mortality and Incidence—Has It Really Made a Difference? Digestive Diseases and Sciences, 60, 681-691.
[6] Lin, O.S., Kozarek, R.A. and Cha, J.M. (2014) Impact of Sigmoidoscopy and Colo-noscopy on Colorectal Cancer Incidence and Mortality: An Evidence-Based Review of Published Prospective and Retrospective Studies. Intestinal Research, 12, 268-274. https://doi.org/10.5217/ir.2014.12.4.268
[7] Shaukat, A. and Church, T.R. (2013) Colorectal-Cancer Incidence and Mortality af-ter Screening. The New England Journal of Medicine, 369, 2355.
https://doi.org/10.1056/NEJMoa1300720
[8] Shaukat, A., Mongin, S.J., Geisser, M.S., et al. (2013) Long-Term Mortality after Screening for Colorectal Cancer. The New England Journal of Medicine, 369, 1106-1114. https://doi.org/10.1056/NEJMoa1300720
[9] Johnson, C.M., Wei, C., Ensor, J.E., et al. (2013) Meta-Analyses of Colorectal Can-cer Risk Factors. Cancer Causes and Control, 24, 1207-1222.
https://doi.org/10.1007/s10552-013-0201-5
[10] Giovannucci, E. and Willett, W.C. (1994) Dietary Factors and Risk of Colon Cancer.
Annals of Medicine, 26, 443-452. https://doi.org/10.3109/07853899409148367
[11] Ullman, T.A. and Itzkowitz, S.H. (2011) Intestinal Inflammation and Cancer. Gas-troenterology, 140, 1807-1816. https://doi.org/10.1053/j.gastro.2011.01.057
[12] Siegel, R., Naishadham, D. and Jemal, A. (2012) Cancer Statistics, 2012. CA: A Cancer Journal for Clinicians, 62, 10-29. https://doi.org/10.3322/caac.20138
[13] O’Keefe, S.J.D., Li, J.V., Lahti, L., et al. (2015) Fat, Fibre and Cancer Risk in African Americans and Rural Africans. Nature Communications, 6, 6342.
https://doi.org/10.1038/ncomms7342
[14] O'Keefe, S.J., Chung, D., Mahmoud, N., et al. (2007) Why Do African Americans Get More Colon Cancer than Native Africans? The Journal of Nutrition, 137, 175S-182S.
[15] Brim, H. and Ashktorab, H. (2016) Genomics of Colorectal Cancer in African Americans. Journal of Next Generation Sequencing and Applications, 3, 133.
https://doi.org/10.4172/2469-9853.1000133
[16] Li, E., Ji, P., Ouyang, N., et al. (2014) Differential Expression of miRNAs in Colon Cancer between African and Caucasian Americans: Implications for Cancer Racial Health Disparities. International Journal of Oncology, 45, 587-594.
https://doi.org/10.3892/ijo.2014.2469
[17] Dimou, A., Syrigos, K.N. and Saif, M.W. (2009) Disparities in Colorectal Cancer in African-Americans vs Whites: Before and after Diagnosis. World Journal of Gas-troenterology 15, 3734-3743. https://doi.org/10.3748/wjg.15.3734
[18] Ollberding, N.J., Nomura, A.M., Wilkens, L.R., Henderson, B.E. and Kolonel, L.N. (2011) Racial/Ethnic Differences in Colorectal Cancer Risk: The Multiethnic Cohort Study. International Journal of Cancer, 129, 1899-1906.
DOI: 10.4236/jct.2019.104022 287 Journal of Cancer Therapy
[19] Heitman, S.J., Ronksley, P.E., Hilsden, R.J., et al. (2009) Prevalence of Adenomas and Colorectal Cancer in Average Risk Individuals: A Systematic Review and Me-ta-Analysis. Clinical Gastroenterology and Hepatology, 7, 1272-1278.
https://doi.org/10.1016/j.cgh.2009.05.032
[20] Corley, D.A., Jensen, C.D., Marks, A.R., et al. (2013) Variation of Adenoma Preva-lence by Age, Sex, Race, and Colon Location in a Large Population: Implications for Screening and Quality Programs. Clinical Gastroenterology and Hepatology, 11, 172-180. https://doi.org/10.1016/j.cgh.2012.09.010
[21] Collazo, T.H., Jandorf, L., Thelemaque, L., et al. (2015) Screening Colonoscopy among Uninsured and Underinsured Urban Minorities. Gut and Liver, 9, 502-508.
https://doi.org/10.5009/gnl14039
[22] Nouraie, M., Hosseinkhah, F., Zamanifekri, B., et al. (2010) Clinicopathological Features Colon Polyps from African-Americans. Digestive Diseases and Sciences, 55, 1442-1449. https://doi.org/10.1007/s10620-010-1133-5
[23] Thornton, J.G., Morris, A.M., Thornton, J.D., et al. (2007) Racial Variation in Co-lorectal Polyp and Tumor Location. Journal of the National Medical Association, 99, 723-728.
[24] Rex, D.K., Khan, A.M., Shah, P., Newton, J. and Cummings, O.W. (2000) Screening Colonoscopy in Asymptomatic Average-Risk African Americans. Gastrointestinal Endoscopy, 51, 524-527. https://doi.org/10.1016/S0016-5107(00)70283-5
[25] Lebwohl, B., Capiak, K., Neugut, A.I. and Kastrinos, F. (2012) Risk of Colorectal Adenomas and Advanced Neoplasia in Hispanic, Black and White Patients Under-going Screening Colonoscopy. Alimentary Pharmacology and Therapeutics, 35, 1467-1473. https://doi.org/10.1111/j.1365-2036.2012.05119.x
[26] Kings County Hospital (2013) Community Health Needs Assessment and Imple-mentation Strategy.
[27] Alvarez, A., Tandon, K., Castro, F.J.S., et al. (2016) Comparison of Adenoma Detec-tion Rates in Afro-Caribbeans and Non-Hispanic Whites Undergoing First Screen-ing Colonoscopy. The Southern Medical Journal, 109, 277-281.
https://doi.org/10.14423/SMJ.0000000000000456
[28] Fedewa, S.A., Flanders, W.D., Jemal, A., et al. (2018) Racial and Ethnic Disparities in Interval Colorectal Cancer Incidence: A Population-Based Cohort Study. Annals of Internal Medicine, 166, 857-866. https://doi.org/10.7326/M16-1154
[29] Rex, D.K., Bond, J.H., Winawer, S., et al. (2002) Quality in the Technical Perfor-mance of Colonoscopy and the Continuous Quality Improvement Process for Co-lonoscopy: Recommendations of the U.S. Multi-Society Task Force on Colorectal Cancer. The American Journal of Gastroenterology, 97, 1296-1308.
[30] Adler, A., Wegscheider, K., Lieberman, D., et al. (2013) Factors Determining the Quality of Screening Colonoscopy: A Prospective Study on Adenoma Detection Rates, from 12,134 Examinations (Berlin Colonoscopy Project 3, BECOP-3). Gut, 62, 236-241. https://doi.org/10.1136/gutjnl-2011-300167
[31] Mohammed, N. and Subramanian, V. (2013) Screening Colonoscopy: Should We Focus More on Technique and Less on Technology? F1000Prime Reports, 5, 32. [32] Centers for Disease Control and Prevention (2015) Cancer Prevention Works:
Spot-light on Year 1 of CDC’s Colorectal Cancer Control Program.
DOI: 10.4236/jct.2019.104022 288 Journal of Cancer Therapy https://doi.org/10.1002/cncr.29595
[34] Gurudu, S.R., Boroff, E.S., Crowell, M.D., et al. (2018) Impact of Feedback on Ade-noma Detection Rates: Outcomes of Quality Improvement Program. Journal of Gastroenterology and Hepatology, 33, 645-649. https://doi.org/10.1111/jgh.13984
[35] Kahi, C.J., Ballard, D., Shah, A.S., et al. (2013) Impact of a Quarterly Report Card on Colonoscopy Quality Measures. Gastrointestinal Endoscopy, 77, 925-931.
https://doi.org/10.1016/j.gie.2013.01.012
[36] Mostafa, G., Matthews, B.D., Norton, H.J., Kercher, K.W., Sing, R.F. and Heniford, B.T. (2004) Influence of Demographics on Colorectal Cancer. The American Jour-nal of Surgery, 70, 259-264.
[37] Chattar-Cora, D., Onime, G.D., Valentine, I.S., Cudjoe, E. and Rivera, L. (2000) Colorectal Cancer in a Multi-Ethnic Urban Group: Its Anatomical and Age Profile.
International Journal of Surgery, 85, 137-142.
[38] Jackson, C.S. and Vega, K.J. (2015) Higher Prevalence of Proximal Colon Polyps and Villous Histology in African-Americans Undergoing Colonoscopy at a Single Equal Access Center. Journal of Gastrointestinal Oncology, 6, 638-643.
[39] Lieberman, D.A., Holub, J.L., Moravec, M.D., et al. (2008) Prevalence of Colon Po-lyps Detected by Colonoscopy Screening in Asymptomatic Black and White Pa-tients. The Journal of the American Medical Association, 300, 1417-1422.
https://doi.org/10.1001/jama.300.12.1417
[40] Lieberman, D.A., Williams, J.L., Holub, J.L., et al. (2014) Race, Ethnicity, and Sex Affect Risk for Polyps > 9 mm in Average-Risk Individuals. Gastroenterology, 147, 351-358. https://doi.org/10.1053/j.gastro.2014.04.037
[41] Friedenberg, F.K., Singh, M., George, N.S., Sankineni, A. and Shah, S. (2012) Preva-lence and Distribution of Adenomas in Black Americans Undergoing Colorectal Cancer Screening. Digestive Diseases and Sciences, 57, 489-495.
https://doi.org/10.1007/s10620-011-1952-z
[42] Greenspan, M., Rajan, K.B., Baig, A., et al. (2013) Advanced Adenoma Detection Rate Is Independent of Nonadvanced Adenoma Detection Rate. The American Journal of Gastroenterology, 108, 1286-1292.
[43] Wolf, A.M.D., Fontham, E.T.H., Church, T.R., et al. (2018) Colorectal Cancer Screening for Average-Risk Adults: 2018 Guideline Update from the American Cancer Society. CA: A Cancer Journal for Clinicians, 68, 250-281.
https://doi.org/10.3322/caac.21457
[44] Rex, D.K., Johnson, D.A., Anderson, J.C., et al. (2009) American College of Gastro-enterology Guidelines for Colorectal Cancer Screening 2009 [Corrected]. The American Journal of Gastroenterology, 104, 739-750.
[45] DeBourcy, A.C., Lichtenberger, S., Felton, S., et al. (2008) Community-Based Prefe-rences for Stool Cards versus Colonoscopy in Colorectal Cancer Screening. Journal of General Internal Medicine, 23, 169-174.
https://doi.org/10.1007/s11606-007-0480-1
[46] New York State Cancer Services Program (2016) New York State Department of Health: Bureau of Cancer Prevention and Control.
[47] Silverberg, M.J., Chao, C., Leyden, W.A., et al. (2009) HIV Infection and the Risk of Cancers with and without a Known Infectious Cause. AIDS, 23, 2337-2345.
https://doi.org/10.1097/QAD.0b013e3283319184
DOI: 10.4236/jct.2019.104022 289 Journal of Cancer Therapy
and Meta-Analysis. Journal of Acquired Immune Deficiency Syndromes, 75, 439-447. https://doi.org/10.1097/QAI.0000000000001433
[49] Bini, E.J., Park, J. and Francois, F. (2006) Use of Flexible Sigmoidoscopy to Screen for Colorectal Cancer in HIV-Infected Patients 50 Years of Age and Older. Archives of Internal Medicine, 166, 1626-1631. https://doi.org/10.1001/archinte.166.15.1626
[50] Gutkin, E., Hussain, S.A., Mehta, P., et al. (2012) Prevalence of Adenomas Found on Colonoscopy in Patients with HIV. Gastroenterology Research, 5, 52-56.
https://doi.org/10.4021/gr433w
[51] Fantry, L.E., Nowak, R.G., Fisher, L.H., et al. (2016) Colonoscopy Findings in HIV-Infected Men and Women from an Urban U.S. Cohort Compared with Non-HIV-Infected Men and Women. AIDS Research and Human Retroviruses, 32, 860-867. https://doi.org/10.1089/aid.2015.0322
[52] Reinhold, J.P., Moon, M., Tenner, C.T., Poles, M.A. and Bini, E.J.(2005) Colorectal Cancer Screening in HIV-Infected Patients 50 Years of Age and Older: Missed Op-portunities for Prevention. American Journal of Gastroenterology, 100, 1805-1812. [53] Singh, H., Bay, D., Bernstein, C.N., et al. (2012) Pathological Reassessment of
Hyperplastic Colon polyps in a City-Wide Pathology Practice: Implications for Polyp Surveillance Recommendations. Gastrointestinal Endoscopy, 76, 1003-1008.
https://doi.org/10.1016/j.gie.2012.07.026
[54] Schoen, R.E. and Akpan, I.M. (2016) Whither the Hyperplastic and Serrated Polyp?
Gastrointestinal Endoscopy, 83, 563-565.