Complex tree: the basic framework of protein-protein
interaction networks
Dai-Chuan Ma1,2, Yuan-Bo Diao1,2, Yi-Zhou Li1,2, Yan-Zi Guo1,2, Jiang Wu1,2, Meng-Long Li1,2*
1College of Chemistry, Sichuan University, Chengdu, China; *Corresponding Author: 2State Key Laboratory of Biotherapy, Sichuan University, Chengdu, China
Received 22 May 2010; revised 26 July 2010; accepted 2 August 2010.
ABSTRACT
In living cells, proteins are dynamically connec- ted through biochemical reactions, so its functi- onal features are properly encoded into protein- protein interaction networks (PINs). Up to pres- ent, many efforts have been devoted to explor-ing the basic feature of PINs. However, it is still a challenging problem to explore a universal pr- operty of PINs. Here we employed the complex networks theory to analyze the protein-protein interactions from Database of Interacting Prot- ein. Complex tree: the unique framework of PINs was revealed by three topological properties of the giant component of PINs (GCOP), including right-skewed degree distributions, relatively sm- all clustering coefficients and short characteris-tic path lengths. Furthermore, we proposed a no- nlinearly growth model: complex tree model to reflect the tree framework, the simulation resu- lts of this model showed that GCOPs were well represented by our model, which could be help- ful for understanding the tree-structure: basic framework of PINs. Source code and binaries
freely available for download at
Keywords:Complex Networks; Complex Tree; Pins; Model Simulation
1. INTRODUCTION
Protein-protein interactions (PPIs) are crucial to most biochemical processes in living organisms. Identification of protein-protein interactions has been the focus of the post-proteomic studies. Various experimental techniques have been developed for the large-scale PPI analysis, in- cluding yeast two-hybrid systems [1], mass spectrometry [2,3], protein chip [4] and so on. Consequently, great
quantity of protein interaction data from several organ-isms such as yeast and fruit fly has been produced [2,3].
In the past decade, with the explosion of available hi- gh throughout biological data, the analysis of biological networks has attracted significant interest in academic community. Since the “right-skewed” degree distribution of metabolic networks found by Jeong et al. [5], lots of research works have been done to understand the biolo- gical systems in terms of network. The system’s eleme- nts are represented as vertices (such as proteins, DNA, RNA and small molecules) and their interactions are red- uced to links (biochemical interactions between these bi- ological components) connecting pairs of vertices. And the cell’s behaviors are distinct attributed to “network of networks” [6].
In a living cell, group of proteins participate in diverse biochemical interactions that lead to changing the effect of protein or forming protein complexes. All these proc- esses constitute protein-protein interaction networks (PI- Ns) [7]. Studying the topology features of PINs is bene-ficial to understand the cell’s higher-level organization mechanism. Recently, notable structure properties have been reported in several research works of PINs [8-12], including right-skewed degree [13], short pathway length [7], hierarchical structure [14]. Meanwhile, many network models have been proposed to characterize the PINs to explore the basic universal property of PINs [15,16]. However, it is still a challenging problem to find a universal framework of PINs for each species.
In our works, we employed the complex networks the- ory to analyze the datasets from the PPI database DIP in- cluding eight species: D. melanogaster (Dmela), S. cere-visiae (Scere), E. coli (Ecoli), C. elegans (Celeg), H. sa- piens (Hsapi), H. pylor (Hpylo), M. musculus (Mmusc),
2. Methods
2.1. Data Source—Database of Interacting Protein (DIP)
In this paper, the DIP database which collects experime- ntally determined protein-protein interaction data was ut- ilized as the input data. We collected the Protein-Protein Interactions with binary relations data from DIP, version
DIP_20081014 (). In order to
obtain integrated topology, the “full set” subset contain-ing PPI data identified by experiment was used. Althou- gh false positive in “full set” might lead to false edges in PINs and inaccurate topological features, we considered that our analysis results are still robust because a few local inaccuracies have less influence on global proper-ties of PINs. Table 1 summarizes the numbers of pro-teins and interactions for aforementioned species.
2.2. Topological Features of PINs
In this study, we constructed adjacency matrix of PIN from the corresponding PPI pair tables, where each ele-ment in the adjacency matrix is assigned 0 or 1 to stand for whether it is a direct interaction, or non-interaction. After removed loops and multiple edges, the network was normalized into an undirected graph. All following topological properties were calculated using the “igraph” R package which is widely used in network analysis [30].
2.2.1. Component Size and Giant Component
As the component size of PINs may reflect its fundam- ental properties [17], we calculated the component size for each species, and extracted the giant component of PINs (GCOP) from entire network.
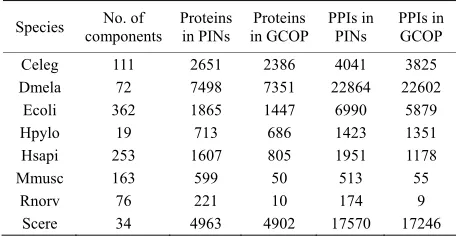
[image:2.595.56.284.605.723.2]Measurement of component size and giant component was listed in Table 1. For Rnorv and Mmusc, the size of GCOP is too small for large scale analysis. Hence, in the rest of our work we focused on the other six species. Three main topological parameters of GCOP were measured for these species and the details of measure-ments are described in following section.
Table 1. Basic statistics of PINs and corresponding GCOP.
Species components No. of Proteins in PINs in GCOP Proteins PPIs in PINs PPIs inGCOP
Celeg 111 2651 2386 4041 3825 Dmela 72 7498 7351 22864 22602
Ecoli 362 1865 1447 6990 5879 Hpylo 19 713 686 1423 1351 Hsapi 253 1607 805 1951 1178 Mmusc 163 599 50 513 55
Rnorv 76 221 10 174 9 Scere 34 4963 4902 17570 17246
2.2.2. Node Degree Distribution
One most basic parameter of a network is its node deg- ree distribution. In the past century, random graph is the most important model for real systems. The degree distr- ibution of random graph is bell-shaped and the node de- gree clusters around the mean value. But at the begin- ing of this century, Jeong [13] found the degree distribu- tion of yeast PIN is far from bell-shaped distribution of random graph. Jeong et al. deduced that the degree dis-tri- bution follows power-law approximately and called it “scale-free”. The phenomena so-called scale-free have prompted many scientists to explore real networks. Up to many present research works have been done in sys-tem biology, showing that so many biological networks have the “right-skewed” degree distribution [12].
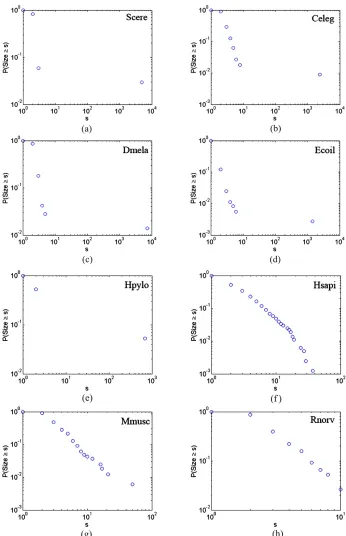
In this paper, we defined the degree k of a given pro- tein as the number of interactions with other proteins and P(k) as the frequency distribution of degree. We collec- ted the degree sequence datasets of GCOP and plotted the logarithm of the cumulative degree distribution (CD- D): Pcum(k) vs. the logarithm of k for each species. The
CCD curves were plotted in Figure 1. It is obvious that each GCOP has the “right-skewed” degree distribution. This means that most proteins in yeast PIN have very few interactions and yet a few ones have many (hubs), and the degree distribution has no well-defined peak but is approximate to skewed line under a double logarith-mic plot. On account of that power-low distribution is a reasonable hypothesis for right-skewed distributions, we made power-law parameters estimation and tested the po- wer-law hypothesis for those distributions with the tech-niques proposed by Aaron Clauset [18] based on maxi-mum likelihood methods and the Kolmogorov-Smirnov statistic. By applying this method to the degree sequen- ces of GCOP for each species, we can not only find the best-fit power low model for degree distributions of GC- OPs, but also test whether the power-low distribution is a reasonable hypothesis for those distributions. The es-timation result is showed in Table 2.
2.2.3. Clustering Coefficient and Characteristic Path Length
Other two basic topology properties of network are av-erage clustering coefficient and characteristic path length. Considering that PINs are undirected networks, we de-fined L as the characteristic path length (also known as the average path length) between protein pairs in PINs:
1 2
1
( 1)i j ij
l d
n n
(1)dij is defined as the number of links from vertex i along
Figure 1. Cumulative component size distributions of PINs of eight species. (a) Scere; (b) Celeg; (c) Dmela; (d) Ecoli; (e) Hpylo; (f) Hsapi; (g) Mmusc; (h) Rnorv.
The clustering, sometimes also called transitivity, gen- erally means the presence of a heightened number of tri- angles (groups of three vertices each of which is con-nected to the others) in the network [19]. In many sys tems it has been found that if constituent A is connected
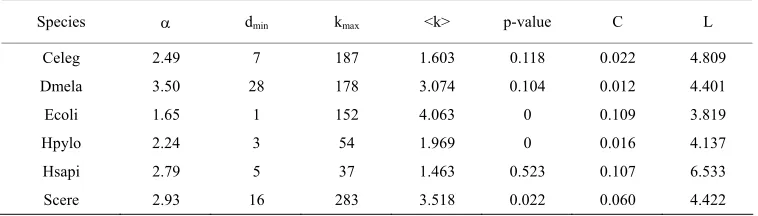
Table 2. Average node degree < k >, maximum connectivity kmax, clustering coefficient and characteris-tic path length, and the power-law testing results of CCD for the six species.
Species dmin kmax <k> p-value C L
Celeg 2.49 7 187 1.603 0.118 0.022 4.809 Dmela 3.50 28 178 3.074 0.104 0.012 4.401
Ecoli 1.65 1 152 4.063 0 0.109 3.819
Hpylo 2.24 3 54 1.969 0 0.016 4.137
Hsapi 2.79 5 37 1.463 0.523 0.107 6.533
Scere 2.93 16 283 3.518 0.022 0.060 4.422
clustering value Ci:
number of triangles connected to vertex number of triples centered on vertex
i i
C
i
(2)
Then the global clustering coefficient for the whole ne- twork is the average:
1
i i
c c
n
(3)The calculation results are also showed in Table 2.
2.3. Complex Tree Model
In the past few years, notable discoveries of exploring complex networks have redefined our understanding of complex systems. Meanwhile, certain models have been constructed to mimic real networks [20-24]. The BA model is the most famous stochastic model which gener-ates scale-free topology by the combination of network size linear growth and preference attachment rule [25]. However the randomness in this model makes it hard to gain a visual understanding of scale-free topology. A deterministic model [22] was constructed by Barabasi to solve this problem. The unique property of this model is its hierarchical fashion. After that, Ravasz and Barabasi uncovered the hierarchical structure in metabolic net-works [26], they proposed a deterministic hierarchical network model to explain the modularity and hierarchi-cal organization in real networks [27]. Up to present, many network models have been proposed to explain the organization mechanism of biochemical system, but it is still a challenging problem to construct a universal model for PINs.
Inspired by previous study, we tried to build a model to reflect the unique framework of PINs: complex tree. We constructed this model in a tree-like fashion to mim- ic the GCOP. In GCOPs, there’re many varieties of tree- structure, it’s really difficult to build a deterministic mo- del for it. So we made a simplification here and built this heuristic model by adding shortcuts on a tree substrate, we called it “complex tree model”. The details of model construction are depicted as follow.
2.3.1. Substrate
In building small-world model, Watts made random rew- iring test on several substrates, including tree, ring lattice, and many other structures. Finally the one dimension ring lattice was chosen because of its equivalence [20]. Rece- ntly, Dong-Hee Kim et al. found thatmany real systems have their own communication kernels and the commun- ication kernel of scale-free network is scale-free tree that is called the skeleton of complex networks [28]. They deduced that scale-free networks can decompose into (scale-free) trees and shortcuts. So in this paper we fo-cused on building a simple model by adding shortcuts in a tree-structure. The tree graph was chosen as substrate to construct the CTM. Here we focused on the situation of perfect binary tree. Its inherent hierarchical structure and connectivity make it a proper substrate. By altering the number of levels, n, the size of substrate N(n) can grow nonlinearly as:
1
( ) 2n 1
N n (4)
2.3.2. Shortcut Adding
In the construction of NW small-world model, Newman and Watts added a few shortcuts between different parts of the ring lattice. As a result, the local construction do- esn’t change, but the distance between two remote parts reduces dramatically by long-range connections [29]. In our model, we added shortcuts between two nodes in different hierarchies according to a simple rule. An arbi-trary node in level n is linked with nodes of lower levels (excluding the two leaf nodes already connected) with probability:
0
( ) n
with big characteristic path length; P0 = 1, the root gets every node connected and the maximum amount of sh- ortcuts is added to the substrate. In the region 0 < P0 < 1, some interesting phenomena can be seen between two extremes above. The details of model construction are shown in Figure 2, which depicts both the substrate and the shortcuts adding process. The model simulation is described in the next section.
2.4. Simulations
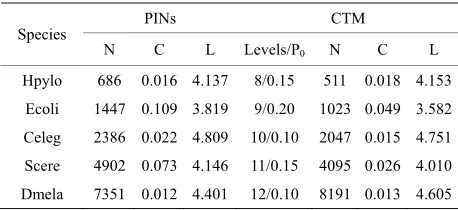
Here we concentrated on the substrate n = 10, N = 1023 and added shortcuts on it. When altering P0 from 0 to 1; the topological features can be altered dramatically dur-ing this process. We calculated three main topological parameters (CDD, C, L) of CTM to describe this sto-chastic process. Furthermore, with the aim to represent the topological features of GCOP, we focused on these cases of CTM with n = 9 N = 511, n = 10 N = 1023, n = 11 N = 2047, n = 12 N = 4095, n = 13 N = 8191, which made the CTM attained similar size with the GCOP for five species. By tuning P0, we found out the certain P0 for each scale of CTM to fit PINs, and compared the topological features of GCOP with fitted CTM. The comparison result is depicted in Table 3.
3. RESULTS
[image:5.595.58.285.485.566.2]Several basic statistics of the PINs are summarized in Table 1. It is distinct that the GCOP of Dmela, Scere, Ecoli, Celeg, Hsapi, Hpylo is remarkably big, containing most proteins and interactions of PINs. Especially in the PINs of Celeg, Dmela, Hpylo and Scere, the giant com-ponents contain more than 90% proteins of whole PINs.
[image:5.595.56.285.615.720.2]Figure 2. The generation process of CTM (n = 3, P0 = 0.3).
Table 3. Comparisons between PINs and CTM.
PINs CTM Species
N C L Levels/P0 N C L
Hpylo 686 0.016 4.137 8/0.15 511 0.018 4.153 Ecoli 1447 0.109 3.819 9/0.20 1023 0.049 3.582
Celeg 2386 0.022 4.809 10/0.10 2047 0.015 4.751 Scere 4902 0.073 4.146 11/0.15 4095 0.026 4.010 Dmela 7351 0.012 4.401 12/0.10 8191 0.013 4.605
For Rnorv and Mmusc, the size of GCOP is smaller and not suitable for large scale analysis.
Table 2 shows the average node degree <k>, maxi-mum node degree kmax, characteristic path length L,
clustering coefficient C and the power-law estimation results of the CCD (scaling parameter, lower-bound and p-value) for every GCOP. The <k> ranges from 1.60 to 4.06, which means many proteins have only a few inter-actions. But there exist some proteins with many interac-tions in PINs, the number of interacinterac-tions can be as high as 283 (Protein JSN1 in S. cerevisiae, dip: 1281N). The kmax values are much larger than <k>,it strongly indic-
ates that PINs cannot be well depicted by random graph. Then we made the power-law estimation for the CDD of GCOP, the results show that the scaling parameter lies between 1.65 and 3.5 of GCOP for six species, and the low-bound dmin ranges from 1 to 28. Furthermore po-
wer-law hypothesis was evaluated by goodness-of-fit test [18]. We calculated the goodness-of-fit between the cumulative degree distribution and the best fitted power law model. The resulting p-value was listed in P-value columns. Here, a relatively conservative choice was made that the power law was ruled out if p-value ≤ 0.1. When the p-value is greater than 0.1, power law is a plausible model for the CDD, otherwise it is rejected. The results show that the power-law is not a proper model for Ecoli, Hpylo and Scere but a reasonable one for Celeg, Hsapi, Dmela. The characteristic path length L of PINs lies be-tween 3.81 and 6.53.
The characteristic path length L of the GCOP for six species is around 4, which means that any two proteins can indirectly interact via relatively short successive bio- chemical reactions. The clustering coefficient C of the GCOP is relatively small; the highest clustering coeffi-cient appears in GCOP of Ecoli is 0.108 and for other species C is around 0.03. This is important evidence for that GCOP is a multi-scale network with tree structure.
Figure 3. Degree distribution of the CTM model with different P0 (0.2, 0.5, 0.8, 1.0), n = 9.
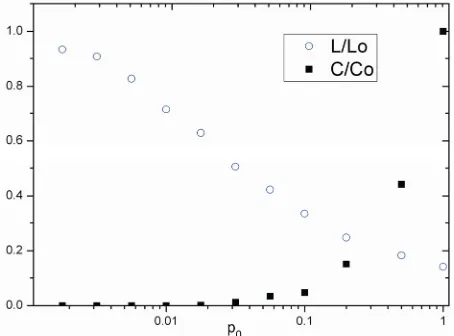
Figure 4. Characteristic path length L and clustering coeffi-cient C for the family of CTM with n = 9. L0 and C0 is the characteristic path length and clustering coefficient of CTM with P0 = 1.
4. DISCUSSIONS AND CONCLUSIONS
In this paper, we employed COMPLEX NETWORKS THEORY to analyze the PPI database DIP (Oct. 2008). Eight species (Ecoli, Hpylo, Celeg, Dmela, Hsapi, Mm- usc, Rnorv and Scere) were considered, but the GCOP of Mmusc and Rnorv are smaller, we focused on the large- scale analysis of GCOP of other six species. Three glo- bal parameters (node degree distribution, characteristic path length L, and the clustering coefficient C) were us- ed to characterize the GCOP. The logarithm of Pcum(k) vs.
the logarithm of node degree log k indicated that the CCDs of PINs are a group of right-skewed curves. We also tested the power-law behavior for CCD curves. Thus in some cases power-law may not be more interes- ting than any other heavy-tailed distribution. But in our work, the goal is to infer plausible mechanisms that mi- ght underlie the formation and evolution of PINs; it may matter greatly whether the CDD of PINs follows a pow- er law or not. We employed a new testing technique to
evaluate the power-law hypothesis for CDD. The estim- ation results show that power-law is a plausible model for the CDD of GCOP for Celeg, Dmela and Hsapi, but for other three species: Ecoli, Hpylo, Scere, the power- law is ruled out. Furthermore, there are only a few prote- ins of which the degree values are larger than lower bo- und dmin in GCOP of Celeg, Dmela and Hsapi (Celeg
227/2386 Dmela 287/7351 Hsapi 132/805), the best- fitted part of CDD is really short. In conclusion, the po- wer-law model might not be a proper model for the CDD of GCOP and previous scale-free models are not proper for PINs.
The calculations of characteristic path length L and clustering coefficient C indicate that the GCOPs are mu- lti-scale networks without many loops. The long-range interactions between different local parts make the L be close to the small-world limit given by random networks, otherwise the long-range interactions have no significant effect on local structure, the clustering coefficient is rel- atively small, and those issues suggest that tree structure be the basic framework of GCOP. With the aim to repre-sent the framework of GCOP, we proposed a nonlinearly growth model: CTM. In our model, network size can be changed nonlinearly with different n (number of tree levels) and the amount of shortcuts can be altered by altering P0(shortcut adding probability of the main root to all other nodes below level 0 except the two leaf nodes it already linked). We found out the P0 and n to approximate the GCOP after accomplishing mass com-puter simulations of CTM. From the comparison result between GCOP and according CTM in Table 3, it is clear that the giant component can be well represented by CTM.
Our study only offers a starting point for understand-ing the simple nature of PINs: complex tree. The propo- sed CTM offers us a new perspective in exploring the PINs. In this model, the upper nodes of substrate have m = 2 leaves. For further modeling, we may generalize this situation by changing the arbitrary parameter m, such as to 3 or 4, or connect the brotherhood leaves in the same level. In summary, our research might be helpful to und- erstand the basic framework of PINs: complex tree and the CTM would be a powerful tool for correlating the topological with functional properties of the PINs.
5. ACKNOWLEDGEMENTS
The authors gratefully thank Aaron Clauset for sharing the Power-law estimation code. The work was funded by the National Natural Science Foundation of China (20775052, 20972103).
REFERENCES
[image:6.595.58.285.252.420.2]and Sakaki, Y. (2001) A comprehensive two-hybrid analysis to explore the yeast protein interactome. Pro-ceedings of the National Academy of Sciences of the United States of America, 98(8), 4569-4574.
[2] Gavin, A.C., Bosche, M., Krause, R., Grandi, P., Mar-zioch, M. and Bauer, A. (2002) Functional organization of the yeast proteome by systematic analysis of protein complexes. Nature, 415(6868), 141-147.
[3] Ho, Y., Gruhler, A., Heilbut, A., Bader, G. D., Moore, L. and Adams, S.L. (2002) Systematic identification of pro-tein complexes in Saccharomyces cerevisiae by mass spectrometry. Nature, 415(6868), 180-183.
[4] Zhu, H., Bilgin, M., Bangham, R., Hall, D., Casamayor, A. and Bertone, P. (2001) Global analysis of protein ac-tivities using proteome chips. Science, 293(5537), 2101- 2105.
[5] Jeong, H., Tombor, B., Albert, R., Oltvai, Z.N. and Bara-basi, A.L. (2000) The large-scale organization of meta-bolic networks. Nature, 407(6804), 651-654.
[6] Barabasi, A.L., Oltvai, Z.N., Wuchty, S. (2004) Charac-teristics of biological networks. In: Ben-Naim, E., Frau- en felder, H. and Toroczkai, Z., Eds., Complex Networks, Springer-Verlag, 443-457.
[7] Albert, R. (2005) Scale-free networks in cell biology. Journal of Cell Science, 118(21), 4947-4957.
[8] Bork, P., Jensen, L.J., von Mering, C., Ramani, A.K., Lee, I. and Marcotte, E.M. (2004) Protein interaction net-works from yeast to human. Current Opinion in Struc-tural Biology, 14(3), 292-299.
[9] Eungdamrong, N.J. and Iyengar, R. (2004) Modeling cell signaling networks. Biology of the Cell, 96(5), 355-362. [10] Giot, L., Bader, J.S., Brouwer, C., Chaudhuri, A., Kuang,
B. and Li, Y. (2003) A protein interaction map of Droso-phila melanogaster. Science, 302(5651), 1727-1736. [11] Gursoy, A., Keskin, O. and Nussinov, R. (2008)
Topo-logical properties of protein interaction networks from a structural perspective. Biochemical Society Transactions, 36, 1398-1403.
[12] Yook, S.H., Oltvai, Z.N. and Barabasi, A.L. (2004) Func-tional and topological characterization of protein interac-tion networks. Proteomics, 4(4),928-942.
[13] Jeong, H., Mason, S.P., Barabasi, A.L. and Oltvai, Z.N. (2001) Lethality and centrality in protein networks. Na-ture, 411(6833), 41-42.
[14] Ng, K.L., Lee, P.H., Huang, C.H., Fang, J.F., Hsiao, H.W., Tsai, J.J.P. (2006) Hierarchical structure of the protein- protein interaction networks. Chinese Journal of Physics, 44(1), 67-77.
[15] Deeds, E.J., Ashenberg, O. and Shakhnovich, E.I. (2006) A simple physical model for scaling in protein-protein interaction networks. Proceedings of the National Academy of Sciences of the United States of America,
103(2), 311-316.
[16] Rhodes, D.R., Tomlins, S.A., Varambally, S., Mahavisno, V., Barrette, T. and Kalyana-Sundaram, S. (2005) Prob-abilistic model of the human protein-protein interaction network. Nature Biotechnology, 23(8), 951-959.
[17] Newman, M.E.J. (2007) Component sizes in networks with arbitrary degree distributions. Physical Review E, 76(4), 4.
[18] Clauset, A., Shalizi, C.R. and Newman, M.E.J. (2009) Power-Law Distributions in Empirical Data. SIAM Re-view, 51(4), 661-703.
[19] Newman, M.E.J. (2003) The structure and function of complex networks. SIAM Review, 45(2), 167-256. [20] Watts, D.J. and Strogatz, S.H. (1998) Collective
dynam-ics of “small-world” networks. Nature, 393(6684), 440- 442.
[21] Barabasi, A.L., Dezso, Z., Ravasz, E., Soon-Hyung, Y. and Oltvai, Z. (2003) Scale-free and hierarchical struc-tures in complex networks. AIP Conference Proceedings, 661, 1-16.
[22] Barabasi, A.L., Ravasz, E. and Vicsek, T. (2001) Deter-ministic scale-free networks. Physica a-Statistical Me-chanics and its Applications, 299(3-4), 559-564.
[23] Chen, M., Yu, B.M., Xu, P. and Chen, J. (2007) A new deterministic complex network model with hierarchical structure. Physica a-Statistical Mechanics and its Appli-cations, 385(2),707-717.
[24] Kim, D.H., Rodgers, G.J., Kahng, B. and Kim, D. (2005) Modelling hierarchical and modular complex networks: division and independence. Physica a-Statistical Me-chanics and Its Applications, 351(2-4), 671-679.
[25] Barabasi, A.L., Albert, R. and Jeong, H. (1999) Mean-field theory for scale-free random networks. Physica A: Statistical Mechanics and its Applications, 272(1-2), 173-187.
[26] Ravasz, E., Somera, A.L., Mongru, D.A., Oltvai, Z.N., Barabasi, A.L. (2002) Hierarchical organization of modularity in metabolic networks. Science, 297(5586), 1551-1555.
[27] Ravasz, E. and Barabasi, A.L. (2003) Hierarchical or-ganization in complex networks. Physical Review E, 67(2), 026112.
[28] Kim, D.H., Noh, J.D. and Jeong, H. (2004) Scale-free trees: The skeletons of complex networks. Physical Re-view E, 70(4), 046126
[29] Newman, M.E.J. and Watts, D.J. (1999) Renormalization group analysis of the small-world network model. Phys-ics Letters A, 263(4-6), 341-346.