This is an Accepted Manuscript, which has been through the
Royal Society of Chemistry peer review process and has been
accepted for publication.
Accepted Manuscripts are published online shortly after
acceptance, before technical editing, formatting and proof reading.
Using this free service, authors can make their results available
to the community, in citable form, before we publish the edited
article. We will replace this Accepted Manuscript with the edited
and formatted Advance Article as soon as it is available.
You can find more information about Accepted Manuscripts in the
author guidelines
.
Please note that technical editing may introduce minor changes
to the text and/or graphics, which may alter content. The journal’s
standard
Terms & Conditions
and the ethical guidelines, outlined
in our
author and reviewer resource centre
, still apply. In no
event shall the Royal Society of Chemistry be held responsible
for any errors or omissions in this Accepted Manuscript or any
consequences arising from the use of any information it contains.
Accepted Manuscript
Journal of
Materials Chemistry A
Materials for energy and sustainabilitywww.rsc.org/MaterialsA
ISSN 2050-7488
Volume 4 Number 1 7 January 2016 Pages 1–330
PAPER
Kun Chang, Zhaorong Chang et al.
Bubble-template-assisted synthesis of hollow fullerene-like
MoS2 nanocages as a lithium ion battery anode material
Journal of
Materials Chemistry A
Materials for energy and sustainability
Journal Name
PAPER
Received 00th January 20xx, Accepted 00th January 20xx
DOI: 10.1039/x0xx00000x
www.rsc.org/
Na
0.35MnO
2as an ionic conductor with randomly distributed
nano-sized layers
Arturas Adomkevicius
a,b, Laura Cabo-Fernandez
a, Tzu-Ho Wu
a,b, Tzu-Man Ou
b, Ming-Guan Chen
b,
Yuri Andreev
c*, Chi-Chang Hu
b* and Laurence J. Hardwick
a*
Here we show that through a straightforward synthesis it is
possible to create a bulk material, Na0.35MnO2, with isolated
sheets. Due to such arrangement of the oxide layers, this ionic conductor was found to be genuinely pseudocapacitive, with charge storage not limited by diffusion of ions between stacked
layers, resulting in capacitance values of 190 F g-1 under
exceptionally high current rates of up to 200 A g-1.
Introduction
Manganese oxides have been widely investigated for
supercapacitor applications.1-4 Numerous different compounds
based around MnOx, as well as variations in structure and
morphology have been reported.5-10 One of the more
promising materials is cation pre-intercalated manganese
oxides. Here the cation located in-between the MnO2 layers is
involved in the charge storage mechanism; thus enabling the electrolyte to maintain both a stable salt concentration and
ionic conductivity during charge and discharge.11 Limitations to
intercalation-based charge storage from solid state diffusion result in the high diffusion barrier of cations. This reduces the power performance, although pseudocapacitance may be
increased at very low currents or scan rates.12-15 However,
important influences of dimension and crystalline size of
cation-pre-intercalated MnO2 nanosheets on the cation
diffusion rate within 2D MnO2 have not yet been fully
explored.
Materials of reduced dimensionality have been under intense investigation since the discovery of
Buckminster-fullerene (0D),16 carbon nanotubes (1D)17 and graphene (2D).18
In particular, 2D materials are being critically examined for a whole host of applications in energy, materials, and
engineering.19-23 The challenge of fully utilising 2D materials is
the ability to scale up the synthesis in concert with maintaining the remarkable material properties reported from studies of
single isolated flakes.24-26
Isolated in suspension, 2D sheets, once sedimented, tend to stack, forming a 3D-ordered material with either ideal crystallographic interlayer registry or restricted to equidistant
layers.23, 27-31 This inevitably leads to the loss of the unique 2D
properties, such as vastly accessible surface area. The challenge of making truly 2D materials is always accompanied by the difficulty of establishing their structure using direct, powder diffraction, methods since the commonly used diffraction methodologies are not adequately suited for materials with lower than perfectly 3D ordering. Powder diffraction data from the literature, when provided, indicate that the majority of reportedly 2D-material powders routinely have the diffraction pattern similar to their 3D counterparts
albeit often with a small and anisotropic crystallite size.32, 33
Here we show that a reliable structural model of a 2D ordered
compound, in this case Na0.35MnO2, can be obtained through
powder diffraction data and the fundamental equation of Debye. As a consequence, through the interactive influences of both dimension and crystalline size of the
cation-pre-intercalated MnO2 nanosheets, the capacitance was found not
to be limited by solid-state diffusion.
Experimental
Material preparation: The synthesis route for sodium
pre-intercalated manganese oxide (NaxMnO2) was devised where
conditions would promote the formation of a disordered
material. 3 mM MnSO4 (aq) (Hayashi Pure Chemical, Japan)
and 2 mM KMnO4 (aq) (Shimakyu’s Pure Chemical, Japan) were
added together at 30 oC, followed by the addition of 15 mM
Na2SO4 (Showa Chemical Co. Ltd, Japan). After mixing, the pH
of the solution was adjusted to 12.3 via dropwise addition of 1 M NaOH (aq) and was then transferred to a Teflon-lined
Journal
of
Materials
Chemistry
A
Accepted
Manuscript
COMMUNICATION
Journal Name
pressure vessel and heated within an oven (Memmert) to 75
o
C (± 0.5oC) for 12 h. After cooling, the precipitate was filtered
and washed with deionised water. The mild temperatures and the inclusion of a molar excess of alkali metal cations with respect to manganese disrupt the formation of a highly crystalline material. By carrying out the synthesis under strict temperature control, we were able to obtain a single phase product. The stoichiometry of resultant material was
determined as Na0.35MnO2 by elemental analysis via
inductively coupled plasma optical emission spectrometry, ICP-OES (see ESI).
Electrode preparation: The coating slurry was prepared by
mixing 70 wt.% of Na0.35MnO2, 20 wt.% of carbon black (Vulcan
XC72, USA), and 10 wt.% of poly(vinylidene difluoride (PVdF) binder (Sigma-Aldrich), which was dispersed in N-methyl-2-pyrrolidone (NMP, Tedia Company Inc. USA) followed by sonication for 60 min. The slurry was coated on a graphite
substrate (1 cm × 1 cm) and dried in an oven for 12 h at 45oC
to obtain the electrodes. The mass of Na0.35MnO2 as the
electroactive material in this study was fixed to be 0.5 mg cm-2,
resulting in the total mass loading of 0.71 mg cm-2.
Structural characterisation: X-ray powder diffraction data were
collected in a capillary mode on PANalytical Empyrean using
Mo Kα1,2 radiation (see ESI for more details). Raman spectra
were recorded within an argon containing airtight cell using a Raman microscope (Renishaw in Via), with the He-Ne laser (632.8 nm) illumination focused through an inverted microscope (Leica), via a 50× objective lens (Leica). In order to avoid local heating by the laser, the sample surface exposure was carefully controlled via the use of an appropriate filter. The acquisition time for each spectrum was 300 s. Scanning electron microscopic (SEM) images were collected with a field-emission scanning electron microscope (FE-SEM, Hitachi SU8010). Transmission electron microscopic (TEM) and selected-area electron diffraction (SAED) images were recorded using a JEOL, JEM 3010 microscope with an accelerating voltage of 300 kV and a high-resolution transmission electron microscope (HRTEM, JEOL, 2100F) at 200 kV. Nitrogen adsorption and desorption isotherms were measured at 77.3 K by means of the Micromeritics ASAP 2020 surface area and porosity analyser.
Electrochemical characterisation: Cyclic voltammetry (CV) and
galvanostatic charge-discharge (GCD) tests of as-prepared samples were conducted on an electrochemical station (CHI 1128C, CH Instruments, USA). The specific capacitance of
Na0.35MnO2 was calculated from the discharge curves:
.
∆
∆ (1)
where CS.Mn, m, ΔV, I, and Δt are the specific capacitance of
Na0.35MnO2, mass loading of Na0.35MnO2 on the substrate,
potential window of discharge tests, applied current, and
discharge time, respectively.34
Results and Discussion
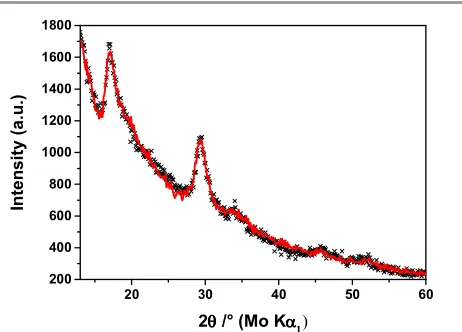
Powder X-ray diffraction pattern of Na0.35MnO2, shown in
Fig. 1 and ESI, is characterised by a very low signal-to-noise
ratio, indicating that the compound is largely disordered. The regions of the pattern representing coherent scattering are reminiscent of those previously calculated for a single layer of
MnO2 and contain broad asymmetric peaks.35
20 30 40 50 60 200
400 600 800 1000 1200 1400 1600 1800
In
te
n
s
it
y
(
a
.u
.)
2θθθθ /° (Mo Kαααα1111)
Fig. 1 Experimental (black crosses) and calculated, using the best-fit model obtained from the Debye refinement, (red line) X-ray powder diffraction patterns of Na0.35MnO2
The structure of the ordered regions has been determined using a newly developed refinement method based on the
fundamental scattering equation of Debye36 and thus far
employed to determine the shape and size of 3D
nanoparticles37 and of 2D graphene layers in partially
disordered carbon blacks.38 A single infinite layer of the
manganese oxide from the structure of hexagonal
H-birnessite39 was used as a starting model for the refinement.
[image:3.612.311.542.113.279.2]The shape of each trial layer was assumed to be an elliptical cylinder, with the axes’ lengths of the ellipse, lattice parameters, amplitudes of mean-square displacements of atoms and the directional angle of the cylindrical cut-out serving as variables in the refinement.
Fig. 2 Structural model. (a) Top view of the ordered region within a single MnO2 layer,
from which the powder diffraction pattern in Fig. 1 was calculated. Magenta –
(a)
(b)
Journal
of
Materials
Chemistry
A
Accepted
Manuscript
Published on 02 May 2017. Downloaded by University of St Andrews Library on 03/05/2017 11:47:09.
[image:3.612.314.540.480.670.2]manganese; red – oxygen, (b) Schematic profile view of a possible arrangement of the ordered regions within layers of Na0.35MnO2.
The entire experimental powder diffraction profile of
Na0.35MnO2 fits exceptionally well (χ
2
=1.6), see Fig. 1, by the
pattern calculated from the fragment of a MnO2 layer shown
in Fig. 2(a), with Mn-O distances of 0.1863 nm and the lengths of the elliptical axes of 2 and 4 nm. A nano-sized region of an individual layer fitting the whole experimental data proves that such region represents all the order within the powder. There is no crystallographic registry, or even stacking in any
regular fashion, of the MnO2 layers, in Fig. 2(b), and no
ordered pattern in the positions of the sodium atoms.
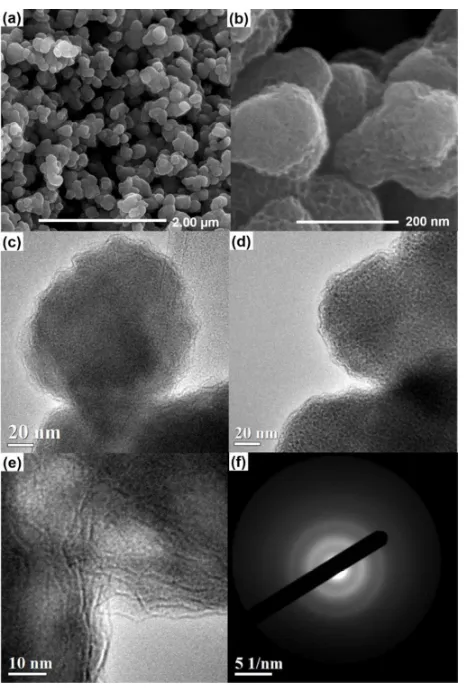
The structure and domain size of Na0.35MnO2 were
observed by field emission scanning electron microscopy (FE-SEM) and transmission electron microscopy (TEM), see Fig. 3. The powder consists of particles 200-250 nm in length and 150-200 nm in width, from Fig. 3(a) and 3(b). Moreover, the high-magnification SEM image in Fig. 3(b) shows the
aggregates of Na0.35MnO2 primary particles without a clear
inter-particle boundary.
Fig. 3 FE-SEM images of Na0.35MnO2 at low (a) and high (b) magnifications. (c-e),
TEM images of Na0.35MnO2 and (f), a selected area electron diffraction
(SAED) pattern.
TEM images in Fig. 3(c)-3(e)show that domains consist of
poorly ordered and randomly stacked MnO2 layers. The
disperse rings in the selected area electron diffraction (SAED)
pattern indicate the poor crystallinity of Na0.35MnO2 as shown
in Fig. 3(f). It is important to highlight that Na0.35MnO2 is
sensitive to the high energy electron beam and if viewed at higher magnifications (> x800k), it transforms to the
hausmannite crystalline phase of Mn3O4 (see ESI).
The lattice parameters are typical of Mn3O4, and the
change in crystallinity is confirmed by defined rings within the
SAED image and Raman spectroscopy.40, 41 The sheet length of
the ordered Mn3O4 layers formed under the electron beam are
seen to be either in the 2 nm or 4-5 nm range. This indirect observation corroborates our structure model.
The Raman spectrum of Na0.35MnO2 (Fig. 4) resembles
some of the characteristics of the spectrum typically reported
for Na–birnessite MnO2 and all four fitted peaks can be
assigned to Mn-O vibrational modes (Table 1).41 In particular,
the Raman bands at 651 cm-1, 577 cm-1 and 502 cm-1 can be
assigned respectively to the symmetric stretching vibration of
Mn-O band of MnO6 groups, Mn-O stretching within the basal
plane of the MnO6 sheet and Mn-O stretching vibration of
MnO6 octahedra.42, 43
200 300 400 500 600 700 800
In
te
n
s
it
y
(
a
.u
.)
Raman shift (cm-1)
Fig. 4 Lorentz fitting of Raman spectrum of Na0.35MnO2 (blue line is the envelope of
total of the fitted peaks).
The lack of order in the positions of the sodium atoms is supported by the absence of bands associated with the
stretching modes of NaO6 octahedron and NaO4 tetrahedron
for Na-birnessite that are typically observed below 450 cm-1.43,
[image:4.612.66.298.309.653.2]44
Table 1. Fitted Raman bandpositions and full width at half-maximum (FWHM) of Na0.35MnO2. Bands are assigned according to the literature.
43, 45, 46
Position (cm-1)
FWHM (cm-1)
Band Vibrational modes
651 49 υ1
Symmetric stretching
vibration of Mn-O band in
the MnO6 octahedra
618 57 υ2 Mn-O lattice vibration
577 27 υ3 Mn-O lattice vibration of
the basal plane of the
MnO2 sheets.
Journal
of
Materials
Chemistry
A
Accepted
Manuscript
[image:4.612.313.547.328.492.2] [image:4.612.310.544.613.711.2]COMMUNICATION
Journal Name
502 53 υ4 Mn-O stretching vibration
of MnO6 octahedra.
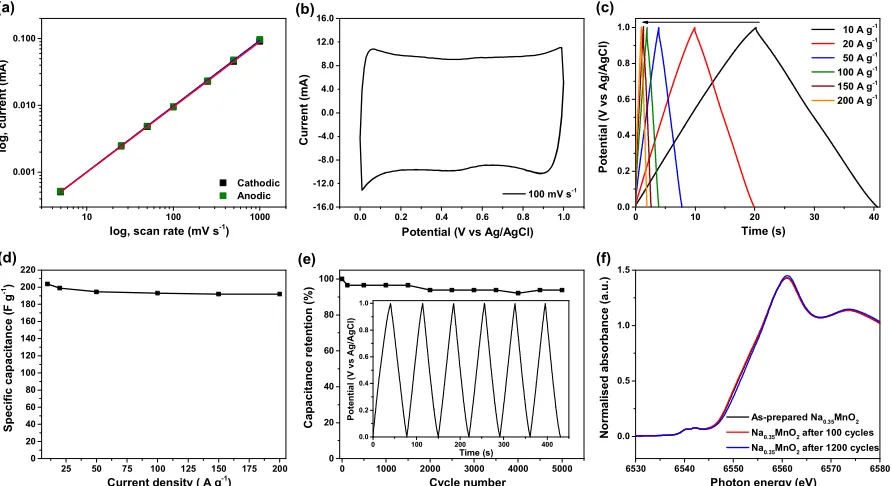
The current response was found to be linearly proportional to the scan rate of CV when the scan rate is varied between 5
and 1000 mV s- 1 (Fig 5(a)), thereby illustrating that Na0.35MnO2
is genuinely pseudocapacitive, where the charge storage mechanism is based on the surface redox processes (see ESI).
The ideal capacitive performance is demonstrated by the
near-rectangular CV curve measured at 100 mV s-1 (Fig 5(b)),
which is in contrast to chemically similar compounds that
display distinct redox peaks in their CVs.15, 47 Moreover,
rectangular CV curves were measured from scan rates
between 5 to 1000 mV s-1 (see ESI). The pseudocapacitive
nature of Na0.35MnO2 can be further supported by a low
specific surface area of 15 m2 g-1, using the
Brunauer-Emmett-Teller (BET) method (see ESI), with a total porosity of 0.0595
cm3 g-1. For bulk MnO2, pseudocapacitance is derived from the
redox activity of manganese at the surface/ near surface
region of the active material1 whereas the interior of MnO2
crystals remains mostly inactive.48 Typically, the charge storage
mechanism in neutral pH electrolytes is based on the
extraction of superficially adsorbed/absorbed Na+ cations
according to the reaction:
(2) + Na+ + e− ↔ (2−Na+)s (2)
Once within the aqueous electrolyte, we surmise that Na+
and H2O are located randomly between the MnO2 sheets,
permitting redox processes for both the surface and interior of the sheets. The arrangement of the sheets allow facile
exchange of Na+ and H2O from and to the bulk electrolyte
during charge and discharge. Na+ has a dual role of allowing
the formation of a disordered material during synthesis and being ready present to partake in the initial exchange of
speciation at the interface during electrode polarisation. To further explore the advanced pseudocapacitive
characteristics of the Na0.35MnO2, galvanostatic
charge-discharge measurements were carried out at various current densities and the results are shown in Fig. 5(c). The charge curves measured at all current densities are highly symmetrical to their corresponding discharge counterparts, revealing the
ideal capacitive property of the Na0.35MnO2 electrode. The
specific capacitance, (CS,Mn) of Na0.35MnO2 obtained at 10 A g-1,
calculated from the discharge curves in Fig. 5(c) was 204 F g-1
(see experimental). The iR drop (0.07 V) is low, even at the
high current density of 100 A g-1, indicating low internal
resistance of the electrode material. Accordingly, the CS,Mn
values of Na0.35MnO2 measured at 20, 50, 100, 150, and 200 A
g-1 are equal to 199, 195, 193, 192 and 192 F g-1, respectively
(see Fig. 5(d)). 94% capacitance is retained even when the current density has been increased by a factor of 20. Fig 5(e)
shows the cycle-life data of the Na0.35MnO2 in which no
significant capacitance loss (< 5 %) was observed after 5000 charge-discharge cycles.
Fig. 5 (a) Plots of cathodic and anodic currents of the Na0.35MnO2 electrode versus scan rates between 5 and 1000 mV s-1 in 0.5 M Na2SO4. (b) A cyclic voltammogram of
Na0.35MnO2 measured at 100 mV s -1
, (c) the galvanostatic charge-discharge curves at 10-200 A g-1, (d) specific capacitance of Na0.35MnO2 against the charge-discharge
current density at 10-200 A g-1, (e) the capacitance retention as function of the cycle number; where the inset shows charge/discharge curves of the Na0.35MnO2 between 0
and 1 V (vs. Ag/AgCl) at a current density of 5 A g-1 in 0.5 M Na2SO4 and 2 mM NaHCO3 and (f) X-ray absorption near-edge structure (XANES) spectra of as-prepared
Na0.35MnO2 (black), and after 100 cycles (red) and 1200 cycles (blue) of charge-discharge.
25 50 75 100 125 150 175 200
0 20 40 60 80 100 120 140 160 180 200 220
0 100 200 300 400
0.0 0.2 0.4 0.6 0.8 1.0
6530 6540 6550 6560 6570 6580
0.0 0.5 1.0 1.5
0 1000 2000 3000 4000 5000
0 20 40 60 80 100
0.0 0.2 0.4 0.6 0.8 1.0
-12.0 -4.0 4.0 12.0 -16.0 -8.0 0.0 8.0 16.0
10 100 1000
0.001 0.010 0.100
0 10 20 30 40
0.0 0.2 0.4 0.6 0.8 1.0 S p e c if ic c a p a c it a n c e ( F g -1)
Current density ( A g-1
) (d) P o te n ti a l (V v s A g /A g C l) Time (s)
As-prepared Na0.35MnO2
Na0.35MnO2 after 100 cycles
Na0.35MnO2 after 1200 cycles
N o rm a li s e d a b s o rb a n c e ( a .u .)
Photon energy (eV)
(f) C a p a c it a n c e r e te n ti o n ( % ) Cycle number (e)
100 mV s-1
C u rr e n t (m A )
Potential (V vs Ag/AgCl)
(b) Cathodic Anodic lo g , c u rr e n t (m A )
log, scan rate (mV s-1)
(a)
10 A g-1
20 A g-1
50 A g-1
100 A g-1
150 A g-1
200 A g-1
P o te n ti a l (V v s A g /A g C l) Time (s) (c)
Journal
of
Materials
Chemistry
A
Accepted
Manuscript
Published on 02 May 2017. Downloaded by University of St Andrews Library on 03/05/2017 11:47:09.
[image:5.612.83.529.163.406.2]The stability of Na0.35MnO2 is supported by the synchrotron
X-ray absorption measurements whereby the X-ray absorption near-edge structure (XANES) spectra demonstrate similar features for as-prepared and cycled (100 and 1200 cycles)
Na0.35MnO2. A multiple structure of pre-edge region at ca.
6541 eV can be observed for Na0.35MnO2 (Fig. 5(f) and ESI),
which are attributed to the partially allowed transition of a 1s electron to
an unoccupied 3d orbital.49 The split in the pre-edge peaks was
reported as the separation of degenerated 3d levels under the octahedral crystal field, which are corresponding to 1s to 3d
(t2g) and 1s to 3d (eg) transitions, respectively.
49
The main absorption edge around 6560 eV is assigned to the purely
dipole-allowed 1s to 4p transition.49 According to the
quasi-linear relationship, the Mn oxidation state of the as-prepared sample is 3.57, indicating a minor sub-stoichiometric presence
of oxygen within the material (i.e. Na0.35MnO1.96). For the
cycled samples, the Mn oxidation state and XANES features
remain similar, indicating the cycle stability of Na0.35MnO2,
where the oxidation state decreases marginally from 3.57 to 3.45 over 1200 cycles (see ESI).
The outstanding capacitive performance at high currents
up to 200 A g-1 can be explained by the nanostructure and
sheet dimensions of the synthesised Na0.35MnO2 that allow ion
transport throughout the material that is not limited by solid
state diffusion, in contrast to crystalline Na0.35MnO2 nanowires,
where capacitance is shown to decrease significantly with the
scan rate of CV.15
Conclusions
In summary, we present powders of 2D-ordered
manganese dioxide that comprised of randomly distributed
manganese oxide layers, size 2 x 4 nm, and sodium atoms located amongst them, also without forming a regular pattern. The dimensionality of the ordered domain is established by Debye refinement, an unrivalled tool for the task.
Due to such arrangement of the oxide layers, this ionic conductor was found to be genuinely pseudocapacitive, with charge storage not limited by diffusion of ions between
stacked layers. Under substantial current rates, up to 200 A g-1,
a capacitance greater than 190 F g-1 was maintained. The
material was incredibly stable, with no significant capacitance loss (< 5 %) after 5000 charge-discharge cycles.
The synthesised Na0.35MnO2 exhibits fast ion mobility due
to the formation of short interlayers (2 x 4 nm) and significantly capacitance was found to be not limited by the solid-state diffusion. The distinctive material property is its capacitance retention at exceptionally high current rates, thereby opening up a new approach of material design to take full advantage of surface redox sites to store and deliver charge.
Acknowledgements
We would like to acknowledge the support of the European Commission FP7 Project “Stable Interfaces for Rechargeable
Batteries” (SIRBATT) (FP7-ENERGY-2013, grant agreement No. 608502), the Royal Society and the Engineering and Physical Sciences Research Council (EPSRC) for the part funding of this
research under Grant Numbers EP/K016954/1 and
EP/N032888/1. The Ministry of Science and Technology, Taiwan (MOST 103-2911-I-007-515, 104-3113-E-006-005, NSC 102-2221-E-007-120-MY3) and the boost program from LCERC of National Tsing Hua University (NTHU) is acknowledged. We thank Diamond Light Source, UK for access to beamline B18 that contributed to the results presented here under BAG Proposal SP12120, PI Prof. Alan Chadwick and beam line scientist Dr Giannantonio Cibin. The Nanoinvestigation Centre at Liverpool (NiCaL) are acknowledged for access to the TEM. Part of the work was carried out within the cooperative framework set-up between NTHU, Taiwan and University of Liverpool, UK.
Notes and references
1 H. Y. Lee and J. B. Goodenough, J. Solid State Chem., 1999,
144, 220-223.
2 B. Babakhani and D. G. Ivey, J. Power Sources, 2010, 195,
2110-2117.
3 Q. Qu, P. Zhang, B. Wang, Y. Chen, S. Tian, Y. Wu and R.
Holze, J. Phys. Chem. C, 2009, 113, 14020-14027.
4 T. H. Wu, Y. H. Chu, C. C. Hu and L. J. Hardwick, Electrochem.
Commun., 2013, 27, 81-84.
5 J. Jiang and A. Kucernak, Electrochim. Acta, 2002, 47,
2381-2386.
6 W. Wei, X. Cui, W. Chen and D. G. Ivey, Chem. Soc. Rev.,
2011, 40, 1697-1721.
7 M. Toupin, T. Brousse and D. Bélanger, Chem. Mater. ,
2002, 14, 3946-3952.
8 S. Devaraj and N. Munichandraiah, J. Phys. Chem. C, 2008,
112, 4406-4417.
9 C.-C. Hu, C.-Y. Hung, K.-H. Chang and Y.-L. Yang, J. Power
Sources, 2011, 196, 847-850.
10 T.-H. Wu, D. Hesp, V. Dhanak, C. Collins, F. Braga, L. J.
Hardwick and C.-C. Hu, J. Mater. Chem. A, 2015, 3,
12786-12795.
11 Q. Qu, L. Li, S. Tian, W. Guo, Y. Wu and R. Holze, J. Power
Sources, 2010, 195, 2789-2794.
12 S. He and W. Chen, J. Power Sources, 2014, 262, 391-400.
13 J.-W. Wang, Y. Chen and B.-Z. Chen, J. Alloys Compd., 2016,
688, Part A, 184-197.
14 M. Huang, Y. Zhang, F. Li, L. Zhang, R. S. Ruoff, Z. Wen and Q.
Liu, Sci. Rep., 2014, 4, 3878.
15 B. H. Zhang, Y. Liu, Z. Chang, Y. Q. Yang, Z. B. Wen, Y. P. Wu
and R. Holze, J. Power Sources, 2014, 253, 98-103.
16 H. W. Kroto, J. R. Heath, S. C. O'Brien, R. F. Curl and R. E.
Smalley, Nature, 1985, 318, 162-163.
17 S. Iijima, Nature, 1991, 354, 56-58.
18 K. S. Novoselov, A. K. Geim, S. V. Morozov, D. Jiang, Y. Zhang,
S. V. Dubonos, I. V. Grigorieva and A. A. Firsov, Science, 2004,
306, 666-669.
19 L. Peng, Y. Zhu, D. Chen, R. S. Ruoff and G. Yu, Adv. Energy
Mater., 2016, 6, 1600025.
20 P. Wei, S. Lee, F. Lemaitre, L. Pinel, D. Cutaia, W. Cha, F.
Katmis, Y. Zhu, D. Heiman, J. Hone, J. S. Moodera and C.-T.
Chen, Nat. Mater., 2016, 12, 554-561.
Journal
of
Materials
Chemistry
A
Accepted
Manuscript
COMMUNICATION
Journal Name
21 G. Fiori, F. Bonaccorso, G. Iannaccone, T. Palacios, D.
Neumaier, A. Seabaugh, S. K. Banerjee and L. Colombo, Nat.
Nanotechnol., 2014, 9, 768-779.
22 F. Bonaccorso, L. Colombo, G. Yu, M. Stoller, V. Tozzini, A. C.
Ferrari, R. S. Ruoff and V. Pellegrini, Science, 2015, 347.
23 V. Nicolosi, M. Chhowalla, M. G. Kanatzidis, M. S. Strano and
J. N. Coleman, Science, 2013, 340.
24 A. K. Geim and K. S. Novoselov, Nat. Mater., 2007, 6,
183-191.
25 W. Wu, L. Wang, Y. Li, F. Zhang, L. Lin, S. Niu, D. Chenet, X.
Zhang, Y. Hao, T. F. Heinz, J. Hone and Z. L. Wang, Nature,
2014, 514, 470-474.
26 E. Navarro-Moratalla and P. Jarillo-Herrero, Nat. Phys., 2016,
12, 112-113.
27 P. Joensen, R. F. Frindt and S. R. Morrison, Mater. Res. Bull.,
1986, 21, 457-461.
28 K. R. Paton, E. Varrla, C. Backes, R. J. Smith, U. Khan, A.
O’Neill, C. Boland, M. Lotya, O. M. Istrate, P. King, T. Higgins, S. Barwich, P. May, P. Puczkarski, I. Ahmed, M. Moebius, H. Pettersson, E. Long, J. Coelho, S. E. O’Brien, E. K. McGuire, B. M. Sanchez, G. S. Duesberg, N. McEvoy, T. J. Pennycook, C.
Downing, A. Crossley, V. Nicolosi and J. N. Coleman, Nat.
Mater., 2014, 13, 624-630.
29 J. N. Coleman, M. Lotya, A. O’Neill, S. D. Bergin, P. J. King, U.
Khan, K. Young, A. Gaucher, S. De, R. J. Smith, I. V. Shvets, S. K. Arora, G. Stanton, H.-Y. Kim, K. Lee, G. T. Kim, G. S. Duesberg, T. Hallam, J. J. Boland, J. J. Wang, J. F. Donegan, J. C. Grunlan, G. Moriarty, A. Shmeliov, R. J. Nicholls, J. M. Perkins, E. M. Grieveson, K. Theuwissen, D. W. McComb, P.
D. Nellist and V. Nicolosi, Science, 2011, 331, 568-571.
30 Y. Hernandez, V. Nicolosi, M. Lotya, F. M. Blighe, Z. Sun, S.
De, I. T. McGovern, B. Holland, M. Byrne, Y. K. Gun'Ko, J. J. Boland, P. Niraj, G. Duesberg, S. Krishnamurthy, R. Goodhue,
J. Hutchison, V. Scardaci, A. C. Ferrari and J. N. Coleman, Nat.
Nanotechnol., 2008, 3, 563-568.
31 C. Sole, N. E. Drewett, F. Liu, A. M. Abdelkader, I. A. Kinloch
and L. J. Hardwick, J. Electroanal. Chem., 2015, 753, 35-41.
32 X. Xiao, H. Song, S. Lin, Y. Zhou, X. Zhan, Z. Hu, Q. Zhang, J.
Sun, B. Yang, T. Li, L. Jiao, J. Zhou, J. Tang and Y. Gogotsi, Nat.
Commun., 2016, 7, 11296.
33 Z. Sun, T. Liao, Y. Dou, S. M. Hwang, M.-S. Park, L. Jiang, J. H.
Kim and S. X. Dou, Nat. Commun., 2014, 5, 3813.
34 Z. Su, C. Yang, B. Xie, Z. Lin, Z. Zhang, J. Liu, B. Li, F. Kang and
C. P. Wong, Energy Environ. Sci., 2014, 7, 2652-2659.
35 Y. G. Andreev and P. G. Bruce, in Epdic 7: European Powder
Diffraction, Pts 1 and 2, eds. R. Delhez and E. J. Mittemeijer,
Trans Tech Publications Ltd, Zurich-Uetikon, 2001, vol. 378-3, pp. 148-153.
36 P. Debye, Ann. Phys., 1915, 351, 809-823.
37 Y. G. Andreev, P. M. Panchmatia, Z. Liu, S. C. Parker, M. S.
Islam and P. G. Bruce, J. Am. Chem. Soc., 2014, 136,
6306-6312.
38 Y. G. Andreev and P. G. Bruce, J. Appl. Crystallogr., 2016, 49,
24-30.
39 C. R. Fleeger, P. J. Heaney and J. E. Post, Am. Mineral., 2013,
98, 671-679.
40 T. Gao, H. Fjellvåg and P. Norby, Anal. Chim. Acta, 2009, 648,
235-239.
41 C. M. Julien, M. Massot and C. Poinsignon, Spectrochim. Acta
Mol. Biomol. Spectrosc., 2004, 60, 689-700.
42 K. W. Nam and K. B. Kim, J. Electrochem. Soc., 2006, 153,
A81.
43 C. Julien, M. Massot, R. Baddour Hadjean, S. Franger, S. Bach
and J. P. Pereira-Ramos, Solid State Ion., 2003, 159, 345-356.
44 A. Dias, R. G. Sá, M. C. Spitale, M. Athayde and V. S. T.
Ciminelli, Mater. Res. Bull., 2008, 43, 1528-1538.
45 D. Chen, D. Ding, X. Li, G. H. Waller, X. Xiong, M. A. El-Sayed
and M. Liu, Chem. Mater., 2015, 27, 6608-6619.
46 Y. K. Hsu, Y. C. Chen, Y. G. Lin, L. C. Chen and K. H. Chen,
Chem. Commun., 2011, 47, 1252-1254.
47 Q. T. Qu, Y. Shi, S. Tian, Y. H. Chen, Y. P. Wu and R. Holze, J.
Power Sources, 2009, 194, 1222-1225.
48 L. Mai, H. Li, Y. Zhao, L. Xu, X. Xu, Y. Luo, Z. Zhang, W. Ke, C.
Niu and Q. Zhang, Sci. Rep., 2013, 3, 1718.
49 K. W. Kim, M. G. Kim and K. B. Kim, J. Phys. Chem. C., 2007,
111, 749-758.
Journal
of
Materials
Chemistry
A
Accepted
Manuscript
Published on 02 May 2017. Downloaded by University of St Andrews Library on 03/05/2017 11:47:09.
84x59mm (300 x 300 DPI)