Mesoscopic Modeling of Primary Recrystallization of AA1050
with Curvature-Driven Interface Migration Effect
Dong-Kyu Kim
1, Ho Won Lee
2, Kyung-Hwan Jung
3and Yong-Taek Im
1,+1National Research Laboratory for Computer Aided Materials Processing, Department of Mechanical Engineering,
KAIST, 373-1, Gusongdong, Yusonggu, Daejeon 305-701, Korea
2Materials Deformation Department, Korea Institute of Materials Science,
797 Changwondaero, Changwon, Gyeongnam 642-831, Korea
3Computer Aided Engineering Team, Institute of Technology, Doosan Infracore,
39-3, Sungbok-Dong, Suji-Gu, Yongin-Si, Gyeonggi-Do 448-795, Korea
Primary recrystallization is an important phenomenon involved with cold deformation and heat treatment process. In the present investigation, a two dimensional probabilistic cellular automata model is used to simulate primary recrystallization of cold rolled AA1050, commercially pure aluminum. Electron backscatter diffraction measurement data was used as an input for the simulation to consider highly heterogeneous distribution of the stored energy and orientations compared to the randomly-distributed initial microstructure. Nucleation process was assumed to be site-saturated. Once a nucleus is formed, its recrystallization front will sweep the deformed regions by dissipating the stored deformation energy. In an attempt to contemplate anisotropic property of grain boundary migration, the grain boundary mobility was represented as a function of misorientation and the pressure was expressed as a function of dislocation density difference, curvature, and misorientation. The results of CA simulations were compared well with the JMAK theory in order to investigate the effects of nucleation criteria and curvature-driven pressure on the microstructure and the kinetics of primary recrystallization. This study revealed that local interface migration by curvature-driven pressure could significantly affect the recrystallization kinetics and microstructure morphology depending on the nucleation criteria. [doi:10.2320/matertrans.M2012267]
(Received July 31, 2012; Accepted October 10, 2012; Published December 25, 2012)
Keywords: primary recrystallization, cellular automata, curvature-driven pressure, microstructure, kinetics
1. Introduction
It is well known that evolution of microstructure and texture of the metallic materials is greatly dependent on the annealing process. During annealing, recrystallization plays an important role to control material properties such as strength, drawability, and magnetic permeability, in terms of the grain size, morphology and preferred orientation.1,2) In this context, it is necessary to improve understanding of underlying physical mechanisms during recrystallization and their influence on properties of the final products. Therefore, it is anticipated to be able to make an accurate prediction of the microstructure and material properties after annealing.
The microstructural dynamics during annealing is gov-erned by the behavior of interface migration. During primary recrystallization for pure metal, it was suggested that the interface migration rate of different boundary segments with similar boundary mobility is solely dependent on the volumetric driving pressure owing to the stored energy of the deformed structure.3) But in reality, the migration rate is
determined by the simultaneous presence of two driving forces driven by boundary curvature and stored deformation energy difference across the boundaries. Local scale recrystallization boundary segments with similar mobility and stored deformation energy may behave differently due to the difference of local curvature.4) Recently, Zhang et al.5)
experimentally assured this by examining the microstructural evolution with help of an ex-situ electron channeling contrast (ECC) technique using a thermalfield emission gun scanning electron microscope (SEM). They observed protrusions/
retrusions formed locally on recrystallization fronts and showed that protrusions/retrusions can locally provide a driving force of which magnitude is comparable to that of driving force contribution from the stored energy in the deformed matrix.57) In this regard, migration rate before
impingement of grain boundary is deemed to be dependent on the net driving forces determined by the interaction of two driving forces while it relies on the solely curvature-driven pressure after the conflicts of grain boundaries, resulting in grain coarsening. Although the mechanisms of the formation of protrusions/retrusions and how they evolve and influence the migration of recrystallization fronts during annealing are of great importance, experimental investigations on this matter are quite limited since it is very difficult and expensive to run.
Modeling and computer simulation is a good alternative to study recrystallization behavior. The theoretical model of the recrystallization kinetics has been introduced by Johnson, Mehl, Avrami and Kolmogorov (JMAK)8,9) for random
nucleation and isotropic growth. In reality, however, hetero-geneous nucleation and anisotropic grain boundary migration are generally observed due to highly heterogeneous distribu-tion of the stored energy and grain boundary characteristics. In order to overcome such limitations, several kinds of physically-based models such as phase field,10,11) vertex,12) Monte Carlo (MC)13,14)and cellular automata (CA)1419)were applied for a sophisticated computer simulation of recrystal-lization.
The most attractive point of these micro-mesoscale models is to predict the macroscopic behavior based on the consideration of the governing rules for the system at a microscopic level.14)Eventually, it is possible to demonstrate
the realistic simulation of microstructural change during
+Corresponding author, E-mail: ytim@kaist.ac.kr
recrystallization based on fundamental physics rather than merely relying on the empirical and phenomenological relations. Especially, CA has been widely used for modeling a variety of phenomena in the field of recrystallization, including static, metadynamic, and dynamic recrystallization since CA can readily handle both spatial and temporal evolution of a complex system.14)The advantages of the CA model over other discrete microstructure models are intuitive scalability and computational simplicity. From practical point of view, it is quite easy to conduct the time-scaling with respect to the space since the recrystallization kinetics is implemented via the linearized rate equation on the discrete lattice. In the MC technique, however, it is difficult to scale MC step to the real time and physical space since the boundary migration by a curvature-driven force can be implemented by the reduction in interface energy which is added to the Hamiltonian of the system owing to the state configuration change. Furthermore, the probabilistic cellular automata model is numerically efficient and phenomenolog-ically sound since it lowers the complexity in code because of the adoption of the probabilistic analogue of the rate equation for thermally activated grain-boundary segment motion under the influence of free energy gradients.15) In the phase-field
model, however, it is computationally cumbersome to conduct the simulation although it enables the quantitative simulation of grain growth in time and space and the curvature-driven interface migration can automatically be considered.
In the present investigation, a two dimensional probabil-istic CA model was used to simulate primary recrystallization of cold rolled AA1050, commercially pure aluminum. The objective of this study is to look into the effects of different criteria for site-saturated nucleation and curvature-driven pressure on the kinetics of primary recrystallization and the microstructure. The motivations of the present study are driven from two considerations. Firstly, the features of nuclei formation such as the level of nuclei clustering and the number of nuclei rely on the critical value for triggering nucleation. Secondly, for the simulation of primary recrystal-lization, most researchers had neither paid attention to the influence of surface energy driven by the boundary curvature nor even considered it just for simplicity although curvature-driven pressure exists during primary recrystallization. In order to achieve realistic calibration of time and space, experimental material parameters for grain boundary mobility and pressure were used in simulations. Besides, electron backscatter diffraction (EBSD) measurement data was used as an input for the CA simulation in order to reflect realistic information on the initial microstructure. In this regard, highly heterogeneous distribution of the stored energy and orientations over the initial microstructure were considered in the simulation. The results of CA simulations were compared with the JMAK theory in order to investigate the effects of nucleation criteria and curvature-driven pressure on the microstructure and the kinetics of primary recrystallization. The simulation results show that local interface migration of protrusions/retrusions of recrystallization fronts owing to the curvature-driven pressure could significantly affect the recrystallization kinetics and grain morphology according to the present investigation.
2. Experiment
Commercially available pure aluminum, AA1050, was flat-rolled at room temperature up to 1 mm in thickness with its reductions of 75%. After cold deformation, specimens were prepared by sectioning in the plane normal to the transverse direction and then mechanical polishing was applied. Additional electrochemical polishing using A2 electrolyte was used in order to make the surface of the specimen stress free for EBSD measurements. Crystallo-graphic orientation detection was made by using EBSD system (EDAX-TSL/Hikari) attached to a field emission scanning microscope (FESEM, FEI/Nova230). The accel-erating voltage was 15 kV and the probe current was 16 nA with a working distance of 11 mm.
3. Details of the Simulation Procedure
3.1 Estimation of stored deformation energy
Prior to applying the CA algorithm to the EBSD measure-ment data, evaluation of the stored deformation energy due to cold rolling was conducted by converting the orientation image quality into the dislocation density. It is known that image quality resulting from Hough transformation for indexing Kikuchi pattern is related to the number of lattice defects like dislocations, indicating the level of deformation and internal stresses.20,21) Accordingly, pattern quality is
expected to be lower for the case of highly deformed regions such as shear bands, transition bands and in the vicinity of prior grain boundaries. This means that image quality can be considered as a measure of the dislocation density.
The stored energy for each cellSican be expressed to be
proportional to the image quality distribution for each cellIi
as follows:16)
Si/Ii¼Imax 1QQiQmin maxQmin
ð1Þ
whereQiis the image quality at the site i, andQmaxandQmin
are the maximum and minimum values of the image quality, respectively. For an estimate of the dislocation density, a relation between the flow stress · and dislocation density μ can be represented as follows:1)
·¼¡Gbpffiffiffiμ ð2Þ
where ¡ is a constant of the order of 0.5, G the shear modulus, and b the Burgers vector. The stored energy S is given as1)
S¼cGb2μ ð3Þ
where cis a constant of the order of 0.5. The factor Imaxin
eq. (1) is supposed to be equal to the maximum stored energy corresponding to theflow stress obtained from the compres-sion test for the case of deformation of 75% reductions in thickness and it can be calculated by combining eqs. (2) and (3) as follows:
Imax¼cGb2μ¼cGb2 · ¡Gb 2
ð4Þ
As a consequence, the dislocation density for each cell μi
μi¼ 2Ii Gb2 ¼
2Imax
Gb2 1
QiQmin QmaxQmin
ð5Þ
3.2 Cellular automata model
The nucleation process was assumed to be site-saturated and the recovery was not taken into account since it is very rapid due to the high stacking fault energy for the material used in the present study.19) Phrased differently, at the very incipient stage, all the nuclei were generated by examining every site if the accumulated amount of dislocation density was higher than a critical value. Once nucleation criterion was triggered, the state of the cell was switched to be nucleated without any change in orientation, dropping dislocation density to zero.
Then the nuclei start to grow into the deformed matrix. It is generally known that grain boundary migration rate v is proportional to the net pressurep as follows:
v¼mp ð6Þ
where mis the grain boundary mobility which is a function of the misorientation ¦ª between each grain boundary site and its neighboring cells and the temperature T as follows:1,22)
m¼m0exp QkTb
1exp 5 ª 15 4
( )
" #
ð7Þ
where m0 is a constant for high angle boundary, Qb the
activation energy of grain boundary movement, k the Boltzmann’s constant, and T is the temperature in Kelvin. For calculation of misorientation, the Euler angles were converted into the orientation matrix and then the misori-entation matrix M12 was computed from the orientations of
site 1 and site 2 belonging to each grain as follows:2)
M12¼g2g11 ð8Þ
whereg1andg2are the orientation matrices for each site. The
angle of rotation¦ªcan be extracted from the misorientation matrix M12 as follows:
ª¼arccosfðtrðM12Þ 1Þ=2g ð9Þ
The minimum among all the possible 24 crystallograph-ically equivalent misorientations was selected in consider-ation of cubic symmetry.
The net pressure, pin eq. (10) consists of the volumetric stored deformation energy, p1 in the form of the dislocation
density difference¦μbetween each grain boundary site and
its neighboring cells and the surface energy,p2driven by the
boundary curvature¬as follows:1)
p¼p1p2¼¸μ¬£ ð10Þ
where ¸¼cGb2 is the dislocation line energy and £ the grain boundary energy which was approximated by Read-Shockley relation23)for the low angle boundary below 15° as follows:
£¼£High ª
15 1ln ª
15
ð11Þ
where£Highis the high angle boundary specific energy.
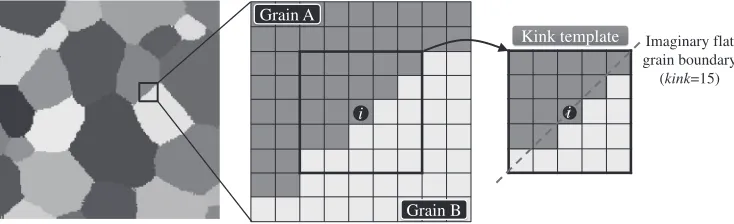
In the CA simulation, the evolution of microstructure was calculated based on the kink-template approach introduced in the literature.14,17) According to the work by Janssens
et al.,14)a kink-template neighborhood can be represented by
Fig. 1. This figure shows the 5©5 matrix that includes the center cell i. Then, the local curvature can be approximated by counting the neighbor cells enclosed by the bold line in the kink-template in this figure. According to the same literature,14)the grain growth was successfully determined by
the kink-template of such 5©5 matrix. In this kink-template, the number of cells, Nc, belonging to the same grain as the
center cell i represented in colored dark cells in Fig. 1 can be counted as 14. A reference number, Kink which covers the same grain for an imaginary flat grain boundary indicated by the dashed line in the samefigure, was counted to be 15. The difference between Kink and Nc can represent the
deviation from the imaginaryflat grain boundary.
In the present study, the difference between Kink and Nc
was normalized by the multiplied value of the cell size,
LCA=0.05 µm and the number of cells in the kink-template
neighborhood. In order to approximate the local curvature with the normalized value, it is necessary to introduce a coefficientCin the following equation.
¬¼C KinkNc
LCAðNþ1Þ ð12Þ
Here, N is the number of cells in the kink-template neighborhood except for the center cell i and is counted to be 24. The coefficientCwas determined such that whenNc
equals to 14, the curvature-driven pressure p2 at the high
angle grain boundary was set to be 0.6 MJ m¹3, which was an
experimentally determined average value by Zhang et al.5)
Since the surface energy at the high angle grain boundary
£ was given as 0.6 J m¹2 in Ref. 1), the coefficient was
determined to be 1.25 in the present work as follows: Grain A
Grain B
Kink template Imaginary flat
grain boundary (kink=15)
i i
[image:3.595.114.481.71.183.2]C¼p2
£
LCAðNþ1Þ
KinkNc ¼1:25 ð13Þ
It should be noted that the grain boundary can have velocities and move even after the impingement of growing grains due to the curvature-driven pressure which results in the grain coarsening.
A caution must be paid when implementing the algorithm for computing the local curvature in the CA simulation. In order to prevent the recurrence, it was assumed that the only boundary cells with positive curvature could have a curvature-driven pressure since negative curvature let the grain boundary move away from the site at which it is calculated. The direction for a grain boundary to migrate is determined depending on the sense of the net driving pressure, as described in Fig. 2. Net driving pressure will either increase or decrease by protrusion and retrusions of local recrystallization fronts, respectively. After impingement of recrystallization fronts, grain coarsening by curvature-driven pressure will proceed. If the sign of the net pressure is negative for the case in Fig. 2(b), no state transition is expected to be accepted. Once a matrix is recrystallized by the sweep of the recrystallization front, there is little chance to reversely transform into the original state.
Once the migration rates at the boundaries are determined, recrystallization fronts begin to proceed into the deformed matrix complying with the probabilistic transformation rule which has the capability to introduce locally varying grain boundary velocities. The probability functionPfor each cell was defined as follows:14,15)
P¼SFmlocalplocal
mmaxpmax ð14Þ
where mlocal and plocal are the local mobility and pressure, respectively. mmax and pmax are the globally occurring maximum mobility and pressure, respectively. SF is the shape factor for attenuating the grid effect, for which one could come up with a growing geometry similar to the shape of the neighborhood, by using different weight factors for each facing and diagonal direction in the Moore neighbor-hood. After evaluating the probability function, the simu-lation proceeds by switching the cells according to the local switching probability. To put it another way, the switch was
accepted only if the local switching probability was larger than a random numberr(0<r<1).
Since space and time are coupled quantities, the time step
¦t at each CA step can be calculated by the time-space scaling as follows:
t¼LCA
vmax ð15Þ
where LCA is the cell size of the CA grid and vmax is the
occurring maximum velocity of the grain boundary at each CA step.
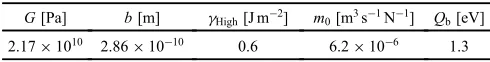
The simulations were conducted on the grid of 100©400 with the cell size of 0.05 µm according to the step size of the EBSD measurements. The annealing was assumed to be an isothermal heat treatment at temperature of 400°C. The material parameters used are shown in Table 1.
4. Results and Discussion
4.1 Characterization of the cold-rolled microstructure Primary recrystallization takes place owing to the migra-tion of pre-existing boundaries in the deformed micro-structure and is driven by the stored energy of the substructure.24)In this regard, it is important to characterize
the cold-rolled microstructure. The measured EBSD data of the cold-rolled initial microstructure is shown in Fig. 3. During cold rolling of single phase polycrystalline aluminum alloys such as AA1050, well-defined subgrain structures were formed. Besides, it was demonstrated that the micro-structure evolved into a high-energy submicro-structure in which grain boundaries and high-energy dislocation boundaries are aligned with the rolling direction as pointed out by Hurley and Humphreys.24) Due to this high-energy microstructure,
the number of nucleation sites during recrystallization could increase and result in the grain refinement after recrystalliza-tion. As expected, the Kikuchi pattern quality was found to
[image:4.595.122.475.68.232.2]Fig. 2 Schematic diagrams describing the sense of a net pressure at the grain boundary.
Table 1 Material parameters for pure aluminum used in the simulation.1,15)
G[Pa] b[m] £High[J m¹2] m0[m3s¹1N¹1] Qb[eV]
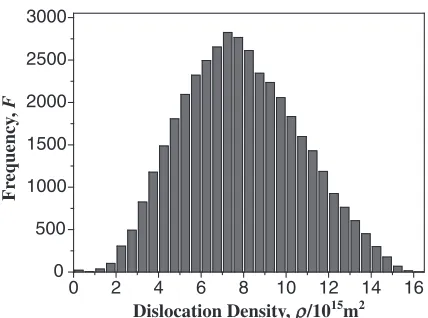
[image:4.595.304.549.289.320.2]be lower for the regions such as shear bands, transition bands and in the vicinity of prior grain boundaries. The stored deformation energy due to the cold rolling was calculated in terms of the dislocation density by using eq. (5). Figure 4 shows the distribution of the calculated dislocation density, which was found to be normal distribution.
4.2 Simulations using different nucleation criteria The influence of nucleation criterion on primary recrystal-lization was investigated by employing two sorts of site-saturated nucleation criteria: 80 and 90% of the occurring maximum dislocation density as a trigger for the nucleation, respectively.
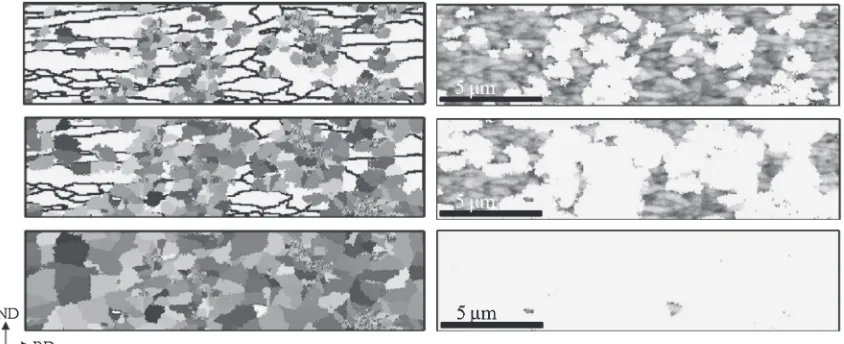
The microstructural evolution of primary recrystallization and the distribution of the stored deformation energy in the form of the dislocation density are shown in Figs. 58 for different site-saturated nucleation criteria without or with curvature-driven pressure. The maps on the left-hand side of each one show the microstructural evolution and black lines represent prior grain boundaries. The maps on the right-hand side show distributions of the accumulated dislocation density in the gray level, of which the darker one represents the higher stored energy. The simulated microstructures
reveal that nucleation occurs highly inhomogeneously at preferred sites such as prior grain boundaries and deformation bands. Due to the locally concentrated stored deformation energy, nucleation tends to happen in the form of clusters.
In order to analyze the kinetics during recrystallization, the classical description to the recrystallization kinetics, the JMAK theory was utilized for comparison. The JMAK equation for statistical isotropic recrystallization is expressed by
XV¼1exp½ðt=tRÞn ð16Þ
where XV is the recrystallized volume fraction, tR the
reference time, andn the Avrami exponent.
In the case of two dimensional primary recrystallization with the site-saturated nucleation, the Avrami exponent will be 2 which is valid only under several assumptions of the JMAK theory such as the equiaxed initial grain structure, random distribution of nucleation, isotropic growth, constant growth rate, and uniform impingement of recrystallizing grains.
Figure 9 shows the recrystallized volume fraction with annealing time. After nucleation, all the curves were followed by an increasing rate of recrystallization, linear regions, and finally a decreasing rate of recrystallization. It reveals that for the case of nucleation criterion of μc=0.8μmax initially
recrystallized volume fraction abruptly increased since nuclei were generated in the form of clusters, yielding heteroge-neous nucleation.
[image:5.595.88.506.67.246.2]The amount of volume fractions of nuclei is summarized in Table 2 in terms of criteria for site-saturated nucleation. Such a nuclei clustering was stronger with a nucleation criterion of
μc=0.8μmax, meaning the larger deviation from the JMAK
theory. It is notable that not all the nuclei could grow into the deformed matrix because of two reasons. One reason would be the situation in which a nucleus is enclosed by other nuclei in all directions of its neighborhood. Secondly, it is attributed to the small misorientation (called orientation pinning) accordingly, yielding very low mobility of its grain boundary to the neighboring cells in the deformed area. This indicates that triggering nucleation criterion is not a sufficient condition for nuclei to grow into the deformed area.
Fig. 3 The EBSD measurement data of (a) inverse polefigure map and (b) Kikuchi pattern image quality map (high and low angle boundaries are marked with blue and red lines, respectively).
0 2 4 6 8 10 12 14 16 0
500 1000 1500 2000 2500 3000
Dislocation Density, ρ/1015m2
Fr
equency
,
F
[image:5.595.63.277.297.456.2]Figure 10 describes the kinetics in terms of the Avrami exponents represented by the slopes of the lines. For all the cases, the slopes were less than an ideal value of 2.
The discrepancy is ascribed to the non-random spatial distribution of nuclei and the anisotropic grain boundary migration due to heterogeneous distribution of the stored
Fig. 5 Simulated microstructural evolution and distribution of dislocation density according to the recrystallized volume fraction of 33, 66, 99%with volumetric pressure only and nucleation criterion ofμc=0.8μmax.
Fig. 6 Simulated microstructural evolution and distribution of dislocation density according to the recrystallized volume fractions of 33, 66, 99%with volumetric pressure only and nucleation criterion ofμc=0.9μmax.
[image:6.595.89.511.71.243.2] [image:6.595.90.510.295.470.2] [image:6.595.94.510.524.700.2]energy and orientations. During the simulations with EBSD data as an input, grains hardly propagated in a certain direction of low mobility and stored energy whereas they readily grew in the direction of high mobility and stored energy. In other words, recrystallizing grains could have varying velocities along with their boundary according to the mobility and stored energy in the neighborhood. This led to the non-uniform impingement of the grain boundaries. As a result, all the factors mentioned above contributed to lowering the slopes of the curves. Especially, the level of heterogeneity and anisotropy for the case of nucleation criterion ofμc=0.8μmaxwas severer, resulting in the larger
deviation from the JMAK theory. Hence, the slopes for the case of nucleation criterion of μc=0.8μmax were even
less than those for the case of nucleation criterion of
μc=0.9μmax.
4.3 Simulation of primary recrystallization with the curvature-driven pressure
In order to identify the effect of curvature-driven pressure on the primary recrystallization, the simulation was carried out by using net pressure involving with both volumetric and curvature-driven pressures.
As shown in Figs. 7 and 8, it was found that the resulting microstructures obtained by introducing the curvature-driven pressure show the morphologies of the smoother grain boundaries. Furthermore, the majority of the nuclei clusters, which were generated at the initial stage of the simulation, vanished. This can be observed in Fig. 11, in which the simulated grain size distributions following the recrystalliza-tion up to 99% are given. For the cases without curvature-driven pressure, initially created nuclei clusters and small grains still remained after the recrystallization. The simulated grain size distributions obtained by adopting the curvature-driven pressure correspond to the fact that a log normal distribution of the grain size is generally observed in the experiments.1) The reason for this is the grain boundary
[image:7.595.89.509.69.248.2]migration by the curvature-driven pressure even during primary recrystallization. As a result, the average grain
Table 2 The amount of recrystallized volume fraction in terms of site-saturated nucleation criteria.
Nucleation criterion Initially recrystallized volume fraction
μc=0.9μmax 0.57%
μc=0.8μmax 4.17%
Recrystallized Fraction,
X
Time, t/s
Fig. 9 Recrystallization kinetics in terms of the recrystallized volume fraction.
Fig. 8 Simulated microstructural evolution and distribution of dislocation density according to the recrystallized volume fractions of 33, 66, 99%under consideration of both volumetric and curvature-driven pressure with nucleation criterion ofμc=0.9μmax.
ln(ln(1/(1-X
)))
ln(
t
)
1.58 1.81
[image:7.595.62.277.294.455.2]1.86 1.94 Slope
[image:7.595.318.536.297.479.2] [image:7.595.46.292.529.570.2]diameter after the recrystallization can vary depending on the curvature-driven pressure as shown in Fig. 11. The averge grain diameterD was calculated as follows:
D¼
Xn
i¼1 AiDi
Xn
i¼1 Ai
; Di¼ ffiffiffiffiffiffiffiffi 4Ai ³
r
ð17Þ
wherenis total number of grains,Aiis the area of grain i, and
Diis the diameter of grain i.
As shown in Fig. 9 for the case of nucleation criterion of
μc=0.8μmax, the rate of recrystallization decreased with the
help of curvature-driven pressure. Since the net pressure was reduced by the curvature-driven pressure which usually acts towards the center of a growing grain, curvature-driven pressure slowed it down by inhibiting the recrystallizing fronts from moving towards the deformed matrix. In the case of nucleation criterion of μc=0.9μmax, by contrast, the
influence of the curvature-driven pressure was marginable. It seems that the reason to get the different results according to the nucleation criteria is the size difference of the growing grains for each nucleation criterion. The sizes of recrystal-lizing grains for the case of nucleation criterion of μc=
0.9μmaxwere larger than the ones for the case of nucleation
criterion of μc=0.8μmax due to the sparser distribution of
nuclei. Since the boundary curvature becomes smaller as the grain size increased, the influence of the curvature-driven pressure was insignificant for the case of nucleation criterion of μc=0.9μmax.
When it comes to the kinetics in terms of the Avrami exponent, the slopes of the lines in Fig. 10 became closer to
the ideal value 2 for both nucleation criteria by introducing the curvature-driven pressure. Two reasons are conceivable for this. At first, it is attributed to the fact that if a grain grows preferentially in a specific direction in the mode of anisotropic growth, the local curvature in that direction of the grain becomes greater. It means that the curvature-driven pressure gets considerable and suppresses the recrystalliza-tion front from proceeding to that direcrecrystalliza-tion, leading to less non-uniform impingement of the grain boundaries. Secondly, it can be explained by the effect of the grain coarsening by the curvature-driven pressure. This pressure makes both kinds of impinging and recrystallizing grain boundaries even and smooth. In addition, it eliminates small grains so that the boundary migrations of recrystallizing grains are less likely to be retarded in a certain direction due to the impingement of grain boundaries compared to the case of the volumetric pressure only. Therefore, the kinetics of recrystallization tended to follow the JMAK theory.
5. Conclusions
In this paper, a two dimensional CA simulation was conducted using the EBSD data as an input in order to investigate the effects of curvature-driven pressure and different nucleation criteria on the primary recrystallization. As a result, the level of nuclei clustering was higher for the case of nucleation criterion ofμc=0.8μmax, representing the
larger deviation from the JMAK theory. It was notable that not all the nuclei could grow in spite of triggering the nucleation criteria. Hence, triggering the nucleation criteria was not a sufficient condition for a nucleus to grow. When introducing the curvature-driven pressure, the majority of the
Relati
v
e Fr
equency
,
f
Relati
v
e Fr
equency
,
f
Relati
v
e Fr
equency
,
f
Relati
v
e Fr
equency
,
[image:8.595.104.491.68.345.2]f
nuclei clusters, which were generated at the incipient stage, vanished and the morphology of recrystallizing grain boundaries was found to become smoother. Furthermore, the rate of recrystallization decreased considerably for the case of nucleation criterion of μc=0.8μmax since the net
pressure was reduced by the curvature-driven pressure due to small size of growing grains. The anisotropic behavior of the recrystallizing grain boundary movement and the tendency of boundary migration retardation due to the impingement of grain boundaries were weakened by introducing the curva-ture-driven pressure. As a result, the level of discrepancy with the JMAK theory was reduced.
Acknowledgment
The authors wish to acknowledge the grant of POSCO without which this work would not have been possible.
REFERENCES
1) F. J. Humphreys and M. Hatherly: Recrystallization and Related Annealing Phenomena, (Elsevier, Oxford, UK, 2004).
2) V. Randle and O. Engler:Introduction to Texture Analysis, (ORC, New York, USA, 2000).
3) F. Haessner: Recrystallization of Metallic Materials, (Dr. Riederer Verlag, Stuttgart, Germany, 1978).
4) Y. Zhang, A. Godfrey, Q. Liu, W. Liu and D. Juul Jensen:Acta Mater.
57(2009) 26312639.
5) Y. Zhang, A. Godfrey and D. Juul Jensen:Scr. Mater.64(2011) 331 334.
6) Y. B. Zhang, A. Godfrey and D. Juul Jensen: Comput. Mater. Continua
14(2009) 197207.
7) Q. Liu, D. Juul Jensen and N. Hansen:Acta Mater.46(1998) 5819 5838.
8) W. A. Johnson and R. F. Mehl: Trans. AIME135(1939) 416458. 9) M. Avrami:J. Chem. Phys.7(1939) 11031112.
10) T. Takaki, T. Hirouchi, Y. Hisakuni, A. Yamanaka and Y. Tomita:
Mater. Trans.49(2008) 25592565.
11) T. Takaki, A. Yamanaka, Y. Higa and Y. Tomita:J. Computer-Aided
Mater. Des.14(2007) 7584.
12) F. J. Humphreys:Scr. Mater.27(1992) 15571562.
13) S. H. Choi and J. H. Cho:Mater. Sci. Eng. A405(2005) 86101.
14) K. G. F. Janssens, D. Raabe, E. Kozeschnik, M. Miodownik and B. Nestler:Computational Materials Engineering, (Elsevier, Oxford, UK, 2007).
15) D. Raabe:Philos. Mag. A79(1999) 23392358.
16) H. W. Lee and Y. T. Im:Int. J. Mech. Sci.52(2010) 12771289.
17) C. Zheng, N. Xiao, D. Li and Y. Li:Comp. Mater. Sci.45(2009) 568 575.
18) H. W. Lee and Y. T. Im:Mater. Trans.51(2010) 16141620.
19) G. Kugler and R. Turk: Scr. Mater.37(2006) 284291.
20) A. J. Wilkinson and D. J. Dingley:Acta Metall. Mater.39(1991) 3047 3055.
21) S. H. Choi and Y. S. Jin:Mater. Sci. Eng. A371(2004) 149159.
22) Y. Huang and F. J. Humphreys:Acta Mater.48(2000) 20172030.
23) W. T. Read and W. Shockley:Phys. Rev.78(1950) 275289.