Munich Personal RePEc Archive
Methodological challenges in building
composite indexes: Linking theory to
practice
Santeramo, Fabio Gaetano
University of Foggia
1 September 2016
Online at
https://mpra.ub.uni-muenchen.de/73276/
Methodological challenges in
building composite indexes:
Linking theory to practice
1Fabio Gaetano Santeramo
Università degli Studi di Foggia, Italia
ABSTRACT
Composite indicators are emerging in several fields and disciplines as appealing method to synthesize a multitude of information, in a compact, single, and unique way. The process of aggregating heterogeneous information is itself very challenging and exposed to numerous threats. The chapter deepens on the methodological challenges that scientists, analysts, and final users must be aware of for a correct interpretation of the composite indexes. By mean of a worked example on the construction of composite indicators for food security, the chapter concludes that while different normalization and weighting approaches do not alter composite indicators, data imputation and aggregation methods are the most crucial steps: different methods convey very different results. For instance, the adoption of different aggregation procedures may largely alter the rankings based on composite indicators. In sum, the analysis shows that the index construction decisions matter and comment on policy and practical implications for the construction of composite indicators.
Keywords: Composite Indicator, Food Security, Data Aggregation, Data Imputation, Normalization, Weighting, FAO, Development, Economics
INTRODUCTION
Composite indicators are emerging in several fields and disciplines as appealing method to synthesize a multitude of information, in a compact, single, and unique way (Santeramo et al., 2012; Caracciolo and Santeramo, 2013; Dobrota et al., 2015; Mahadevan and Hoang, 2015; Santeramo, 2015, 2016; Santeramo and Shabnam, 2015; Alam et al., 2016; Maricic et al., 2016). The process of aggregating heterogeneous information is itself very challenging and exposed to numerous threats. The chapter deepens on the methodological challenges that scientists, analysts, and final users must be aware of for a correct interpretation of the composite indexes. The added value of this chapter is it builds on a worked example: the construction of composite indicators for food security. Food security is one of the most debated topic, the main theme of the world EXPO 2015, and the first of the Millennium Goals. Needless to say, there has been much debate on food security (Wheeler and von Braun, 2013; Hertel, 2016). Numerous indicators of food security have been proposed aimig at establisshing the level of food security at country level. Such a variey of indicators and the lack of consensus on how to evaluate policies (and outcomes) aimed at reducing food insecurity, have pushed international organizations to adopt composite indexes to synthesize the information. From a practical pont of view, the construction of composite indexes consist of several steps: indeed, each choice is able to influence the composite indicator (Nardo et al., 2005).
The chapter is intended to achieve two goals: first I aim at providing an helicopter view of the process of building composite indicators, from the analyst point of view; second, I provide a practical example of how heterogeneous information are synthesized in a single index and highlight the warnings that should be clear to analysts, policymakers, and audience, when computing, examining or reading results from composite indicators. The chapter is divided in different sections. The methodological section, which follows the present section, presents the steps required to build a composite indicator; the worked example on Food Security puts the theory into practice; the paragraph is followed by a digression on how
policymakers and the large audience should interpret composite indicators; the final section concludes with suggestions for future research.
In particular, the worked example provides insights on the challenges faced by analysts called to measure food security. The debate is hot as attested by the large number of articles published on this issue, and the large number of indicators on food security (Gabbert and Weikard, 2001; Carletto et al., 2013; Aurino, 2014; Cafiero et al. 2014; Santeramo, 2015a, 2015b; Svedberg, 2011; Carman et al., 2016; Ames et al., 2016). I provide a practical example by computing several composite indexes for food security by using data provided by the Food and Agricultural Organization. I evaluate a set of techniques that are adopte in the construction of composite indicators. In particular I assess the relevance of methods to impute, homogenize, weight and aggregate data in order to compute composite indexes are compared and the relevancy of the choices to be made will be discussed. I conclude that while different normalization and weighting approaches do not alter composite indicators, data imputation and aggregation methods are the most crucial steps: different methods convey very different results. In sum, I show that the index construction decisions matter. The last two sections go beyond the methodology and focus on the implications of my findings for practitioners, policymakers, and audience. In particular, I discuss how we should interpret the result of composite indexes in order to minimize the impact of discretionary choices.
All in all, the chapter guides the reader to understand how theory and practice match (or not) when we synthesize composite/complex information into single indicators.
BACKGROUND AND METHODOLOGY
The process of building a composite indicator is challenged in many ways and in paticular previous assessments of strategic objectives have been incorrectly conducted due the use of “indicators that were not systematically SMART [that is Specific, Measurable, Achievable, Relevant and Time-bound] and were often focusing on outputs and activities” (FAO, 2013). Moreover, composite indicators are inherently threatened by the low quality of indicators, the infeasibility of desired indicators, the necessity of homogenizing standards and frameworks. The FAO (2013) suggests that the entire process should “enhance capacities of data users to use information more effectively, and how data are used could even be monitored in order to justify enhancements and to allow for better prioritization. A continuous and joint assessment of data needs as well as of existing available data, is essential in order to identify gaps and agree on actions to address them”. The above picture clarifies the challenges for the next future. Constructing composite indicators is only the first, yet crucial, step to be achieved to understand the phenomenon under analysis.
The present report summarizes the different phases involved in the realization of a composite index. An excellent reference is provided by Nardo et al. (2005). Following the handbook, I divide the process of building a composite indicator in six main points:
(1) Defining the phenomenon – The step consists in defining the thoretical basis for the selection and combination of single indicators into a composite indicator.
(2) Selecting variables – The second step is also very important is that the single indicators need to be picked on the basis of several features: analytical soundness, measurability, country coverage, relevance to the phenomenon being measured and relationship to each other. In addition, when direct data are not available,
ad hoc proxy variables may be adoptd.
(3) Filling the gaps - Consideration should be given to different approaches for imputing missing values. Extreme values should be examined as they can become unintended benchmarks.
(4) Homogenizing the information - Indicators should be normalized to render them comparable.
(5) Weighting and aggregating – Indicators should be aggregated and weighted according to the underlying theoretical framework. Multivariate analysis could be a preliminary or complementary step.
(6) Validating the composite indicator – The validation of the composite indicator is aimed at the assessment of the robustness of the composite indicator. Finally, attempts should be made to correlate the composite indicator with other published indicators as well as to identify linkages through regressions.
The remainder of this chapter deepens on theoretical and empirical issues. The final goal is to present how to build a composite indicator and provide a worked example: the construction of a composite indicator for food security.
RESEARCH CONTEXT
indicator to measure and evaluate a complex phenomenon. The first step “Defining the phenomenon” is the starting point of any composite indicators has to be the definition of the phenomenon under investigation and I aim at measuring.
A precise and concise definition of the complex phenomenon is a necessary, although not sufficient, prerequisites for constructing a useful composite index. It is very likely that a badly defined concept will be badly measured, monitored and evaluated, exactly as we would never be able to target a goal we have not clear in mind.
From a more practical perspective, the first step of the analysis consists in defining the concept under investigation (e.g. how do we define food security?), in determining sub-groups, or dimensions (e.g. determinants, outcome, and stability), and finally in identifying the indicators or variables that allow to measure all sub-components (e.g. determinants is measured by indicators of food availability, physical access, and so on).
The second step, “Selecting variables”, consists in selecting the variables that will produce the composite indicator. Rely on variables of good quality is a major issue for constructing composite indexes. Ideally, variables should be SMART, that is specific, measurable, accessible, relevant, and timeliness.
The data selection process is somehow subjective: it usually involves a set of heterogeneous indicators, from quantitative (hard) data, to qualitative (soft) data collected from surveys or policy reviews, or to proxies to convey into the index more information on the phenomenon when specific variables are unavailable.
The third step (Filling the gaps) consists in filling tha gaps in the dataset. The vast majority of dataset are incomplete. When data are missing, it is important to establish if the lack of data is random or systematic: missing data at random depend on the variable itself or on other variables of the dataset (in other terms if that are randomly missing, this is likely to be due to the secific variable it has been adopted); systematic missing data are indeed due to the lack of information on the phenomenn under consideration. Unfortunately, despite the relevance of this distiction there are still no approaches to infer on the nature of the missing data: analystis should therefore adopt the most appropriare techniqes to deal with missing data somehow disregarding the nature of the missing.
Common approaches to impute missing data consist in deleting records that contain missing data, in imputing missing data by mean of ad hoc statistics (e.g. mean, median, regression imputation, etc.) or algorithms (e.g. Markov Chain, Monte Carlo algorithm, etc.). None of the approaches is exempt by drawbacks, therefore it is wise to carefully document the selected imputation procedures.
The fourth step is dedicated to “Homogenizing the information”. Due to the heterogeneity of measurements units, the indicators in a data set need to be normalized prior to any data aggregation. The analysts may rely on a large set of normalization methods: the choice should be based on the data properties and the objectives of the index it has to be constructed (Freudenberg, 2003; Jacobs et al., 2004).
Normalization methods include, among others, ranking, standardization, min-max, distance to a reference observation, score function, balance of opinions. All in all, normalization methods allow to compare indicators bringing different measurement units on a similar same dimension. Different methods imply different pros and cons. For instance, ranking method is extremely simple, robust to outliers and allow comparison among observations: a big disadvantage is that the method will eliminate information on levels. Balance of opinions is a different way to go: the metod is complex and useful in that missing primary data are imputed through the opinion of experts. As it is easy to imagine, the method is quite costly and of very difficult replication over time and space.
The next step, “Weighting and aggregating”, is dedicated to the normalization of the information. The set of selected variables, whose data have been normalized and filled to reduce lack of information, constitute the ingredients of the composite indicator. The final step will be the synthesis of the overall information into few indexes or a unique indicator. In particular, variables have to be properly aggregated and weighted.
As for previous step, a number of weighting techniques exists, none of which is exempt by a discretionary choice (Saaty, 2001). Statistical methods such as unobserved components models, or participatory methods, such as budget allocation, analytic hierarchy processes, and conjoint analysis are available alternatives. The theoretical framework underlying the composite indicator should mentor the selection of the technique. For instance, equal weighting implies that indicators (or dimensions) have similar importance, whereas principal components analysis or factor analysis rely on data variability and variables correlation: both methods allow to synthesize data variability through a reduced number of variables. Needless to say, if variables are not correlated (or low correlated) these methods cannot be applied.
transfers the relative importance of single indicators to the composite index. In other terms, it is a conservative measure. On the contrary, geometric aggregations allows to take into account non compensability between indicators or dimensions.
The last step, “Validating the composite indicator”, is aimed to ensuring the external validity of the composite indicator. The described process of constructing a composite indicator, required several judgment calls, in particular those involved in steps 2 - 4, that conflict with the goal of producing a scientific, objective, incontestable indicator of the complex phenomenon. The composite indicator, and the other results (e.g. rankings) should be validated through robustness checks and sensitivity analyses. The most common procedures are uncertainty analysis, focusing on how uncertainty in the input factors propagates through the structure of the composite indicator and affects the composite indicator values, and sensitivity analysis aiming at evaluate the contribution of the individual source of uncertainty to the output variance. Finally, the composite index should be compared to other proposed composite indicators.
DISCUSSION
Ensuring food security is “the challenge of feeding 9 billion people” (Godfray et al., 2010), the first Millennium Development Goal, and one of the most debated topic in Academia and International Organizations. Despite impressive achievements at the global level, with 700 million fewer people living in extreme poverty conditions in 2010 than in 1990, the United Nations estimates that 1.2 billion people are still living in extreme poverty. It is also true that governments are making every effort to eradicate hunger, poverty, and undernourishment, and policy interventions shooting for these targets are under the spotlight. On their side, the International Organizations, such as FAO or WB, reward governments successfully progressing in fighting food insecurity, and provide guidelines to policymakers. Thus, while Chile, China and Morocco have won recognition from FAO, on June the 16th 2014,for their outstanding progresses to reach
elevate food security standards, scholars are animatedly debating on how to measure (and improve) food security status.
The most widely adopted definition of food security is ‘a situation that exists when all people, at all time, have physical, social and economic access to sufficient, safe and nutritious food that meets their dietary needs and food preferences for an active and healthy life’ (FAO, 2013 ).
However, how the definition can be translated into an actual measure of the level of food security is still debated. It has to be recognized that the existing indicators are not equivalent, indeed they convey different information on food security (Barrett, 2010). Further complexity arises when indicators are complex. Data quality, double counting, data aggregation are just few of the issues that researches need to deal with when computing food security composite indexes. For instance, while existing indicators such as the Global Food Security Index, the Global Hunger Index, and the Poverty and Hunger Index, are already in use, there is no consensus on which methdology should be adopted to build food security composite indicators.
Based on the procedure described in previous sections, I present how to compute a composite indicator for food security: the variables used in the present analysis have been collected on FAOSTAT website.
The dataset FAO - FOOD SECURITY INDICATORS (released on October 9, 2012 and revised on March 15, 2013) is constructed by following the recommendation of experts gathered in the Committee on World Food Security (CFS) Round Table on hunger measurement, hosted at FAO headquarters in September 2011. In particular, I use all indicators provided by the FAO that have sufficient coverage to enable comparisons over time and space (Cafiero, 2013), and suggested as indicators of food security. The FAO has been recently expanded to introduce several new indicators to fill lack of information. I aim at introducing this new information to build a new index for food security.
undernourishment; Share of food expenditure of the poor; Depth of the food deficit; Prevalence of food inadequacy), and Utilization (Percentage of children under 5 years of age who are stunted; Percentage of children under 5 years of age affected by wasting; Percentage of children under 5 years of age who are underweight; Percent of adults who are underweight). The third group, “Vulnerability/stability” includes “Domestic food price level index volatility”, “Per Capita food production variability”, “Per Capita food supply variability”, “Political stability and absence of violence/terrorism”, “Value of food imports over total merchandise exports”, “Percent of arable land equipped for irrigation”, “Cereal import dependency ratio”. The composite indicator reflects the above described theoretical framework.
A variety of indicators for food security have been proposed. However, it is still unclear if “these different constructs equally represent the different domains of food security” (Jones et al., 2013). Moreover, I believe any of such indicators are sufficient to measure and monitor the state of food security, in that “monitoring of food security should be [further] complemented by anthropometric measurements” (Pinstrup-Andersen, 2009).
I have identified four crucial “choice nodes” (Table 1): data filling, data transformation, weighting, and aggregation. The data filling (or data imputation) is the imputation is the process of replacing missing data with substituted values. The data transformation consists in the rescaling of data to a unique scale. The weighting and aggregation procedure are steps that allows to move from multiple indicators to a unique indicator (aggregation) attributing different relevance (weighting) to the single indicators.
In particular, I test for two methods to deal with missing data (multiple imputation and simple imputation), two methods to normalize data (by mean of z-score and by mean of the normalization adopted by intelligence unit to compute the Global Food Security Index 2013i, namely the Min-Max method), four approaches to weight sub-indexes (Equal weighting, empirical rank correlation, inverse correlation, and correlation by a shrinkage estimation), and three alternatives to aggregate information (linear aggregation, simple geometric aggregation, and CES aggregationii).
The variety of alternatives analyzed and compared provides, to the best of my knowledge, the first systematic attempt to assess (quantitatively) results from different indexes.
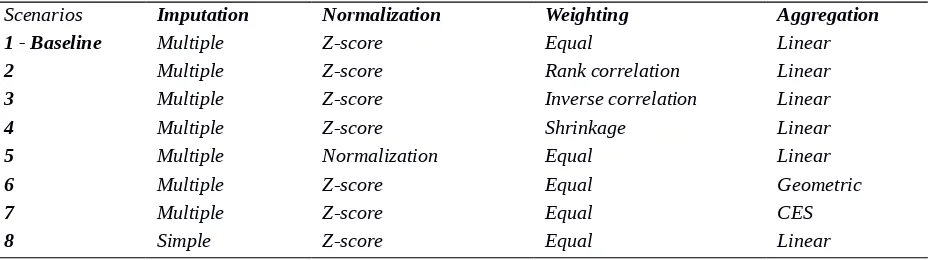
[image:6.595.54.519.525.655.2]I compare eight different composite indicators, the baseline composite indicator and seven other composite indicators that differ from the baseline only for one method in one of the four “choice nodes”. Although the set of potential alternatives is very large, I have focused on the alternatives proposed in other studies (cfr. Nardo et al., 2005a, 2005b). The baseline scenario has been obtained by adopting metods that are commonly adopted for composite indicators (Nardo et al., 2005a): multiple Imputation, normalization through z-score, equal weighting and linear aggregation. It is worth note that most of the proposed indexes suche as the Global Food Security Index and the Global Hunger Index are a slight variant of the baseline scenario. Each indicators have been normalized to a 0-100 score to make them directly comparable with other indicators.
Table 1. Different approaches for food security composite indicator
Scenarios Imputation Normalization Weighting Aggregation
1 - Baseline Multiple Z-score Equal Linear
2 Multiple Z-score Rank correlation Linear
3 Multiple Z-score Inverse correlation Linear
4 Multiple Z-score Shrinkage Linear
5 Multiple Normalization Equal Linear
6 Multiple Z-score Equal Geometric
7 Multiple Z-score Equal CES
8 Simple Z-score Equal Linear
Supposing a two variables (x1 and x2) composite indicator, a linear aggregation would be x1 + x2, a geometric aggregation would
be (x1*x2)(1/2) and a CES aggregation would be (x1y * x2y)(1/y).
SOLUTIONS AND RECOMMENDATIONS
I adopted different methodologies at four “choice nodes”: filling missing data, homogenizing the information, weighting information and aggregating information. I compared changes in rankings obtained by eight different composite indexes. The larger the differences in rankings induced by selecting alternative methods, the larger the importance of the choice, the wiser the decision-making process should be.
Choice of the methods to compute composite indexes have different relevance: decisions on normalization and weighting methods are not very relevant; conversely, different techniques for data imputation seem to convey very heterogeneous outcomes. Lastly, the aggregation formula that is adopted is able to influence the entire composite indicator: different formulas provide very different composite indexes. What this really imply for practitioners and policymakers?
Let me clarify with an emblematic examples may help the reader flavoring the relevance of choices. According to the baseline Index, Congo and Tanzania rank, respectively, 214 and 196 out of 228: their population (respectively 4 and 45 millions) are food insecure. However, if a different choice on the aggregation procedure would have been made, for instance if a geometric aggregation would have been adopted, these Countries would have been ranked 88th and 166th. Not only their overall rank would have been
improved, but they would have also been reversed, implying that Tanzania would have been considered more food insecure than Congo!
The practical and policy implications are very important: the construction of composite indicators may substantially alter the rankings for food security. Is this opening the path of stategic behavior? Would different goverments prefer different indicators? Let me reply withan emblematic examples. Let 's consider Chile, China and Morocco. According to my results, each of these Country would prefer a different way to climb the ranking: Chile would be better off in the ranking if simple imputation, or inverse correlation would have been adopted; China would gain 7 positions in the world rank if I would have simply used a different normalization techniques; Morocco may have been better off if a different aggregation method would have been chosen. This poses the basis for a strategic behavior: governments are likely to target to be highly ranked depending on the specific composite indicator adopted by the International Organization. This is very far from the motivating aim for constructing a composite indicator. We may have left in the scientists and analysts’ hands too flexible tools (and too many degrees of freedom): the current situation call for future research on how to build composite indicators for food security.
SUGGESTIONS FOR FUTURE RESEARCH AND CONCLUSION
Composite indicators have started to be applied in several contexts as holistic tool to measure complex phenomenon. While increasing in number and prominence, they still lack of solid theoretical and methodological foundations. Nardo (2005) provides an excellent review of the methods embedded in the construction of composite indexes, and pinpoints strengths and weaknesses of different techniques. Moving from the theory to the practice is a big jump, therefore analysts and final users, need to be aware of the practical implications that different choices may imply. In order to explore the methodological challenge to build composite indicators, with a fresher perspective, I have analyzed a practical example: the construction of a food security composite indicator.
The debate on food security is rapidly growing (Ouertani, 2016; Santeramo, 2015, 2016), and it concerns a wide range of disciplines. A large set of indicators have been proposed. However, measuring the phenomenon as a whole is per se important and therefore how different single indicators should be aggregated is very important. I emphasize how relevant may be the analyst’s choice of algorithms to compute composite indicators by comparing different techniques to build composite indexes of food security. Different methods have different impacts on rankings: normalization and weighting are (relatively) less crucial decisions, whereas special attention has to be paid in choosing the data imputation and aggregation methods.
research is to highlight the importance of testing the robustness of the ranking obtained through composite indicators. A second limitation consists in the reduced number of alternatives (for each step in the construction of the composite indicator) I have analyzed. Indeed this represents a suggestion for future research.
Despite the limitations stated, the implications of the present study are very relevant as I showed that simply modifying the adopted data imputation technique or the aggregation method alter the rankings, and thus suggest to the governments of the therefore named “food insecure” Countries to take measures. The provocative question I raise is: to what extent analysts are able to synthesize a complex phenomenon such food security by mean of a single composite indicator? And how governments should interpret the message that existing food security indicators convey?
I suggest that, when proposing new composite indexes, the United Nations, the international agencies, academics and researchers, should pay careful attention to emphasizing how they jumped from raw data into a single index. Without a clear and transparent procedure, no judgment or comparison with existing indicators can be made. As my simplified example shows, the political and practical implications of each choice are very relevant.
REFERENCES
Alam, M., Dupras, J., & Messier, C. (2016). A framework towards a composite indicator for urban ecosystem services. Ecological Indicators, 60, 38-44.
Ames, A., Ames, A., Houston, J., & Angioloni, S. (2016). Does Financial Literacy Contribute to Food Security?. International Journal of Food and Agriculture Economics. 4, 21-34.
Aurino, E. (2014). Selecting a Core Set of indicators for Monitoring Global Food Security. A Methodological Proposal. FAO Statistics Division Working Papers 14-06, April.
Booysen, F. (2002). An overview and evaluation of composite indices of development. Social indicators research, 59(2), 115-151.
Carletto, C., Zezza, A., & Banerjee, R. (2013). Towards better measurement of household food security: Harmonizing indicators and the role of household surveys. Global Food Security, 2(1), 30-40.
Cafiero, C., H. R. Melgar‐Quiñonez, T. J. Ballard & A.W. Kepple. (2014). Validity and reliability of food security measures. Annals of the New York Academy of Sciences, 1331 (1), 230-248
Cafiero, C. (2013). What do we really know about food security? (No. w18861). National Bureau of Economic Research.
Caracciolo, F., & Santeramo, F. G. (2013). Price Trends and Income Inequalities: Will Sub‐Saharan Africa Reduce the Gap?. African Development Review, 25(1), 42-54.
Carman, K. G., & Zamarro, G. (2016). Does Financial Literacy Contribute to Food Security?. International Journal of Food and Agriculture Economics, 4, 1-19
Dobrota, M., Martic, M., Bulajic, M., & Jeremic, V. (2015). Two-phased composite I-distance indicator approach for evaluation of countries’ information development. Telecommunications Policy, 39(5), 406-420.
Economist Intelligence Unit (2013). The Global Food Security Index 2013: An annual measure of the state of global food security.
Food and Agricultural Organization (2013). New metrics to measure and monitor performance in agriculture and food security, held on 5 December 2012 in Rome.
Freudenberg, M. (2003). Composite indicators of country performance: a critical assessment", OECD, Paris. Gabbert, S., & Weikard, H. (2001). How widespread is undernourishment? A critique of measurement methods and new empirical results. Food Policy, 26, 209-228.
Godfray, H. C. J., Beddington, J. R., Crute, I. R., Haddad, L., Lawrence, D., Muir, J. F., Jules Pretty, Sherman Robinson, Sandy M. Thomas, & Toulmin, C. (2010). Food security: the challenge of feeding 9 billion people. Science, 327(5967), 812-818.
Jacobs, R. P. Smith, & M. Goddard (2004). Measuring performance: an examination of composite performance indicators. Centre for Health Economics, Technical Paper Series 29.
Hertel, T. W. (2016). Food security under climate change. Nature Climate Change, 6(1), 10-13.
IFPRI (2011). Global hunger index – the challenge of hunger: price spikes and excessive food price volatility. Bonn, Washington, DC, Dublin
Mahadevan, R., & Hoang, V. (2015). Is There a Link Between Poverty and Food Security?. Social Indicators Research, 1-21.
Malinowski, E. R. (2009). Determination of rank by median absolute deviation (DRMAD): a simple method for determining the number of principal factors responsible for a data matrix. Journal of Chemometrics, 23(1), 1-6.
Maricic, M., Bulajic, M., Dobrota, M., & Jeremic, V. (2016) Redesigning the Global Food Security Index: A Multivariate Composite I-Distance Indicator Approach. International journal of food and agricultural economics, 4(1), 69-86.
Munda G., 2012. Choosing aggregation rules for composite indicators. Social Indicator Research, 109(3), 337-354.
Munda, G., & Nardo, M. (2003). On the methodological foundations of composite indicators used for ranking countries. Ispra, Italy: Joint Research Centre of the European Communities
Munda, G., & Saisana, M. (2011). Methodological considerations on regional sustainability assessment based on multicriteria and sensitivity analysis. Regional Studies, 45(2), 261-276.
Nardo, M., Saisana, M., Saltelli, A., Tarantola, S., Hoffman, A., & Giovannini, E. (2005a). Handbook on constructing composite indicators: methodology and user guide (No. 2005/3). OECD publishing.
Nardo, M., Saisana, M., Saltelli, A., & Tarantola, S. (2005b). Tools for composite indicators building. European Comission, Ispra.
Ouertani, E. (2016). Food Security in Tunisia Within Water Scarcity the Relative Importance of The Meat Sector. International journal of food and agricultural economics, 4(1), 35-54.
Paruolo, P., Saisana, M., & Saltelli, A. (2013). Ratings and rankings: voodoo or science?. Journal of the Royal Statistical Society: Series A, 176(3), 609-634.
Pemberton, C., Patterson-Andrews, H., & De Sormeaux (2016) Relative Vulnerability of Selected Caribbean States to Changes in Food Security Due To Tropical Storms and Hurricanes. International journal of food and agricultural economics, 4(1), 125-136
Pinstrup-Andersen P. (2009) Food security: definition and measurement. Food Security, 1, 5–7
Saaty, T. L. (2001). Decision Making for Leaders: The Analytic Hierarchy Process for Decisions in a Complex World. 1999/2000 Edition (Vol. 2). RWS publications.
Saisana, M., & Saltelli, A. (2013). Joint Research Centre Statistical Audit of the 2014 Global Innovation Index. The Global Innovation Index 2014, 55.
Santeramo, F. G., Di Pasquale, J., Contò, F., Tudisca, S., & Sgroi, F. (2012). Analyzing risk management in Mediterranean Countries: the Syrian perspective. New Medit, 11(3), 35-40.
Santeramo, F. G. (2014). On the composite indicators for food security: Decisions matter!. MPRA Paper. Santeramo, F.G. (2015). Indicatori compositi di Food Security: quali implicazioni per i policymaker?
AgriregioniEuropa, 41, 102-104.
Santeramo F.G. (2015) On the composite indicators for food security: decision matter! Food Reviews International. 1, 63-73
Santeramo, F. G. (2015). Food security composite indices: implications for policy and practice.Development in Practice,25(4), 594-600.
Santeramo, F. G., & Shabnam, N. (2015). The income-elasticity of calories, macro-and micro-nutrients: What is the literature telling us?. Food Research International, 76, 932-937.
Santeramo, F.G. (2016). Il consumo di calorie, micro e macro nutrienti: cosa insegnano le elasticità al reddito? AgriregioniEuropa, 44.
Svedberg, P., 2011. How Many People are Malnourished? Annual Review of Nutrition, 31, 263-283.
Tate, E. (2012). Social vulnerability indices: a comparative assessment using uncertainty and sensitivity analysis. Natural Hazards, 63(2), 325-347.
Wheeler, T., & von Braun, J. (2013). Climate change impacts on global food security. Science, 341(6145), 508-513.
KEY TERMS AND DEFINITIONS
Aggregation:
Process of synthesizing single variables and indexes into a multidimensional indexes.
Composite index
: A combination of simple variables or indexes to measure a complex
phenomenon.
FAO
: The Food and Agriculture Organization of the United Nations is an agency leading
international efforts to eradicate hunger and ensure food security.
Food Security:
The condition existing of having access to adequate and safe food.
Imputation:
Process of replacing missing data through different techniques.
Millennium Goals:
World targets to reduce global poverty by the first two decades of 2000s
Validation:
Process of demonstrating that the model is a reasonable representation of the
i
The report is available at: http://foodsecurityindex.eiu.com/ii Geometric aggregation is intended to capture the hierarchical structure of the phenomenon. As Barrett (2010) pointed out, “availability, access, and utilization […] are inherently hierarchical, with availability necessary but not sufficient to ensure access, which is, in turn, necessary but not sufficient for effective utilization”. The structure calls for further research on how to aggregate sub-index. An alternative, yet not empirically investigated, is to use a quasi-linear aggregation method, or to use a