Infra-red thermal mapping, analysis and interpretation in
biomedicine
SELVAN, Arul <http://orcid.org/0000-0001-9222-5538> and CHILDS, Charmaine <http://orcid.org/0000-0002-1558-5633>
Available from Sheffield Hallam University Research Archive (SHURA) at: http://shura.shu.ac.uk/13312/
This document is the author deposited version. You are advised to consult the publisher's version if you wish to cite from it.
Published version
SELVAN, Arul and CHILDS, Charmaine (2017). Infra-red thermal mapping, analysis and interpretation in biomedicine. In: NG, Eddie Y K and ETEHAD TAVAKOL, Mahnaz, (eds.) Application of Infrared to Biomedical Sciences. Series in Bioengineering . Springer, 377-394. (In Press)
Copyright and re-use policy
See http://shura.shu.ac.uk/information.html
Infra-red thermal mapping, analysis and interpretation in
biomedicine
Arul N Selvan and Charmaine Childs*,
* Corresponding Author
Professor of Clinical Science
Centre for Health and Social Care Research Sheffield Hallam University
Montgomery House 32 Collegiate Crescent Sheffield
United Kingdom
Abstract
Measurement of body temperature is one of the cornerstones of clinical assessment in medicine. Skin, the largest organ of the human body, is essentially a temperature
mosaic determined by the rate of blood flow through arterioles and capillaries adjacent to the skin. This makes the conventional methods of ‘spot’ measurement
rather limited in providing detailed information of regional skin temperature. Infrared thermal imaging however has the potential to provide a robust method of surface temperature mapping in disease states where pathology disturbs the ‘normal’
distribution of blood flow to skin.
XX.1 Human Temperature Measurement
Measurement of the temperature of the tissues of the human body is probably one of
the most well recognised clinical activities in modern medicine. A change in body
temperature, notably fever, has long been regarded as a classical sign of
inflammation and infection in man which for centuries was measured with a variety of
instruments. In recent years, clinical thermometry has undergone an evolution with a
variety of “liquid in glass, liquid crystal and electronic” 'thermometers' in everyday
use. The sites for measurement are limited and, by convention, confined to body
cavities (mouth, oesophagus, rectum) skin folds and crevices of the groin and axilla
(armpit) (Lefrant et al. 2003).
However, over the last few decades, advances in thermometry and accompanying
technology has evolved such that we are now able to implant temperature sensors
deep inside the human body, previously possible only in the experimental laboratory.
In the brain for example, being able to implant sensors in to injured white matter
and/or cerebral ventricles (Childs et al. 2014) has shown variations in organ
temperature from deep to superficial structures (Fountas et al. 2004) and across the
brain (Childs and Shen 2015) and has revolutionised our understanding of the
pathophysiology of brain damage (Soukup et al. 2007; Sacho and Childs 2008).
Similar variations in regional tissue temperature have also been reported , with
non-invasive imaging of healthy brain using 1H magnetic resonance spectroscopy
(1HMRS) and imaging (1H MRSI) (Childs et al. 2006). That said, we have to
recognise the limitations of in situ sensor technology for whole organ temperature
measurement. Since the insertion of multiple probes and sensors are not feasible in
The same is true for skin temperature measurement. When it comes to surface
temperature, the skin has long been regarded as a thermal 'mosaic' (Henane et al.
1981). With the knowledge that skin temperature can vary widely across the body,
what value might there be in a single skin measurement? More useful would be skin
temperature ‘’mapping’’ in body regions where disease is manifest upon the skin.
Infra-red (IR) thermometry provides a solution to both temperature measurement and
regional temperature mapping and can be undertaken rapidly and relatively simply.
Non-ionising infra-red thermal imaging has many advantages. Although not used
routinely as a diagnostic clinical tool, it does have potential as a future imaging
modality provided that image analysis can be developed to provide reliable routes to
interpretation, assessment and diagnosis in medicine. In this chapter, methods for
the interpretation of digital thermal imaging in biomedical applications are presented.
XX.2
Infrared Thermal Imaging in Medicine
The use of infrared (IR) thermal imaging in healthcare is not a recent phenomenon.
Thermography in breast cancer screening began in 1956 when Lawson (1956)
observed that skin temperature overlying a breast tumour was higher than that of
'normal' skin. However, using thermography without a standardised protocol for
imaging, patient preparation, control of ambient temperature or physician training led
to scepticism; the technique not being perceived well for ''diagnostic/screening"
accuracy. It subsequently suffered a demise (Wiecek et al. 2016). Alternative imaging
modalities at this time; X-ray, proton magnetic resonance imaging (1HMRI) computed
tomography (CT) whilst costly had a superior reputation for reliability and clinical
utility. However, it is now recognised that when used repeatedly in diagnostics, all
neonates and young children (Pearce et al. 2012; Mathews et al. 2013). By contrast,
IR thermography does not penetrate structures below the skin and is non-ionising.
The utility of IR thermal imaging is underpinned by its penetration depth. IR radiation
is not emitted by skin at depths greater than 5.0mm (Leando 2003) thus it is unable
to ‘’ímage’’ deep tissue and organs. That said, many physiological and
pathophysiological changes ‘’trigger’’ alterations in skin dermis via capillary networks,
particularly in acral regions (toe, finger, ear, tip of nose). Such changes occur either
intrinsically through local biochemical stimuli, and/or by external factors (heat/cold for
example) via vascular, neurological and/or neurovascular pathways (Leando 2003).
This makes IR imaging at the surface of real value for a number of prognostic and
diagnostic capabilities where changes in skin blood flow, and thus skin temperature,
provide clinically relevant information. The significant advances in IR detectors and
technology, along with improvements in the development of image processing
techniques have, over the last five years, seen a re-emergence of interest in IR
imaging with a successful reported use in oncology, pain management, vascular
disorders, arthritis/rheumatism, neurology, sports and rehabilitation medicine
(Diakides and Bronzino 2008).
XX.3 Digital Medical Thermal Imaging Interpretation
Typically, thermal images are inspected and interpreted using the following methods
1. Qualitative or a narrative report determined by visually inspecting the image to
identify differences in the colour map corresponding to temperature (oC/oF)
2. Quantitative analysis of a region of interest (ROI) or “spot” (pixel) measures
(Fig. XX.1b) with options for including average, maximum and minimum
values within a region of interest.
3. Image analysis, in its most simple form, which relies solely on the variation in
colour of the thermogram which corresponds to a temperature range
(Vardasca and Bajawa 2008).
XX.3.1 Issues Associated with Visual Inspection of Thermal Images
Until recently, IR thermal cameras were constructed with sensors having low
resolution only (e.g. 160 x 120 pixels) but, with advances in detector technology,
improved thermal sensitivity with possible pixel resolution of (640 x 480 to 1024 x
768) are available as affordable thermal imaging systems. The problem is that
human visual processing is not capable of perceiving all of the subtle information
present in such high resolution images. Thermal pattern-recognition computer
software systems are therefore required to ‘’extract’’ information of thermal values
''hidden '' within the data provided by the thermal camera manufacturers’ dedicated
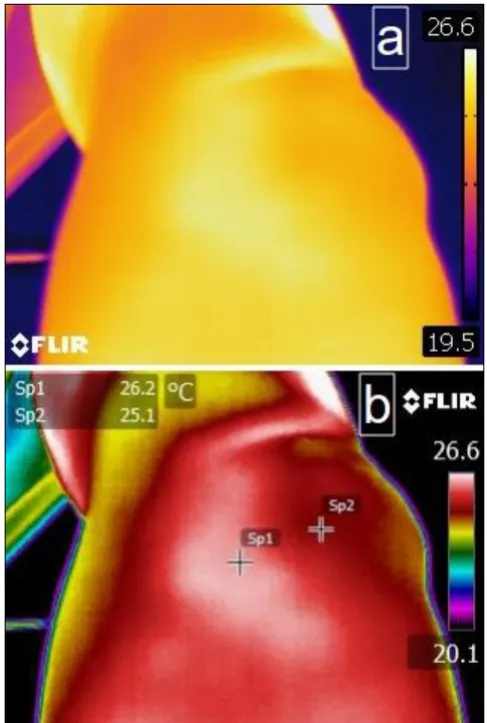
software. For example in Fig. XX.1a the skin surface temperature over this
anatomical region appears relatively homogeneous in colour. However,
post-processing with camera software identifies two distinct regions which differ by
approximately 1oC when using measurements spots to provide temperature values
at each selected pixel location (SP1 and SP2) and referenced with the temperature
key (Fig. XX.1b). This simple image analysis can be advanced further but requires
far greater systems complexity to identify temperature variations over very small
areas; for example between group of pixels and a system for defining (pixel) areas of
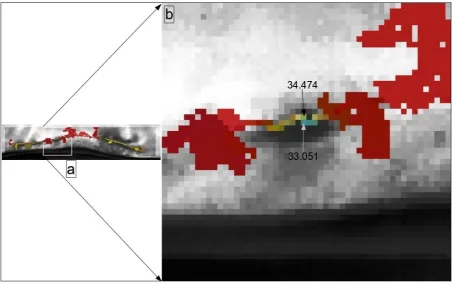
variation of approximately 1.5 0C occurs across single pixel locations. This
temperature variation could be lost or overlooked on visual inspection but may be
identified easily with a computer-aided pixel highlighting process.
In medicine, clues to the identification of skin/body regions where disease or injury
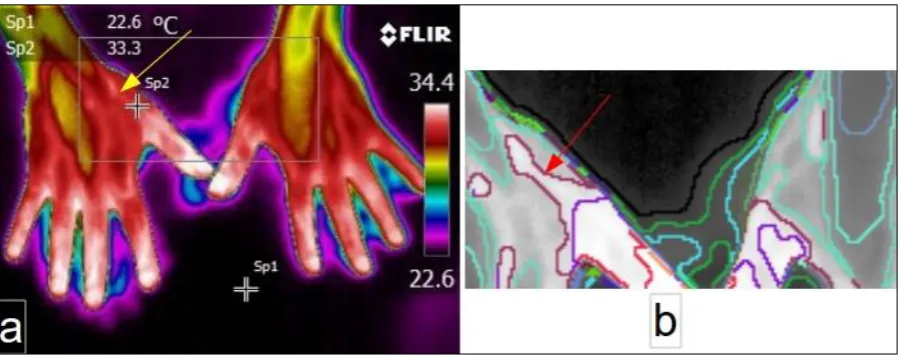
may exist can be provided by the patient him/herself. In Fig. XX.3a, the patient had
complained of pain at the muscles of the thenar eminence. In Fig. 3a, the painful
region is identified by an arrow and an adjacent spot measure (SP2) reveals the
temperature value; one of a number of regions in this thermogram close to the
maximum value in the field of view (maximum being 34.4oC). In Fig. XX.3b much
greater detail is provided by exploring pixel boundaries around the site (arrow). At
least three different colour coded regions can be identified within which the
temperature values are similar. By using computer-aided software it is possible to
distinguish each of these regions as a separate temperature ‘’boundary’’.
Furthermore the boundaries make the size and shape of each region, having similar
temperature values, become evident. In this way, these images have the potential to
map areas of skin temperature linked to the anatomical distribution of pain. This
method for outlining areas of similar temperature will aid the objective assessment of
the size and position of the area of interest because accuracy of diagnosis depends
on how well the segmentation of the region of interest (ROI) is performed in a
thermogram (Kapoor et al. 2012).
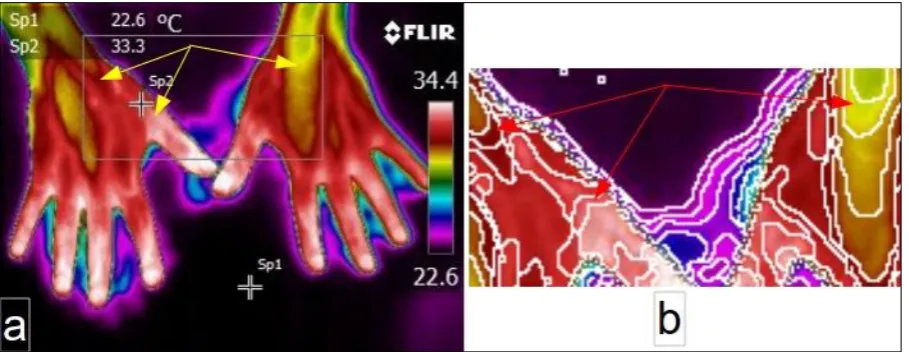
Comparing the ROI from images in Fig. XX.4a and Fig. XX.4b, it can be seen how
the loss of visual detail inherent in human visual perception can be overcome by
isotherms. In this context, isotherms are curves which enclose regions of similar
temperature patterns. The isothermal patterns of Fig XX.4b show greater detail than
information in Fig XX.4a and have been produced by a boundary outlining software
(Selvan 2011) to enhance image information and to reveal the size and shape of
regions with the same (and different) temperature characteristics. By using
isothermal patterns and boundary regions, fine resolution and greater information
from the same original image can be obtained. Thus, computer generated
boundaries aid the visualisation of fine gradations of temperature changes within an
area having a seemingly uniform temperature.
Given the potential for computer-aided image analysis to reveal details of the
user-drawn ROI (not possible on visual inspection using the software provided by
proprietary systems) there is an emerging interest in the development of 'smart'
image processing algorithms to enhance the interpretation and analysis of thermal
signatures.
We have previously reported the variation in temperature along two different surgical
wounds types; wounds produced after closure of enterostoma (Siah and Childs
2015) and after caesarean section (Childs et al. 2016) piloting the use of an image
processing algorithm; Hierarchical Clustering-based Segmentation (HCS) (Selvan
2011), in detecting anomalies in temperature along the scar.
XX.4 Computer Assisted Medical Thermal Image Interpretation
Anomaly detection in infrared images is a challenging task. Frize, et al. (2009) have
identified a number of factors which can confound the accuracy of the temperature
imaging surface factors (material, surface properties, orientation) all of which
produce IR images of low signal-to-noise ratio (Bal and Alam 2005) and this
introduces inaccuracy in obtaining the actual temperature values. This contributes to
measurement uncertainty.
The most important step in developing a computer-assisted anomaly detection
system and application for analysis of thermal images is to segment relevant thermal
information from thermal noise. Numerous algorithms are available in the literature
for detecting boundaries to segment regions of interest in visible and optical images.
However, because of the non-uniformity of IR images, revealed by varied pixel
values representing similar temperature across the image (Budzan and Wyzgolik
2015) boundary regions in thermal images are not defined clearly. Software
techniques used successfully in detecting boundaries in optical (visible) images have
the drawback of being unable to form continuous, distinct and meaningful boundaries
around an ROI in thermograms; they are therefore unreliable for segmenting IR
images (Zhou et al. 2014)
Designs for computer-assisted methods for the interpretation of thermal images are
available, for example to assist the user in objective identification of skin 'hot' spots
Snekhalatha et al. (2015) implemented an automated thermal image segmentation
of a hot spot region of the hand. Similarly because a regular ROI such as a
rectangle, square, circle and or elipse, poorly outlines certain anatomical regions
(Duarte et al. 2014), Vardasca et al. (2014) designed an automated ROI fitting
method to address the issues associated with obtaining a representative temperature
value from a user-drawn regular ROI from thermal images of limbs. These example
suggest that automation of thermal images are typically for ‘’bespoke’’ applications.
In this chapter we discuss the development of a generic thermal image segmentation
process to extract thermal features considered to be 'abnormal' and using a
Hierarchical Clustering-based Segmentation (HCS) design and process (Selvan
2011). HCS, segments an image as a set of regions with each region composed of
sub-regions and which are, themselves, composed of sub-regions, and so on (Griffin
et al. 1994). In this way, HCS is a dissimilarity highlighting process that yields a
hierarchy of segmentation results. It is well suited to address the issues associated
with the segmentation of noisy thermal image data.
In separating out regions of interest, thresholding is used. The separation is based
on the variation of pixel values between the regions’ pixels and the surrounding
pixels. For example in a grey scale image with pixel values ranging from zero to 255,
the variation of (difference in) pixel values between parts (regions) can be between
zero to 255. In the thresholding process, a part of the image is segmented as a
separate region if its pixel values vary from the surrounding pixel values by a
threshold value (T). For a low threshold value, pixels having even the smallest
difference from the surrounding pixel values will be segmented as a separate region.
Thus, a low threshold value will locate boundaries of regions having the most subtle
of differences. As these small pixel value differences may be because of the
non-uniformity of IR images, the detected boundaries will be spurious (Dougherty 2009).
By contrast,, higher threshold values will detect only the boundaries of regions where
there are major difference with the surroundings but by using a higher threshold, the
downside is that there are likely discontinuities in the detected boundaries
(Dougherty 2009).
Identifying boundaries where only a single threshold value is employed has two
threshold value will depend greatly on the application i.e. whether identification is
required for major boundaries or subtle boundaries only. Secondly, and importantly,
thresholding using a single threshold will result in loss of useful boundary
information, which might otherwise be found for different threshold values.
Unlike other segmentation processes which favour identification of the boundaries
between different regions by choosing a (single) threshold value, the HCS process is
based on a non-thresholded boundary identifying process. That is, no threshold
value is used. However, recognising that the process does, indeed, need some form
of ''thresholding'' approach to identify the boundaries of different regions in an image,
the HCS process rather than using a single threshold value, instead uses a
”hierarchical” level of thresholding to identify the boundaries between different
regions in the image.
XX.4.1 Design of Hierarchical Clustering-based Segmentation (HCS)
as an Aid to Interpret Medical Thermal Images
The human visual system processes images at varying resolutions; coarse to fine.
For example, given an anatomical image of the cross-section of a skull, at a coarse
level a radiologist can visualise the image as distinct regions belonging to soft
tissues or bone. At a fine level, different types of soft tissues are also identified. At a
still finer level and, given the appropriate imaging modality, the radiologist will be
able to distinguish “abnormal” regions (for example commensurate with ischaemia)
within the same tissue type. This example illustrates a ‘’resolution’’ hierarchy from
coarse (bone) fine (tissue) and still finer (blood within tissue) within an image. Since
motivated clustering techniques for image segmentation (Ohlander et al. 1978). So in
a computer model representation, the segmentation process is modelled as a
process of grouping visual information, where the details are grouped into objects,
and objects into classes of objects. Thus, starting from the composite segmentation,
the perceptual organization of the image can be represented by a tree of regions,
ordered by inclusion. The root of the tree is the entire scene, the leaves are the finest
details and each region represents an object at a certain scale of observation
(Arbelaez 2006).
Hierarchical Clustering-based Segmentation (HCS) (Selvan 2007; Selvan 2011;
Selvan 2012) implements the traditional agglomerative clustering (Nadler and Smith
1993) where the regions of an initial partition are iteratively merged and
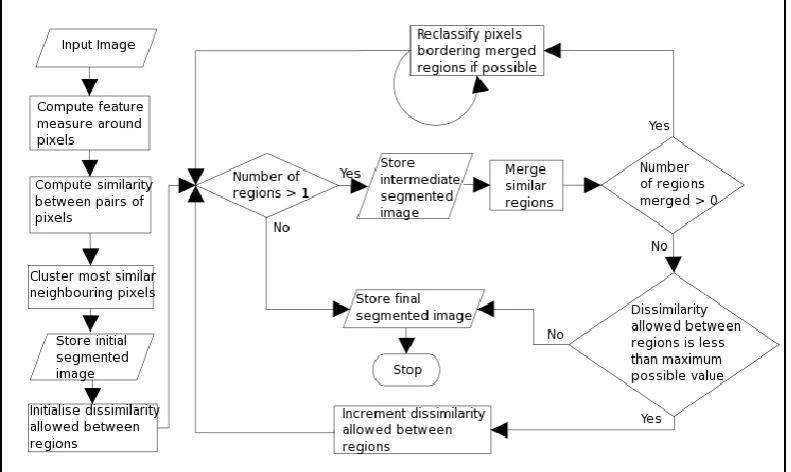
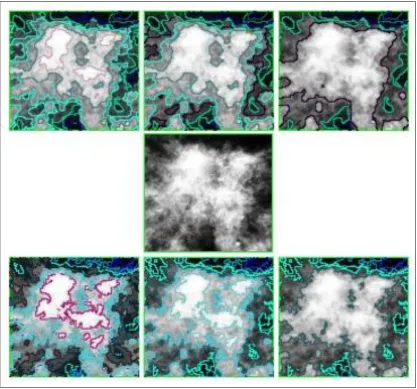
automatically generates a hierarchy of segmented images (Fig. XX.5); for example
Fig XX.6 (top row of images; left to right).
The hierarchy of segmented images is generated by partitioning an image into its
constituent regions at hierarchical levels of “allowable dissimilarity” (threshold value)
between its different regions. At any particular level in the hierarchy, the
segmentation process will cluster together all the pixels and/or regions which have
dissimilarity value among them; less than or equal to the dissimilarity allowed for that
level (Fig. XX.5)
A unique feature of the HCS process is the border pixel classification operation
(flow-chart Fig. XX.5). Border pixel reclassification is considered only for those pixels on
the boundary of the clusters which had been merged with other clusters. These
removed is considered as a region of its own and the similarity between the one pixel
region and the regions bordering it (which include the original cluster to which it
belonged) are found and the single pixel region merged with the most similar
bordering region. Border pixel reclassification aides in over-riding local
inhomogeneity while clustering similar pixels/regions.
An example of HCS border pixel re-classification in use can be demonstrated by the
visually smooth border delineation obtained in Fig. XX.6. The central image (middle
row) is the image of an abnormality having ill-defined boundaries presented in a
X-ray mammogram. It can be seen from the border outlined images that the HCS
process (with border pixel reclassification - top row) achieves far better results in
delineating the different regions within the abnormality when compared to the
segmentation without border-pixel-classification (bottom row). The border pixel
re-classification operation of the HCS process generates visually smooth boundaries
and also identifies more appropriate boundaries when compared to other similar
segmentation processes such as Tilton's (2003) Hierarchical Segmentation (HSEG)
(Tilton 2016). For further details with relevant example see Selvan (2011).
Since the HCS process is a generic segmentation process it is applicable and
equally successful at segmentation and outlining boundaries of regions of interest in
digital images from any source whether from X-ray or thermal image. This makes
HCS a versatile process which has been demonstrated successfully and without any
modifications (e.g. parameter tuning) to segment images of the natural environment
(birds, trees, cats, dogs) (Selvan 2011) and diagnostic images obtained using
different modalities; ultrasound images (Selvan 2007), computed tomography
imaging (Selvan et al. 2015) and digital medical thermal image (DMTI) (Childs et al.
2016).
XX.5 HCS Process in Thermal Image Analysis of Surgical Wounds
In clinical practice, the assessment of surgical wounds for surgical site infection is
largely undertaken using wound scoring tables and criteria (e.g. Wilson et al. 1986;
van Walraven and Musselman 2013). There are currently no independent
quantitative technologies for wound assessment. Typically however, descriptive
narratives are used to describe the state of a wound and to undertake wound healing
assessments (Nowakowski et al. 2015).
Here we describe a novel method to aid the user to:
visualise the thermal pattern to report information for a more robust
qualitative analysis
provide quantitative measures for wound analysis.
XX.5.1 HCS Process Aided Evaluation of the Temperature Variation
of the Surgical Wound
Previous studies report a relationship between temperature and skin viability during
inflammation and infection. For example, raised skin temperature is recognised as a
sign of inflammation (Bharara, 2010). By contrast a fall in skin temperature can occur
during vascular insufficiency, ischaemia and necrosis (Nowakowski et al. 2015). In
surgical wounds, we have recently observed 'cold spots' in the thermograms of
surgical wounds which subsequently were shown to be infected (Siah and Childs.
obtain quantitative measures to undertake an objective and independent assessment
of healthy and infected surgical wounds (Childs et al. 2016). For detailed information
of the technique see Childs et al. (2016) but a brief description is provided here
where the steps involved in the designed HCS process include:
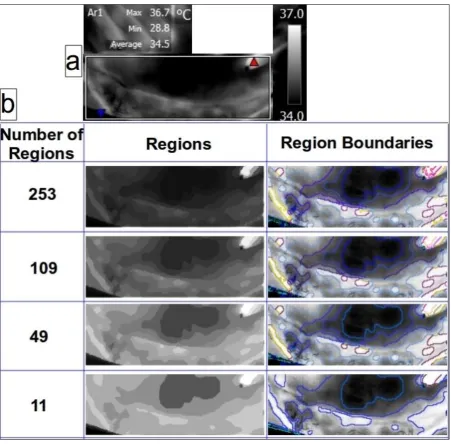
a) HCS processing of a region of interest (ROI) around the wound site. A box shaped
ROI around the wound site is chosen by the user (Fig. XX.7a)
b) comparison of the wound site with a nearby healthy area.
a) HCS Processing of a ROI Around the Wound Site The main purpose of this
step is to highlight regions of different temperature values in an automated and
objective manner. The HCS process is applied within the user outlined ROI
(Fig.XX.7a) around the wound site.
The HCS process generates a hierarchy of segmentation output for different values
of allowable dissimilarity amongst the pixels collated to form regions of similar
temperature profiles. From the hundreds of segmentations, the user may make use
only of the relevant segmentations having useful segmentation outputs. Briefly, in
this example, the user has chosen four different segmentation outputs ranging from
the segmentation having 253 regions to the segmentation having 11 regions only
(Fig. XX.7b).
The segmentation having 253 regions will be produced when a low threshold of
dissimilarity is allowed between regions. Hence a lesser number of regions will be
merged. The segmentation with 11 regions will be produced when a higher value for
the dissimilarity threshold is allowed for merging. This facilitates a higher number of
regions to merge. In each of the cases (low or high threshold dissimilarity) the region
contained within a region to 256 grey scale levels. The boundary images were
produced by plotting the border of the different regions onto the 256 level
representation of the radiometric data (Fig. XX.7a).
From the different segmentation outputs generated, the user may choose
segmentation(s) of interest to generate quantitative measures for each of the
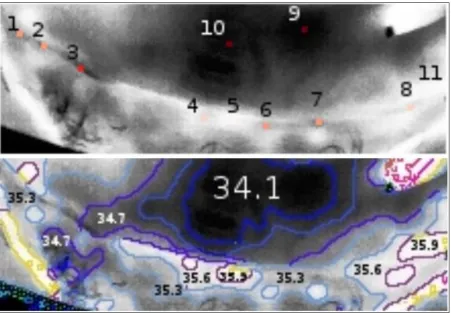
regions. On inspecting the different segmentations (Fig. XX.7b) the segmentation
with 253 regions was chosen for further analysis and to extract the quantitative
(temperature) measurements (Fig. XX.8). The upper panel shows the locations of
interest (locations 1 to 11) and the corresponding temperature boundary regions
(lower panel). In this way, the user can identify the variability in temperature regions
across the ROI. In summary, the usefulness of the HCS process in outlining regions
of similar temperature profile are as follows:
The highlighted (boundary outlined) areas will aid the user to visualise, in
detail, regions of interest including the shape and size of ''abnormal'' regions
and the variability in temperature within regions which ''at first sight'' appear
similar (Fig. XX.7).
The process will aid the user to automatically derive quantitative measures of
the highlighted (boundary outlined) areas in an objective manner (Fig. XX.8).
The process can also be used to automatically estimate the summary statistics of the
temperature difference between two ROIs; in this example, the regions of the wound
and of undamaged skin (Fig XX.9c). In this example marked differences in
temperature are evident across the wound and in excess of 1.5oC.
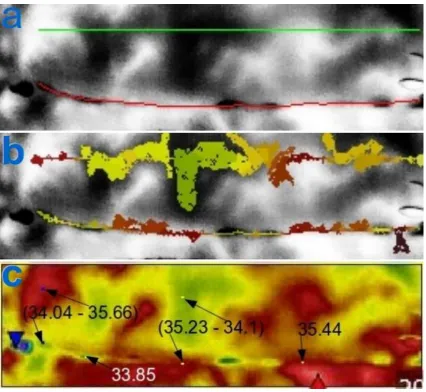
b) Comparison of the Wound Site with a Nearby Healthy Area Locations of
interest along the wound site are noted as are adjacent locations marking healthy
healthy skin and the regions over the surgical wound are selected/identified for a
user-chosen “low’’ dissimilarity level of 10% (i.e. each segmented region allows
inclusion of pixels which differ from each other by not more than 10%) (Fig.9b). The
process automatically estimates the summary statistics of the temperature difference
between the regions of the wound and the regions of the healthy area (Fig XX.9c). In
this example there are wide variations between wound and adjacent healthy skin.
For example, from the summary statistics generated from the HCS process for the
image shown in Fig 9, the wound site was maximally 1.6oC lower, and maximally
1.2oC higher, than healthy skin at loci shown (average differences being 0.53o and
0.45o respectively). In addition, the temperature values along the wound estimated
by the HCS process are: average (34oC) lowest (33.8oC) and highest (35.4oC) at loci
shown in the figure and reveal significant temperature gradients within the ROI of
the surgical wound.
XX.6 Summary
Although the temperature of mammalian internal organs are considered relatively
uniform (and constant), recent studies have shown that significant temperature
gradients do occur (Fountas et al. 2004; Childs et al. 2006; Childs et al. 2015) even
in a thermally ‘’shielded’’ organ; brain. Whilst temperature shielding, due primarily to
the effects of incoming arterial blood (Zhou et al. 2006) would be expected to obviate
large temperature gradients within internal structures, this is not the case for skin.
Since the seminal works of Aschoff and Wever (1968) variability of the body ‘’shell’’
with temperature in excess of 10oC are not unusual in healthy subjects. Furthermore,
a variable counter current heat exchange between arterial and venous blood in limbs
and digital extremities (hands, feet) enhances the temperature gradient of the
By undertaking a comprehensive assessment of healthy and injured skin by infrared
thermal mapping, combined with a computer-aided system to aid visual processing,
we have exploited a variety of well-established image analysis techniques (e.g.
hierarchical clustering, isotherm patterning) to produce an objective, robust method
to obtain a hierarchy of thermal segments and boundaries to improve upon ‘’what we
see’’. Our work has allowed us to ‘’see more’’ of the surgical wound and to
set-in-train a quantitative, independent HCS technique of wound imaging systems to
explore further the temperature mosaic which exists along the surgical wound for its
References
Arbelaez P (2006) Boundary extraction in natural images using ultrametric contour maps. In: Proceedings 5th IEEE Workshop on Perceptual Organization in Computer Vision (POCV'06), New York, USA, June 2006.
Arbelaez P, Fowlkes C, Martin D. (2007) The Berkeley segmentation dataset and benchmark June, 2007
http://www.eecs.berkeley.edu/Research/Projects/CS/vision/bsds/ Accessed 24 June
2016.
Aschoff J and Wever R (1958) cited in Stainer MW, Mount LE, Blight J. Energy balance and temperature regulation. Cambridge University Press 1984
Bal A and Alam AS, (2005) Automatic target tracking in FLIR image sequences using intensity variation function and template modelling. IEEE Trans. Instrum. Meas. 54 (5) 846-852.
Bharara M, Schoess J, Nouvong A, Armstong DG (2010) Wound inflammatory index: a "proof of concept" study to assess wound healing trajectory. Journal of Diabetes Science and Technology Volume 4, Issue 4, 773-779
Budzan S and Wyzgolik R (2015) Remarks on Noise Removal in Infrared Images. Measurement Automation Monitoring, vol. 61, no. 06
Childs C, Hiltunen Y, Vidyasagar R, Kauppinen RA (2006) Determination of Regional Brain Temperature Using Proton Magnetic Resonance Spectroscopy to Access Brain-Body Temperature Differences in Healthy Human Subjects. Magnetic Resonance in Medicine, 56:1-9.
Childs C, Liang S (2015) Regional Pressure and temperature variations accross the injured human brain:comparisons between intraparenchymal and ventricular
measurements. Critical Care, 19:267 doi:10.1186/s13054-015-0982-x.
Childs C, Wang L, Neoh BK, Goh HK, Zu MM, Aung PW, Yeo TT (2014) . Multi-parameter brain tissue microsensor and interface systems Calibration, reliability and user experiences of pressure and temperature sensors in the setting of
neurointensive care. J Med Eng Technol Early Online: 1–12. DOI: 10.3109/03091902.2014.937834
Childs C, Siraj MR, Fair FJ, Selvan AN, Soltani H, Wilmott J, Farrell T (2016) Thermal territories of the abdomen after caesarean section birth: infrared thermography and analysis approaches to surgical site assessment. Journal of Wound Care (in press).
Diakides NA, Bronzino JD (eds) (2008) Medical infrared imaging. CRC Press
Duarte A, Carrão L, Espanha M, Vianad T, Freitas D, Bártolod P, Fariaa P and Almeidaa HA (2014) Segmentation algorithms for thermal images. Procedia Technology 16 1560 - 1569
Fountas KN, Kapsalaki EZ, Felets CH, Smisson III HF, Johnston KW, Robinson JS: Intracranial temperature (2004) Is it different throughout the brain? Neurocritical Care
4(2):195-200.
Frize M, Karsh J, Herry C, Adéa C, Aleem I, Payeur P (2009) Preliminary results of severity of illness measures of rheumatoid arthritis using infrared imaging. MeMeA 2009 - International Workshop on Medical Measurements and Applications Cetraro, Italy May 29-30, 2009
Griffin LD, Colchester ACF, Roll SA and Studholme CS (1994) Hierarchical Segmentation Satisfying Constraints. British Machine Vision Conference UK 1994
Henane R, Bittel J, Bansillon V (1981) Partitional calorimetry measurements of energy exchange in severely burned patients. Burns, 7(3):180-189.
Kapoor P, Prasad SVAV and Patni S. (2012) Image Segmentation and Asymmetry Analysis of Breast Thermograms for Tumor Detection. International Journal of Computer Applications 50.
Lawson R (1956) Implications of surface temperatures in the diagnosis of breast cancer. Canadian Medical Association Journal vol. 75
Leando P (2003) Digital infrared thermal imaging (DITI) for referring health care practitioners Meditherm Inc 2003
Lefrant J-Y, Muller L, Emmanuel Coussaye J, Benbabaali M, Lebris C, Zeitoun N, Mari C, Saissi G, Ripart J, Eledjam J-J (2003) Temperature measurement in intensive care patients:comparison of urinary bladder, oesophageal, rectal, axillary, and
inguinal methods versus pulmonary artery core temperature. Intensive Care Medicine 29:414-418.
Matthews JD, Forsythe AV, Brady Z, Butler MW, Georgen SK, Byrnes GB, Giles GG, Wallace AB, Anderson PR, Guiver TA, McGale P, Cain TM, Dowty GJG, Bickerstaffe AC, Darby SC (2013) Cancer risk in 680,000 people exposed to computed tomography scans in childhood or adolescence: data linkage study of 11 million Australians. BMJ:346:f2360
Nadler M, Smith EP (1993) Pattern recognition engineering. John Wiley and Sons inc.
Nowakowski A, Kaczmarek M, Moderhak M, Siondalski P (2015) Thermal imaging in wound healing diagnostics. Measurement Automation Monitoring, vol. 61, no. 06
Pearce MS, Salotti JA, Little MP, McHugh K, LeeC, Kim KP, deGonzalez AB (2012)
et al. Radiation exposure form CT scans in childhood and subsequent risk of
leukaemia and brain tumours: a retrospective cohort study. Lancet; 380: 499-505
Sacho RS, Childs C (2008) The significance of altered temperature after traumatic brain injury:an analysis of investigations in experimental and human studies: Part 2.
British Journal of Neurosurgery, 22(4):497-507.
Selvan AN (2007) Highlighting dissimilarity in medical images using hierarchical clustering-based segmentation (HCS). MPhil. Dissertation, Faculty of Arts Computing Engineering and Sciences, Sheffield Hallam University, Sheffield, UK.
Selvan AN (2011) Boundary extraction in images using hierarchical clustering-based segmentation (HCS). British Machine Vision Conference (Student workshop) Dundee, UK, Sept. 2011
Selvan AN (2012) Hierarchical clustering-based segmentation (HCS) aided diagnostic image interpretation and monitoring. Doctoral Dissertation, Faculty of Arts Computing Engineering and Sciences, Sheffield Hallam University, Sheffield, UK.
Selvan AN, Saatchi R and Ferris CM (2009) Improving Medical Image Perception by Hierarchical Clustering based Segmentation. In: 9th International Conference on Information Technology and Applications in Biomedicine, Larnaka, Cyprus, 4-7 November, 2009
Selvan AN, Saatchi R, Ferris CM (2011) Computer aided monitoring of breast abnormalities in X-ray mammograms. Medical Image Understanding and Analysis Conference, London, UK, 2011
Selvan AN, Pettitt S, Wright C (2015) Hierarchical clustering-based segmentation (HCS) aided interpretation of the DCE MR images of the prostate. Medical Image Understanding and Analysis Conference, Lincoln, UK, July 2015
Siah CJR, Childs C (2015) Thermographic mapping of the abdomen in healthy subjects and patients after enterostoma. Journal of Wound Care Vol 24, No 3.
Snekhalatha U, Anburajan M, Sowmiya V, Venkatraman B, Menaka M (2015) Automated hand thermal image segmentation and feature extraction in the evaluation of rheumatoid arthritis. Proceedings of the Institution of Mechanical Engineers, Part H: Journal of Engineering in Medicine vol. 229 no. 4 319-331
Soukup J, Rieger C, Holz C, Miko I, Nemeth N, Menzel M (2007) Temperature gradient between brain tissue and arterial bloof mirrors the flow-metabolism relationship in uninjured brain: an experimental study. Acta Anaesthesiol Scand
51:872-879.
Tilton JC (2003) Hierarchical Image Segmentation. On-line Journal of Space Communication Issue No. 3 Winter 2003 Research and Applications.
http://science.gsfc.nasa.gov/606.3/TILTON/hseg.html Accessed 11 August 2016
Vardasca R and Bajwa U (2008) Segmentation and Noise Removal on Thermographic Images of Hands. Thermology International, 18/3, p99-104.
Vardasca R, Gabriel J, Jones CD, Plassmann P, Ring EFJ (2014) A Template Based Method for Normalizing Thermal Images of the Human Body The 12th International Conference on Quantitative InfraRed Thermography, At Bordeaux, France, 2014
van Walraven C, Musselman R (2013) The Surgical Site Infection Risk Score (SSIRS): A Model to Predict the Risk of Surgical Site Infections. PLoS ONE 8(6): e67167. doi:10.1371/journal.pone.0067167 Editor: Emma S. McBryde, Royal Melbourne Hospital
Wiecek M, Strkowski R, Jakubowska T, Wicek B (2016) Software for classification of thermal imaging for medical applications.
https://www.researchgate.net/publication/237215535_Software_for_classification_of_ thermal_imaging_for_medical_applications Accessed 24 May 2016
Wilson, A.P., Treasure, T., Sturridge, M.F., Gruneberg, R.N. (1986) A scoring method (ASEPSIS) for postoperative wound infections for use in
clinical trials of antibiotic prophylaxis. Lancet. 1: 8476, 311–313.
Zhou Q, Li Z and Aggarwal JK (2004) Boundary Extraction in Thermal Images by Edge Map. ACM Symposium on Applied Computing
SAC'04, Nicosia, Cyprus March 14-17, 2004
Zhu M, Ackerman JJH, Sukstanskii AL and Yablonskiy DA. (2006). How the body controls brain temperature: the temperature shielding effect of cerebral blood flow. J Appl Physiol 101:1481-1488, 2006. First published Jul 13,
Figure Legends
Fig. XX.1 Temperature values in a thermal image displayed using different colour palettes (a and b). The locations of interest Sp1 and Sp2 are better differentiated visually when the temperature values are displayed using colour palette (b) versus (a) and reveals the potential impact of colour palette choice for interpretation. To choose the right colour palette the user may need to know what they would like to highlight by differentiating from the surrounding area. For e.g. in this case the pain site (approximate location provided by the patient).
Fig. XX.2 A typical thermal image where there is a temperature variation of almost 1.5o C across a single pixel distance. These locations might be missed on casual visual inspection and may need software tools to highlight the dissimilarity
Fig. XX.3 Hand thermal image showing location of patient-reported pain thought due to underlying inflammation (yellow arrow). In XX.3a, pixel spot (Sp2) indicates the pixel temperature at adjacent skin site to the painful area. Computer-aided software tools system applied to XX.3a defines the areas of similar temperature and noting the extent and pattern of the temperature region commensurate with the painful area (red arrow) (b)
Fig. XX.4 Isotherms plotted by a computer program aids visualisation of fine gradations of temperature in the region (defined by the ‘’box’’ ) in (a). For example around the locations identified at the (yellow arrows) (a) the fine gradations of temperature changes are highlighted by using isotherms (Red arrows) (b)
Fig. XX.5 Flow chart illustrating the working of the HCS process. The input image is initially segmented into regions by clustering similar neighbouring pixels. The initial segmentation of the region is merged for different allowable dissimilarities, between regions, yielding a hierarchy of segmented images. (Reproduced from Selvan 2007)
Fig. XX.6 Comparison of segmentation output of an ill-defined “abnormality” from an X-ray mammogram image (middle row) with border-pixel-re-classification (top row) and without border-pixel-re-classification(bottom row). The delineated cluster
boundaries with border-pixel-re-classification (top row) are more easily visualised as distinct visual clusters when compared to the cluster boundaries delineated without border-pixel-re-classification (bottom row) and is an example of HCS process' capability.
Fig. XX.7 Thermal image of a surgical wound site in grey scale with user outlined
central region (locations 9,10 upper panel Fig. XX.8) reveal three bounded and segmented regions which range from 34.1 to 34.7oC
Fig. XX.8 HCS process' boundaries aid the user to visualise the different
temperature patterns and estimate objective measures; average temperature values of different regions with similar temperature. This is much more appropriate when compared to the summary statistics estimated by the camera software for regular shape ROI (Fig. XX.7a).
Acknowledgements
Our grateful thanks to Dr Jon Willmott, Senior Lecturer in Sensor Systems,
University of Sheffield UK, for his constructive comments during the preparation of this manuscript.