For Peer Review
Decoding fMRI events in Sensorimotor Motor Network using
Sparse Paradigm Free Mapping and Activation Likelihood
Estimates
Journal: Human Brain Mapping Manuscript ID HBM-17-0068.R2 Wiley - Manuscript type: Research Article Date Submitted by the Author: 30-Jul-2017
Complete List of Authors: Tan, Francisca; University of Nottingham School of Physics and Astronomy, Sir Peter Mansfield Imaging Centre; University of Nottingham Ningbo China Faculty of Science and Engineering, Department of Electrical and Electronic Engineering
Caballero, Cesar; Basque Center of Cognition, Brain and Language Mullinger, Karen; University of Nottingham School of Physics and
Astronomy, Sir Peter Mansfield Imaging Centre; University of Birmingham School of Psychology, Birmingham University Imaging Centre
Dryden, Ian; University of Nottingham, School of Mathematical Sciences, Division of Statistics
Cho, David; University of Nottingham Ningbo China Faculty of Science and Engineering, Department of Electrical and Electronic Engineering
Zhang, Yaping; University of Nottingham Ningbo China Faculty of Science and Engineering, Department of Electrical and Electronic Engineering Francis, Susan; University of Nottingham School of Physics and Astronomy, Sir Peter Mansfield Imaging Centre
Gowland, Penny; University of Nottingham School of Physics and Astronomy, Sir Peter Mansfield Imaging Centre
Keywords: Functional MRI, decoding, meta-analysis, Paradigm Free Mapping, Activation Likelihood Estimation
For Peer Review
Decoding fMRI events in Sensorimotor Motor Network using Sparse Paradigm Free 1
Mapping and Activation Likelihood Estimates 2
3
Francisca M. Tana,b, César Caballero-Gaudesc, Karen J. Mullingera,e, Siu-Yeung Chob, Yaping 4
Zhangb, Ian L. Drydend, Susan T. Francisa and Penny A. Gowlanda 5
a
Sir Peter Mansfield Imaging Centre, School of Physics and Astronomy and School of Mathematical 6
Sciences, d The University of Nottingham, University Park, Nottingham, NG7 2RD, United Kingdom 7
b Department of Electrical and Electronic Engineering, University of Nottingham Ningbo China, 8
Ningbo, 315100, People’s Republic of China 9
c Basque Center of Cognition, Brain and Language, San Sebastian, 20009, Spain 10
e Birmingham University Imaging Centre, School of Psychology, University of Birmingham, 11
Birmingham, B15 2TT, United Kingdom 12
13
For Peer Review
1415
16
ABSTRACT 17
Most fMRI studies map task-driven brain activity using a block or event-related paradigm. Sparse 18
Paradigm Free Mapping (SPFM) can detect the onset and spatial distribution of BOLD events in 19
the brain without prior timing information; but relating the detected events to brain function 20
remains a challenge. In this study, we developed a decoding method for SPFM using a 21
coordinate-based meta-analysis method of Activation Likelihood Estimation (ALE). We defined 22
meta-maps of statistically significant ALE values that correspond to types of events and 23
calculated a summation overlap between the normalized meta-maps and SPFM maps. As 24
a proof of concept, this framework was applied to relate SPFM-detected events in the 25
Sensorimotor Network (SMN) to six motor function (left/right fingers, left/right toes, 26
swallowing and eye blinks). We validated the framework using simultaneous 27
Electromyography-fMRI experiments and motor tasks with short and long duration, and 28
random inter-stimulus interval. The decoding scores were considerably lower for eye 29
movements relative to other movement types tested. The average successful rate for short and 30
long motor events was 77 ± 13% and 74 ± 16% respectively, excluding eye movements. We 31
found good agreement between the decoding results and EMG for most events and subjects, 32
with a range in sensitivity between 55 and 100%, excluding eye movements. The proposed 33
method was then used to classify the movement types of spontaneous single-trial events in the 34
SMN during resting state, which produced an average successful rate of 22 ± 12%. Finally, 35
this paper discusses methodological implications and improvements to increase the 36
decoding performance. 37
38
39
40
Keywords: Functional MRI, decoding, meta-analysis, Activation Likelihood Estimation, Paradigm 41
Free Mapping. 42
43
44
45
For Peer Review
INTRODUCTION46
47
Resting state functional MRI (fMRI) data has been shown to contain signatures of brain activation 48
relating to ‘spontaneous events’ or uncued tasks performed by the subject and recently various 49
techniques have been developed to detect these activations (Liu et al., 2013, Smith et al., 2012, 50
Gaudes et al., 2011, Petridou et al., 2013, Caballero Gaudes et al., 2013, Karahanoglu et al., 51
2013, Cisler et al., 2014, Chen et al., 2015, Allan et al., 2015). It remains a major challenge to 52
interpret spontaneous events in terms of brain function. Brain decoding enables us to relate 53
detected brain activity to a specific mental state (Tong and Pratte, 2012). In recent years, 54
machine learning algorithms have been applied to fMRI brain decoding (O'Toole et al., 2005, 55
O'Craven and Kanwisher, 2000, Haxby et al., 2001, Cox and Savoy, 2003, Haynes and Rees, 56
2005, Kamitani and Tong, 2005, Horikawa et al., 2013, Schrouff et al., 2012b). However, such 57
algorithms typically require the acquisition of a training dataset involving similar experimental 58
conditions to those that are to be subsequently decoded. 59
60
An alternative approach is to decode fMRI data based on meta-analyses formed from prior fMRI 61
studies, combining data across different experimental methodologies and parameters (Poldrack, 62
2006), a process known as reverse inference. This approach has the advantage that it can 63
provide information on a large range of brain functions, which is particularly important when 64
decoding spontaneous events of unknown origin. It has been argued that such reverse inference 65
can have predictive power for a given mental process if a brain region is actively engaged 66
(Poldrack, 2006, Poldrack, 2011), by also taking account of task-setting in which the brain 67
activation occurred as well as existing meta-analysis databases (Hutzler, 2014). However, 68
reverse inference of spontaneous events is particularly challenging since the prior probability of 69
these events is unknown, i.e. decoding is difficult if we have no prior information about what 70
occurred during the data acquisition. 71
72
The aim of this study was to decode task-induced and spontaneous events using Sparse 73
Paradigm Free Mapping (SPFM) and meta-analysis. We used SPFM to detect short (3 s) and 74
long (10 s) events in fMRI data without prior information on the timing of any movement or task 75
by using a regularized estimator that deconvolves the fMRI voxel time series assuming a 76
canonical haemodynamic response function (Caballero Gaudes et al., 2013, Petridou et al., 77
2013). We then derived a decoding score relating detected patterns of motor activity to Activation 78
Likelihood Estimation (ALE) obtained from meta-analysis of task-based fMRI studies (Turkeltaub 79
et al., 2002, Laird et al., 2005). We validated the method by decoding events associated with 80
known responses to a set of six motor movements of short and long duration collected with 81
concurrent electromyography (EMG) recordings. We then used this method to determine the type 82
For Peer Review
of spontaneous movements (within a predefined set of possible movements) undertaken during 83
the period of a resting state fMRI acquisition acquired in the same experimental session. 84
85
THEORY 86
87
The following section outlines the use of Sparse Paradigm Free Mapping to detect events, and 88
the formation of meta-maps and subsequent decoding of the fMRI data. 89
90
(i) Sparse Paradigm Free Mapping (SPFM) for fMRI analysis 91
Events can be detected within an fMRI dataset using Sparse Paradigm Free Mapping (SPFM), 92
which requires no prior information on their timings. SPFM deconvolves the fMRI signal based on 93
a linear haemodynamic model of the BOLD events using L1-norm regularized regression to give 94
an SPFM activation map for each time frame in the fMRI data series (Caballero Gaudes et al., 95
2013, Petridou et al., 2013). 96
97
(ii) Formation of meta-maps 98
A meta-map characterizes convergence between the results of different studies and provides a 99
probabilistic atlas of brain function in response to a particular task, which allows us to infer 100
whether activation in a given voxel is likely to be related to a particular task. 101
102
Meta-maps can be formed using the Activation Likelihood Estimation (ALE) method implemented 103
in GingerALE Version 2.3 (available at http://brainmap.org/ale/index.html) (Eickhoff et al., 2012, 104
Eickhoff et al., 2009, Turkeltaub et al., 2012). The coordinate of brain activation due to a 105
particular task, reported in a particular study considered in the meta-analysis, is known as a 106
‘focus’ (Laird et al. 2005). To allow for the uncertainty in the position of the focus due to factors 107
such as inter-subject variability and imperfect anatomical alignment, the probability distribution of 108
the location of the focus is modelled as a 3D Gaussian distribution centered on the focus. Let Fi
109
be the event that any of the foci of activation in response to a particular task from the ith study 110
included in the meta-analysis occurs in the jth voxel, such that P(Fi)j is the probability that a focus
111
from the ith study occurs in voxel j. If X studies are now considered in the meta-analysis, the 112
probability that a focus from any of the studies occurs in the jth voxelis known as the Activation 113
Likelihood Estimation (ALE) value and is given by the union of all the P(Fi)j, assuming that the
114
results of all the studies are independent (Laird et al., 2005). For example, if there is one focus of 115
activation and the ALE value for the jth voxel is P(F)j)=0.01, there is a 1% chance that the focus
116
from any of the studies included in the meta-analysis lay within the jth voxel. A larger ALE value 117
implies that there is a greater chance that one of the foci from the contributing studies lay in that 118
voxel, and so one can infer a higher degree of association between that voxel and the relevant 119
task. 120
For Peer Review
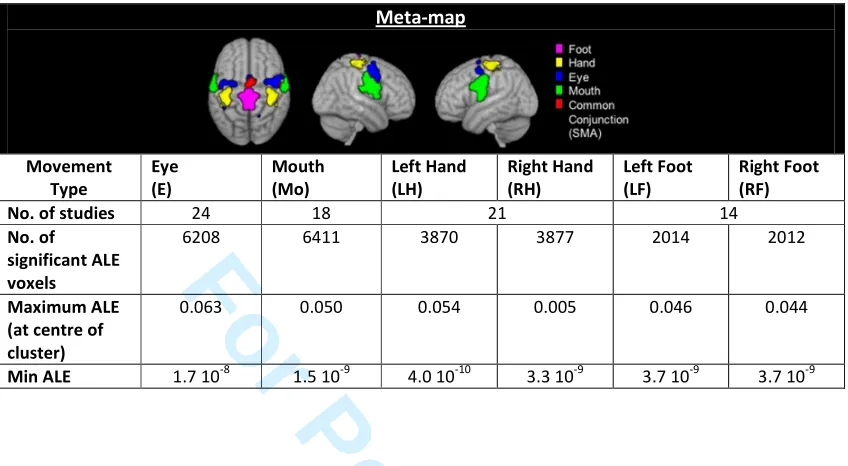
121In this study, we defined a meta-map as a map of statistically significant ALE values for a 122
particular task, normalized to allow comparison between different tasks. The number of meta-123
maps considered, M, determined the number of tasks that could be decoded. Table I shows the 124
M = 6 movement task meta-maps considered in this study, together with the total number of 125
voxels with significant ALE values and the range of significant ALE values for each meta-map. 126
Table II shows the overlap between the different meta-map regions. Since the number of studies 127
used to generate each meta-map differed, each meta-map had a different maximum ALE value. 128
This arbitrary difference between ALE values must be overcome in order to use the meta-maps 129
for decoding. Therefore, we normalized each meta-map by the sum of all voxel values within it, to 130
yield a normalized ALE value: 131
,= ∑ ,
.
[Equation 1]
132
where J is the total number of voxels in the m-type meta-map and , is the ALE value of 133
voxel j in the m-type meta-map. This normalized ALE value ensured that the probability across a 134
meta-map summed to unity, and could be interpreted as the conditional probability of a focus 135
location being in voxel j given there was a focus in meta-map m. 136
137
(iii) Decoding of events 138
The normalized meta-maps could be used to decode events detected with SPFM at each time 139
frame by estimating a decoding score (Dm) that quantified the spatial overlap between an SPFM
140
activation map and the meta-map associated with the mth movement type, where the 141
abbreviations used to indicate each movement type are indicated in parentheses in Table I. For 142
each fMRI time frame, a non-conservative region of interest (ROI) was defined by applying a low 143
z-threshold to the SPFM activation map. For each of the m meta-maps the normalized ALEs 144
were summed within that ROI to give an Overlap Summation score Sm:
145
= ,
[Equation 2]
146
where K was the total number of voxels in the ROI at a SPFM z-threshold . This process was 147
repeated for sequentially increasing values of within a typical range of SPFM activation z-148
scores, to obtain values of Sm as a function of SPFM z-threshold. The maximum possible value
149
of Sm would be 1 (Equation 1), which can be interpreted as the probability of a focus from
meta-150
map m being fully contained within the ROI. 151
152
The decoding score for each meta-map, Dm, was then defined as the area under the curve of Sm
153
plotted against : 154
For Peer Review
=
[Equation 3]
155
where ! and "#$" were minimum and maximum limits of typical SPFM activation z-scores. A 156
large Dm indicated a large overlap between the SPFM ROI and areas of significantly high ALE
157
value (convergence of foci on the mth meta-map), and thus the SPFM event was likely to involve 158
the task related to that meta-map. Integrating Sm in this way overcame the need to choose a
159
particular threshold, whilst ensuring that a high Dmoccurred when the SPFM map overlapped the
160
meta-map across a reasonable range of thresholds. Dm was then converted to a normalized
161
decoding z-score: 162
163
%= )− '(
( [Equation 4]
where '( and )( were the mean and standard deviation of Dm across all time frames for the m
164
meta-map. False Discovery Rate (FDR) correction was then performed (q < 0.05), where the 165
total number of hypotheses was the number of time points multiplied by the number of meta-166
maps. 167
168
This process resulted in M FDR-corrected, time series of decoding z-scores Zm (m = 1,P,M).
169
Significant values of Zmcould then be ranked, with the highest rank value of Zm corresponding to
170
the most likely task type (if any) at each time point. 171
172
METHODS 173
174
The study was approved by the local Ethics Committee, and all subjects gave informed consent. 175
Nine subjects participated, but datasets from two subjects were discarded due to incomplete data 176
collection. The scan session included (i) short and long motor task fMRI paradigms for validation 177
of the decoding method; (ii) resting state data for spontaneous event decoding assessment. 178
179
Paradigm 180
Motor tasks were used to validate the decoding method due to the high specificity of the 181
Sensorimotor Network (SMN) resulting from the nature of its cortical organization (Penfield and 182
Rasmussen, Penfield and Boldrey, 1937). These tasks involved six motor movements: 183
movement of right or left toes (contraction of all toes of the foot), movement of right or left fingers 184
(thumb brushed against the tips of the rest of the fingers from little finger to first finger with the 185
hand palm facing down), eye blinks and swallowing. Subjects were instructed to perform these 186
movements with minimal head motion. 187
For Peer Review
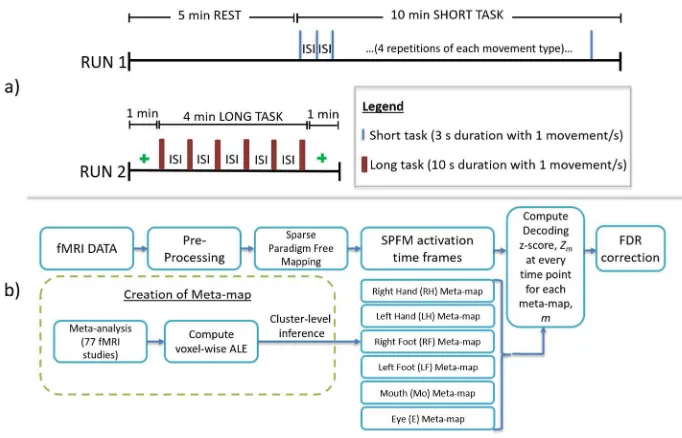
188Each MR session consisted of two paradigms: RUN1 (resting state and short task scan) and 189
RUN2 (long task scan), chosen to test the algorithm in different conditions and illustrated in 190
Figure 1(a). RUN1 consisted of a 5 minute resting state period followed by 10 minutes in which 191
short motor movements were performed. During the resting state period, a blank screen was 192
displayed and the subjects were instructed to keep their eyes open. Fifteen seconds before the 193
motor movement task paradigm began a “GET READYP” text was displayed on the screen. A 194
simple text instruction was then displayed indicating which movement was to be performed (e.g. 195
“R FOOT”). This was followed by a 3 second countdown display and then a red dot flashed 3 196
times at 1 second intervals. Subjects were instructed to perform each movement task with every 197
flash of the dot, except for the swallowing condition for which one movement was performed 198
within the 3 second interval. A white fixation-cross then appeared for a random inter-stimulus 199
interval of 18-24 seconds before the next movement instruction was displayed. This cycle was 200
repeated twenty-four times (four trials of each movement type) within the 10 minute period. 201
RUN2 consisted of 1 minute when a fixation cross was displayed, followed by 4 minutes of long 202
motor movement tasks and then a further 1 minute of fixation cross. In RUN2 each movement 203
type was performed continuously for a longer 10 second period (red dots flashed 10 times at 1 204
second interval) and swallowing movements were performed twice within the 10 second interval. 205
Only a single repeat was performed for each movement type in RUN2, and the inter-stimulus 206
interval varied randomly between 28-32 seconds. 207
208
Surface electromyography (EMG) was recorded throughout to detect muscle activity during the 209
tasks. MR-compatible electrodes were placed on the arms (on left and right extensor digitorum) 210
and legs (across the lower peroneus longus); these electrodes formed bipolar pairs, which were 211
fed into a MR-compatible bipolar amplifier [ExG amplifier, Brain Products, Munich, Germany], a 212
ground electrode was placed on the right elbow. A MR-compatible unipolar amplifier [MR-plus 213
amplifier, Brain Products, Munich, Germany] was used to measure muscle movement in the neck 214
and head simultaneously. Electrodes were placed above and below the center of the subject’s 215
pupil (frontalis and lower orbital orbicularis- right eye only (Blumenthal et al., 2005)), on the jaw 216
(masseter) and the right of neck midline to detect swallowing (approximately on the infrahyoid 217
(Vaiman et al., 2004)), with the reference electrode placed on the nose and the ground electrode 218
on the right mastoid bone. The electrodes were positioned to monitor the movements defined in 219
the meta-maps (see Table I). EMG data were recorded at a sample rate of 5 kHz with a 220
hardware filter set to record in the range 0.016-250 Hz with a roll-off of 30dB/octave at high 221
frequency. All electrodes impedances were kept below 25 kΩ and all electrode leads were 222
twisted to minimize wire loops and the consequential differential effect of the magnetic field on 223
the leads (van Rootselaar et al., 2007). The bipolar amplifier monitoring limb movement was 224
placed at the foot of the scanner bed, whilst the unipolar amplifier monitoring head movements 225
For Peer Review
was placed at the head of the scanner bed. Activity of platysma muscles on the neck could be 226
detected by the electrode on the neck (Vaiman et al., 2004), whilst swallowing movements could 227
be distinguished by their distinctive EMG waveform. 228
229
MR Data Acquisition 230
Data was acquired on a Philips 7 Tesla Achieva scanner [Best, Netherlands] using a 32-channel 231
head coil [Nova Medical]. fMRI data was acquired using axial gradient echo EPI (FOV=208 x 192 232
x 84 mm, voxel size =2 x 2 x 3 mm3, 28 slices, TE=25 ms, TR=1.5 s, flip angle=64o, SENSE 233
factor 3). To minimize head movements, foam pads were used to constrain the subjects’ heads 234
within the head coil. During each fMRI scan, a Vectorcardiogram (VCG) and peripheral pulse unit 235
were used to record the cardiac trace (whichever signal had best quality was used in analysis) 236
and a pneumatic belt placed around the chest was used to record respiratory signals. These 237
signals were collected to allow for physiological noise correction of the fMRI datasets and surface 238
electromyography traces. Following the fMRI data acquisition, a three-dimensional, 1 mm 239
isotropic high resolution T1-weighted MPRAGE scan and T2*-weighted spoiled-FLASH scan were 240
acquired. 241
242
Data Analysis 243
EMG data were analyzed using BrainVision Analyzer2 [Brain Products, Munich, Germany]. 244
Gradient and pulse artefact corrections were performed using the average artefact subtraction 245
technique (Allen et al., 2000, Allen et al., 1998). The gradient artefact was corrected on all 246
channels using a sliding window containing 61 volume averages. Pulse artefact correction was 247
performed for the electrodes on the head and neck. The VCG was used to identify the R-peak of 248
the cardiac cycle (Debener et al., 2008, Mullinger et al., 2008, Allen et al., 2000, Allen et al., 249
1998) and a sliding window of 21 averages was employed in the pulse artefact correction. 250
Absolute differences between active electrode pairs placed on arms, legs, the frontalis and lower 251
orbital orbicularis (for eye movements), and jaw and neck (for swallowing movements) were 252
computed to obtain a single EMG recording to monitor each limb, eye movements and 253
swallowing. The EMG traces were converted to z-scores in MATLAB, and data points with 254
amplitude more than twice the standard deviation of the mean (z-score ≥ 4) were inspected to 255
ensure that they had the appropriate waveform for an EMG trace (to exclude residual gradient 256
artefacts, etc.). The swallowing trace was analyzed by visual inspection since a particular 257
waveform corresponded to swallowing (as opposed to head movement). Markers were manually 258
placed on peaks that reflected both task-related and potential non-task related movements. The 259
final results were visually inspected to discount false positives that could arise from spikes in the 260
traces due to global movements. 261
262
For Peer Review
Figure 1 (b) summarizes the fMRI data analysis steps. fMRI datasets were realigned [SPM8] 263
(http://www.fil.ion.ucl.ac.uk/spm/software/spm8/), physiological noise corrected using 264
RETROICOR (Glover et al., 2000), spatially smoothed with a 4 mm isotropic Gaussian kernel, 265
and low frequency drift corrected up to and including third order fitted polynomials. The effects of 266
signal changes due to sudden head movements were excluded by generating null regressors of 267
those time points with |d’|>0.5 mm/scan where |d’| is the absolute derivative of the net 268
displacement vector from the translational parameters of the realignment procedure (Lemieux et 269
al., 2007). 270
271
To increase computational efficiency, each participants’ fMRI data was analyzed in four sections: 272
R1 (5 minute rest (resting state), scan dynamics 1-200 of RUN1), M1 (first 5 minutes of short 273
movement task, scan dynamics 201-400 of RUN1), M2 (second 5 minutes of short movement 274
task, scan dynamics 401-642 of RUN1) and M3 (long task, all scan dynamics of RUN2). Voxel-275
wise mean correction was performed to compute percentage signal change. Voxels with variance 276
in the top 0.5 percentile were excluded from further analysis, since these voxels tend to be 277
related to draining veins. SPFM was performed on the datasets, using the 3dPFM function in 278
MATLAB (now available in AFNI (NIH/NIMH),
279
http://afni.nimh.nih.gov/pub/dist/doc/program_help/3dPFM.html), using L1-norm Dantzig selector 280
regularization path with Bayesian Information Criterion (BIC) for model selection. This produced 281
an Activation Time Series (ATS) indicating time points corresponding to events for every voxel. 282
Realignment parameters along with their Volterra expansion and null regressors (if any) were 283
included as additional covariates (Caballero Gaudes et al., 2013). ATS outputs from SPFM were 284
converted into a time course of maps of Z-scores. The SPFM output was then visually inspected 285
to exclude any time frames that showed strong artefacts at the edges of the brain and brief whole 286
brain activations (assumed to be motion or residual respiratory artefacts not removed by previous 287
procedures). 288
289
Creating Meta-maps and Decoding 290
Meta-maps for each of the six movement types were created from a meta-analysis of 77 fMRI 291
studies of the eye (n=24) mouth (n=18), hand (n=21), and foot (n=14) movements (Table I) using 292
the BrainMap Sleuth Version 2.0 (BrainMap, http://www.brainmap.org/sleuth/) (see Supporting 293
Information Tables I-IV). Voxel-wise ALE values were computed for each movement type, and 294
these ALE maps were then thresholded using cluster-level inference correction (Eickhoff et al., 295
2012). First, a cluster-forming threshold was chosen (uncorrected p=0.001). For this threshold, a 296
null distribution of cluster sizes was simulated from 5000 experiments selected at random from 297
the BrainMap database, with the same smoothness as the movement being considered (same 298
number of subjects, and same number of foci). ALE values were computed on the foci from this 299
random set of experiments and the cluster-forming threshold was applied. The resulting cluster 300
For Peer Review
sizes were recorded and the process was repeated to produce a null distribution of cluster sizes. 301
All cluster size values were used in each randomization run. A cluster-level inference threshold of 302
p=0.01 was then chosen to determine whether each cluster in the ALE maps was obtained by 303
chance. All ALE computations and cluster level inference correction were performed using 304
GingerALE Version 2.3 software (BrainMap, http://www.brainmap.org/ale/) (Eickhoff et al., 2012, 305
Eickhoff et al., 2009, Turkeltaub et al., 2012). The meta-maps were then normalized (see Theory 306
section). The Supplementary Motor Area (SMA) is commonly active in all meta-maps involving 307
sensorimotor tasks, and so to increase functional specificity between the six movement meta-308
maps, the SMA was masked-out from the ROIs using the SMA mask from the Harvard-Oxford 309
cortical atlas available in FSL (FMRIB, http://fsl.fmrib.ox.ac.uk/fsl/). 310
311
The decoding z-score Zm (see Equation 4 in Theory section) was calculated for each meta-map
312
m, at each time point, using trapezoidal numerical integration implemented in MATLAB between 313
SPFM z-threshold limits in steps of z=0.1. We chose a non-conservative minimum limit zlow=0.1 314
and zhigh=6 since these values were within the typical range of SPFM activation z-scores. Values 315
of Zm > 6 resulted from residual movement artefacts and time frames with such artefact were
316
excluded from analysis. The resulting Zm timecourses for each movement type m were
FDR-317
corrected (q=0.05). Significant decoding z-scores were used to rank the movements in terms of 318
probability of each having occurred at each time point, with the decoded movement type being 319
classified as that with the highest rank. 320
321
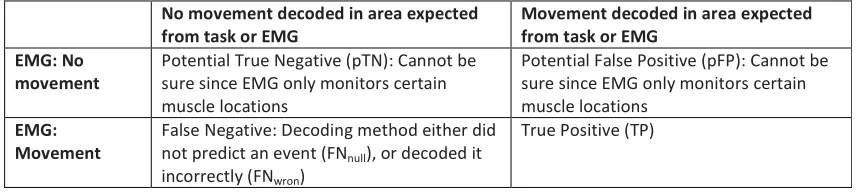
For task-based paradigms, task stimulus timings and EMG traces were used to validate whether 322
the actual movement took place (task or spontaneous movements). A True Positive (TP) was 323
defined as occurring when the meta-map corresponding to the highest ranked Zm matched the
324
movement type of the stimulus and was confirmed by the EMG trace. A False Negative (FN) 325
occurred when the decoding method reported the incorrect movement type (FNwrong), or when Zm
326
failed to decode any event (FNnull). It is not possible to know whether events detected 327
without simultaneous activation in the EMG were actual False Positives since the EMG 328
could only ever record a limited number of movements (restricted by the number of 329
electrodes applied) so we defined these as potential False Positives (Table III). Decoding 330
sensitivity was calculated as TP/(TP+ FN)%. For resting state data, the decoding z-score of 331
detected spontaneous events was compared in a similar way to potential movements identified in 332
the EMG trace. 333
334
RESULTS 335
336
EMG data 337
For Peer Review
Upon visual inspection, EMG traces identified task movements cued by visual stimuli during the 338
entire recordings in all subjects, except for Subject 4 and Subject 6. In Subject 4, contact 339
between electrodes with skin surface at the eye, right foot and left foot became lose halfway 340
through the short task experiment, so for those periods the time at which the stimulus cue 341
occurred was used for validation purposes. In Subject 6, no significant EMG spikes were 342
detected for the first left foot movement and second left hand movement, suggesting that this 343
movement was omitted by the subject during the experiment. 344
345
Motor Validation Task Data 346
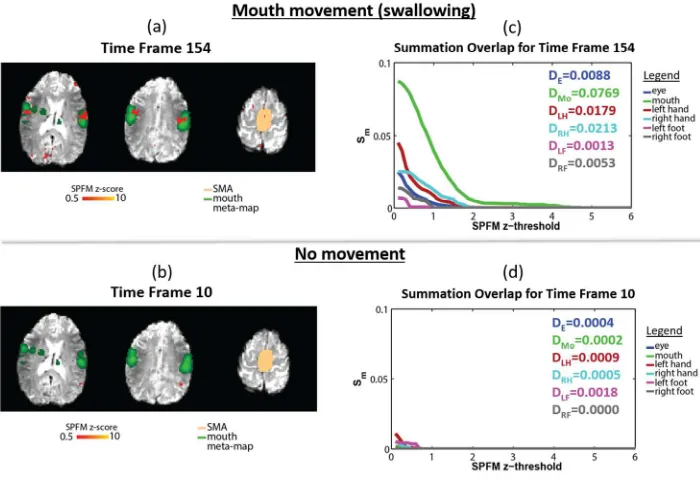
Figure 2 shows example SPFM maps detected at a time corresponding to a short task movement 347
(visually cued swallowing also detected in EMG - Figure 2 (a)), and with no movement (no task 348
stimulus and no EMG spike detected - Figure 2 (b)). The SPFM activation clusters detected 349
during the swallowing task overlapped areas of significant Activation Likelihood Estimation (ALE) 350
values for mouth movements in the corresponding meta-map. During the period of no movement, 351
no activation was detected in the mouth movement meta-map ROIs (or indeed other motor 352
ROIs), although a small area of activation can be seen posterior to the motor areas. Figures 2 (c) 353
and 2 (d) plot the corresponding Overlap Summation score Sm (Equation 2) for the 6 movement
354
meta-maps and also list the decoding scores Dm, based on the area under each of the curves
355
(Equation 3). For short movement task, large activated regions with high z-scores were detected 356
by SPFM, resulting in high Sm values that persisted at higher SPFM z-threshold, particularly
357
when there was large overlap between the activation map and meta-map. In contrast, for the 358
period of no movement the values of the overlap summation Sm were small at low SPFM
z-359
threshold and decreased rapidly with higher SPFM z-threshold for all movement types, since less 360
activation was detected by SPFM. 361
362
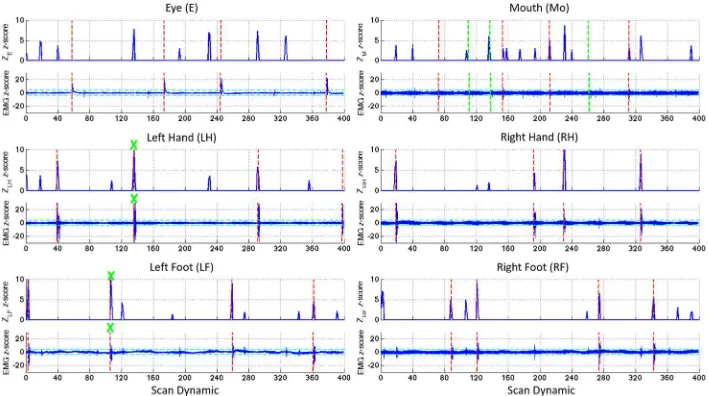
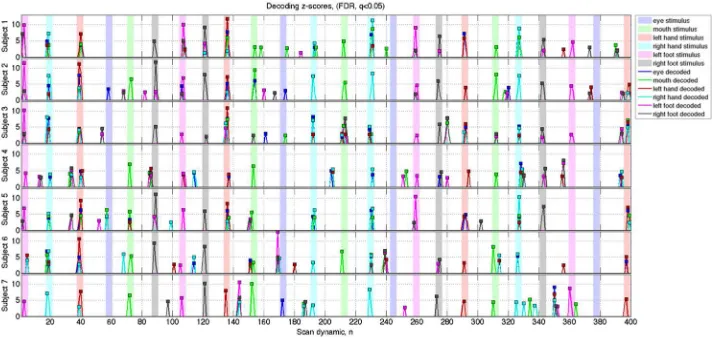
Figure 3 shows the time course of the decoding z-score Zm for each meta-map and the
363
corresponding EMG z-score traces for the short motor tasks for Subject 1. Task-induced motor 364
movements were detected by EMG at the time of the visually-cued stimuli (indicated by dotted 365
red lines). Other spikes were detected sporadically in the EMG traces due to spontaneous (non-366
task) movements or possible residual movements related to tasks due to close proximity of leads 367
leading to the EMG breakout box. Swallowing events are not as apparent in the EMG traces as 368
other movements, but they were detected by their distinctive waveforms, rather than by peaks in 369
the EMG amplitude. Peaks in the appropriate decoding z-score timecourse were generally 370
observed at the time of the visually cued stimulus for hand (LH and RH), foot (LF and RF) and 371
mouth (Mo) movements. For eye blinks (E), the decoding score ZE failed to detect any
task-372
based movements. Two non-task-based swallowing movements were detected in the EMG 373
traces during the left foot and left hand motor tasks at scan dynamics 110 and 137 respectively 374
(green crosses). At these time points ZLF and ZLH had higher amplitudes than ZMo. Figure 4
375
For Peer Review
compares all decoding score with all tasks for all subjects. It can be seen that, excluding eye 376
movements, the highest ranked decoding score correspond to the correct (task) movement type. 377
Peaks in the decoding z-score were also found that were neither task-related nor associated with 378
EMG, for example at time points 184 (LF), 240 (M) and 390 (M) for Subject 1. 379
380
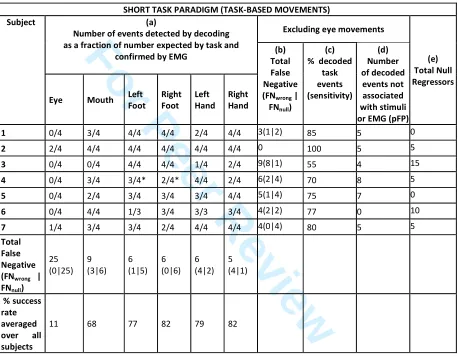
Table IV summarizes the validation results from all subjects for RUN 1 (short motor task). This 381
table shows that generally events were successfully decoded for hand, foot and mouth 382
movements across all subjects. Table IV (a) indicates how often the maximum meta-map 383
decoding score corresponded to a correct movement type. The average successful decoding 384
rate was 66 ± 7 % averaging across all subjects and movement types (77 ± 13% when eye 385
movements were excluded). The decoding rate was only 11 ± 18 % for eye movements across 386
all subjects, for which all false negatives were due to no event being decoded (FNnull) (no 387
significant overlap between meta-map and activation). From Table IV (b), it is also apparent that, 388
besides Subject 3, most of False Negatives were FNnull, but hand movements had a higher 389
misclassification rate (FNwrong greater than FNnull). Importantly for Subject 6, no significant EMG 390
spikes were detected for the first left foot movement and second left hand movement, suggesting 391
that this movement was not performed, the decoding results supported this finding since no foot 392
movement was decoded at these time points. Table IV (e) also shows the number of null 393
regressors included and suggests a relationship between decoding accuracy and lack of 394
movement artefacts. Spontaneous (non-tasked) movements were also detected by EMG (trace 395
not shown in Figure 4), and some of these were successfully decoded for Subject 3 (24%) and 396
Subject 4 (8%), Table V. There were also a number of decoded events that were not associated 397
to any stimuli or EMG traces (excluding eye movements), shown in Table IV (d), which could be 398
interpreted as false positives for the decoding but may be related to activity not detected by 399
EMG. It is not possible to calculate Positive Predicted Value [TP/(TP + FP)] since we 400
cannot confidently label detected events not associated with task or EMG as false 401
positives (FP), since the EMG is unable to detect all possible movements. However, 402
assuming that all potential false positives are actual false positives, the minimum Positive 403
Predicted value would be 77% (range 64-100%). 404
405
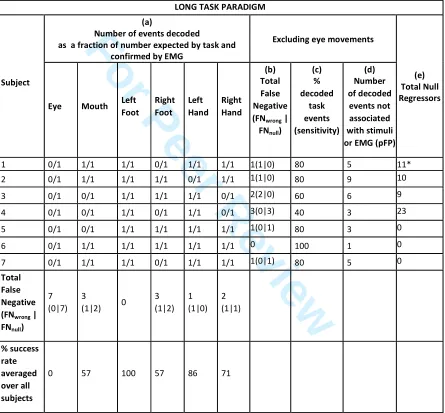
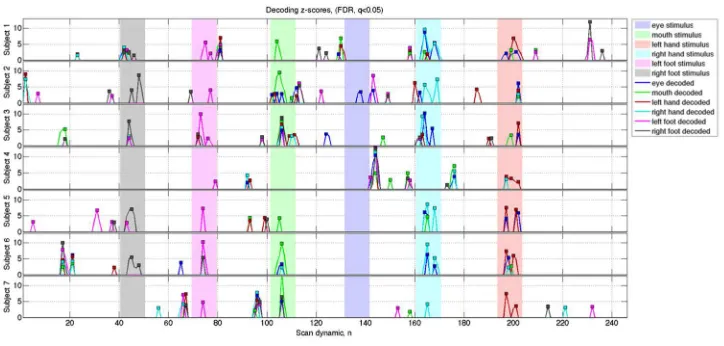
Figure 5 and Table VI summarize the results for RUN2 (long motor task). For Subject 1, at time 406
point 41 there was an increase in decoding score for all movement types, indicating possible 407
head movement that was not excluded by the null regressors (the absolute derivative of the net 408
displacement vector of translational head motion at that time point was |d’|=0.41 mm/scan). The 409
average successful decoding rate for the long task was 74 ± 16% excluding eye movements. In 410
contrast to the short movement task, most False Negatives in the long movement task were 411
attributed to misclassification (FNwrong). The minimum Positive Predicted value would be 47% 412
(range 30-83%).
413
For Peer Review
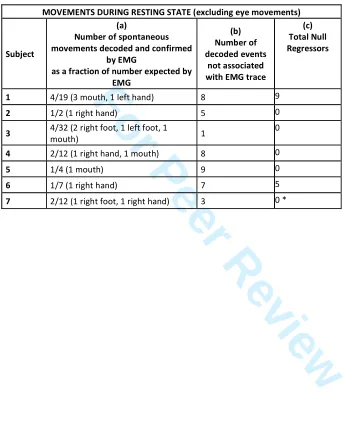
414For the resting state dataset, SPFM detected spontaneous events in the Sensorimotor Network 415
(SMN) that were not attributed to any given task. Asterisks indicate events that were found by 416
decoding and confirmed by EMG. Figure 6 illustrates the variation in the types and durations of 417
movement detected on EMG and decoded events between subjects in the resting state. The 418
meta-maps overlaid on the SPFM maps for corresponding decoded events, corresponding to 419
particular movements detected by EMG at rest for Subject 1 are also shown at the top of Figure 420
6. Table VII (a) shows the fraction of spontaneous events for which the decoding agreed with the 421
movement simultaneously detected on EMG. Table VII (b) summarizes spontaneous events that 422
were detected at rest with significant decoding score, but which were not associated with any 423
event detected by EMG. 424
425
DISCUSSION 426
We have demonstrated a method for decoding movement events in fMRI data with no prior 427
knowledge of the nature of the movement and without using training data sets. Instead, we used 428
Activation Likelihood Estimation and coordinate based meta-analysis. The decoding ranks the 429
potential decoded movements at each time point, with the highest rank taken as the most 430
probable movement type. We have validated the method on both long and short movement 431
tasks, and have also shown that it can decode spontaneous activity occurring in resting state 432
data. 433
There has been substantial development in fMRI brain decoding in recent years involving visual 434
perception, visual features, visual objects, novel visual scenes, attention processes, imagery and 435
working memory, episodic memory, semantic knowledge and phonological representations (Tong 436
and Pratte, 2012). Most of these methods use machine learning algorithms such as Support 437
Vector Machines (SVM) to train a classifier to recognize spatial patterns in order to decode. 438
Several studies have applied machine learning algorithms to decode non-task brain activity by 439
building a classifier based on tasks. Schrouff et al. utilized machine learning (Gaussian 440
Processes classifier) trained on three mental imagery tasks to access activity during rest periods 441
before and after tasks (Schrouff et al., 2012a, Schrouff et al., 2012b). Although the results 442
suggested that classification of resting state sessions can be performed by applying previously 443
trained classifiers, this method is limited to the number of categories the decoder is trained for. 444
Although our method is also limited to the number of meta-maps considered, it is easier to 445
extend it by generating meta-maps for more categories from a large database of literature, 446
compared to reconstructing new experiments to train the decoder. The concept of decoding 447
using meta-analysis is supported by the availability of large-scale automated meta-analysis of 448
fMRI data. Neurosynth (NIH, http://neurosynth.org/) (Yarkoni et al., 2011) measures similarity 449
between a spatial activation map (such as T-map obtained using General Linear Models 450
For Peer Review
analysis) and patterns associated with ‘cognitive maps’ available in its database using a spatial 451
correlation (Pearson correlation). To our best knowledge, no method has been developed to 452
decode spontaneous events quantitatively by means of voxel-wise coordinate-based meta-453
analysis measures and without prior experiments undertaken by the subject being investigated. 454
Depending on computational resources available, the method described is potentially time 455
consuming to implement and run, but has the potential to provide unique information about 456
behavior in the resting state, and separating of distinct behaviors from other brain activity. This 457
could be useful in many ways, for instance, in clinical research studying somatic pain in 458
conditions such as irritable bowel syndrome, or in psychological research in naturalistic 459
paradigms or into emotional congruence. 460
Validation 461
We validated the technique using task-based data where the movement was confirmed by EMG. 462
The decoding method was validated against 24 short task movement trials (3 seconds duration 463
with 1 movement performed per second for each trial), and also against spontaneous events 464
(which are inevitably quite sparse). We found good agreement between decoding results and 465
EMG for most events and subjects, with a range in sensitivity between 55 and 100% excluding 466
eye movements. The sensitivity was lowest for Subject 3, probably related to the fact that this 467
subject showed more motion. Across all subjects, only 11% of short eye movement tasks were 468
successfully detected (high FNnull), probably because of the smaller BOLD signal in response to 469
eye movements, which may be because eye blinks are very common movements that involve a 470
smaller muscle volume compared to many other movements. Furthermore, there is a lack of 471
fMRI literature on eye blinks, so that the studies included in the eye movement meta-map were 472
predominantly eye saccades, which will not have been ideal for decoding eye blinks. This 473
illustrates that decoding can only be achieved reliably if appropriate metamaps are available. 474
During any tasked movement, the decoding score was largest for the meta-map corresponding to 475
the movement being undertaken, but also tended to increase for other movement types. This 476
may be due to overlap between the meta-maps (shown in Table II) or because activation was not 477
confined to the region of a single meta-map during a particular movement. This could indicate a 478
lack of selectivity in the brain’s response to a particular behavior, or functional connectivity within 479
the SMN that is activated as a whole during a given movement (Biswal et al., 1995), although the 480
SMA was masked out during the analysis to increase specificity to different motor activations. 481
Alternatively, it could be due to imperfect registration of meta-maps to the subject’s data space or 482
subject anatomical variability. 483
484
Events may not have been decoded successfully, either because no activation was detected by 485
SPFM or because the activation did not adequately overlap the appropriate meta-map. One 486
For Peer Review
problem with the validation was that although we detected unexplained events (peaks in the 487
decoding traces that were not detected by EMG - potential false positives), it was impossible to 488
determine if these were actual false positives and hence specificity. Some such peaks are 489
always expected since the EMG electrodes were placed at specific muscle locations, and thus 490
not sensitive to all types of movements included in the meta-analysis; the proposed decoding 491
method might provide the only means of interpreting such spontaneous activations. Nonetheless 492
for Subject 6 where no EMG events were detected corresponding to tasked short movements, 493
the method also decoded no movements, strongly suggesting that no movement was actually 494
performed by the subject. The EMG setup was carefully designed to minimize artefacts due to 495
the MRI environment, in particular limiting movement of the electrode leads when the subjects 496
performed a movement. Nonetheless, visual inspection of the thresholded EMG traces showed 497
that some residual lead movements were still picked up by nearby EMG channels (Figure 3). 498
Further validation work would be simplified if movements could be automatically detected in the 499
EMG trace, either by detecting non-periodic perturbations in the traces, or by pattern recognition 500
of waveform patterns in a sliding window approach. 501
Spontaneous events 502
Although the term “resting state” is usually interpreted as no task being undertaken, in reality the 503
brain is always actively performing tasks involving internal or external thoughts, or movements 504
(Binder et al., 1999). Here we confirmed our previous finding that some spontaneous events in 505
the Sensorimotor Network are in fact spontaneous movements as detected by EMG (Petridou et 506
al., 2013). We have previously suggested that functional connectivity is somewhat driven by such 507
spontaneous BOLD events (Allan et al., 2015, Petridou et al., 2013). To what extent these 508
spontaneous events may cause differences in connectivity due to inter-subject or inter-group 509
behavior variability is of great interest but still unknown. 510
Non-tasked movements that occur at rest are often shorter and smaller than task-induced 511
movements, generally causing weaker fMRI activations of smaller spatial extent, and thus 512
insignificant decoding scores. Similarly non-tasked movements also produce lower EMG scores 513
particularly since the EMG was probably not set up to detect the exact spontaneous movement 514
being undertaken. These reasons will have led to, spontaneous events being less likely to 515
be detected, decoded, and confirmed by EMG. However, we expect that faster sampling of 516
fMRI data, for instance using simultaneous multi-slice imaging (Feinberg et al., 2010, Moeller et 517
al., 2010), will provide significantly increased sensitivity to improve decoding. Furthermore, the 518
underlying SPFM algorithms are designed to enforce sparsity in the number of events, but 519
this might be relaxed particularly since the final statistical test for the decoding is much 520
more stringent since it is based on the pattern of activation rather than a single voxel time 521
course. Some spontaneous events were detected in resting state data with significant decoding 522
score, but were not associated with any event detected by EMG. At this stage it is impossible to 523
For Peer Review
know whether these events relate to spontaneous movements, reflect such lack of sensitivity in 524
EMG, or reflect some other underlying spontaneous activity in the SMN, such as motor imagery 525
or planning of action (Mizuguchi et al., 2014). 526
In principle, this approach could be extended to study non-motor brain functions by including 527
metamaps for a wider range of tasks, but this will pose a number of challenges. Firstly, the 528
signals are sometimes smaller in the non-motor networks making detection and decoding more 529
difficult. Secondly, the validation will be more complicated if there is no overt response involved, 530
this might be addressed controlling the state of a subject (e.g. in naturalistic paradigms such as 531
watching a movie) (Hasson et al.). 532
Methodology 533
This section discusses the methodology implications and improvements that can be 534
made to increase the decoding performance in more detail. The TR was 1.5s, limiting the 535
temporal resolution of the data set. Therefore, the 3 events occurring in the short paradigm or the 536
10 events occurring in the long paradigm could not be separated, although the individual events 537
were apparent in the EMG trace. Despite the temporal blurring of the hemodynamic response, 538
we predict that increased temporal resolution, for instance by using simultaneous multi-slice 539
imaging (Feinberg et al., 2010; Moeller et al., 2010), would help to differentiate between 540
individual movements within blocks, in addition to enhancing the performance of the SPFM 541
deconvolution, and consequently the decoding accuracy. This can be pursued in future as fast 542
fMRI sequences become more routinely available. 543
The proposed technique depends on the success of SPFM in detecting events. The combination 544
of the L1-norm (sparse regression) and Bayesian Information Criteria model selection in SPFM 545
controls the number of false positives for event detection (Caballero Gaudes et al., 2013). 546
However, fMRI datasets that are corrupted by large motion artefacts and physiological noise may 547
still have residual noise even after standard motion and physiological noise corrections. In this 548
study, we included six translational motion regressors with their Volterra expansion as regressors 549
for SPFM (Lemieux et al., 2007), and omitted voxels that displayed high variance which were 550
probably due to draining vein artefacts. We also excluded frames by using null regressors where 551
the displacement vector was greater than 0.5 mm per scan and visually scrutinized the SPFM 552
results to exclude time frames that were suspected of containing other artefacts. Alternatively, 553
other methods based on ICA decomposition and the identification of artefactual independent 554
components, such as FIX (Griffanti et al., 2014, Salimi-Khorshidi et al., 2014) or AROMA (Pruim 555
et al., 2015a, Pruim et al., 2015b), or more sophisticated tissue-based nuisance regression such 556
as ANATICOR (Jo et al., 2010, Jo et al., 2013) could be explored to further reduce artefacts and 557
physiological noise from the fMRI data. For the long task (RUN 2), the decoded activations did 558
not extend through the entire stimulus duration (Figure 5). In future work, more sophisticated 559
For Peer Review
SPFM algorithms using a structured L1-norm regularization, such as Fused Lasso or Smooth 560
Lasso (Caballero-Gaudes et al., 2012, Hernandez-Garcia and Ulfarsson, 2011) could provide a 561
more accurate deconvolution for prolonged and intermixed stimuli than the Dantzig Selector, 562
potentially improving decoding accuracy. 563
The method also depends on the accuracy of meta-maps, how well they correspond to the tasks 564
being undertaken, and the overlap between them. The failure to decode eye movements in this 565
study highlights that it is essential for studies used in the meta-analysis to be as similar as 566
possible to the movement type to be decoded. The proposed decoding methodology required 567
maps of expected patterns of activation in response to particular behaviors and for this it uses 568
meta-analysis of many fMRI studies, rather than subject-specific data, although ALE attempts to 569
account for intersubject variance by modelling the location of the activation as a Gaussian 570
distribution. Using datasets acquired from the subject under investigation would increase the 571
sensitivity by providing better overlap between the SPFM and meta-maps matching the subject’s 572
anatomy. This might particularly benefit the decoding of more subtle activations seen in the 573
resting state. However, this would greatly reduce the usefulness of the technique, as it would 574
require all activations of interest to be mapped prior to the decoding experimentfor each subject, 575
rather than building on the expanse of fMRI literature. Increasing the number of studies used in 576
the meta-analysis might also increase the accuracy of ALEs. An alternative approach is to 577
integrate SPFM results with Neurosynth (NIH, http://neurosynth.org/), a platform that synthesizes 578
activation results from many different fMRI studies (Yarkoni et al., 2011). 579
Meta-analysis works well in Sensorimotor Network due to the high selectivity of its cortical 580
organization with limited overlap between activated regions for different motor tasks (Penfield 581
and Rasmussen, Penfield and Boldrey, 1937, Schott, 1993). Here we developed a method of 582
increasing selectivity by masking out the SMA region common to all movement tasks, and further 583
masks could be applied to focus on smaller activated areas (e.g. to decode which finger was 584
being moved (Sanchez-Panchuelo et al.)). Conversely, if the aim were to separate primary types 585
of activation (e.g. visual and motor), then the mask over the SMA could be removed. Extending 586
the decoding method to cognitive resting state networks may be challenging since there is less 587
functional selectivity in the relevant activation maps, which might thus reduce the likelihood of a 588
valid reverse inference (Hutzler, 2014, Poldrack, 2011). 589
In developing this method, we explored several alternative methods of estimating the probability 590
that an activation area was related to a task. Simple binary conjunction between activation maps 591
and meta-maps did not take into account the difference in z-score magnitudes of the SPFM and 592
ALE values. Similarly, spatial correlation between activation and meta-maps was not appropriate 593
since meta-maps are built from Gaussian distributions around foci of activations, which do not 594
take account of the underlying shape of the pattern of activation in the individual studies, which 595
are reflected in SPFM maps. Multiplying activation maps (z-scores) and meta-maps (via p-values 596
For Peer Review
converted to z-scores) together can produce a high product value either due to the activation, the 597
ALE or both, and these situations cannot be distinguished. Building a multivariate distribution 598
from both the ALE z-scores and SPFM z-distribution was not appropriate because the joint 599
distribution was generally biased along the axis of the SPFM distribution, making it impossible to 600
define a simple confidence interval ellipse to detect outliers. 601
The ‘decoding z-score’ developed here is a measure of overlap of SPFM spatial activations with 602
the ALE meta-maps. An advantage of this approach is that it does not require a fixed threshold to 603
be applied to SPFM z-scores, which is important since SPFM z-scores can vary significantly 604
between scans, depending on fMRI data quality and inter-subject differences in BOLD response 605
amplitude. The meta-maps were normalized to allow fair comparison between them. This 606
normalization process assumes that behaviors corresponding to each of the M meta-maps are 607
equally likely to occur in any given time frame. This is reasonable since each time frame is 608
analyzed independently, which is fundamental to the concept of detecting and decoding 609
spontaneous events. If the prior probability of certain events were known for some 610
circumstances, the proposed method could be adapted to consider this information. 611
The decoding performance reported here is lower than that reported for decoding 612
methods based on machine learning or Multivoxel Pattern Analysis (MVPA). However, to 613
our knowledge, previous attempts at decoding based on MVPA have been constrained by 614
the need to acquire training data at an individual level. The proposed method decodes 615
data from one individual using a meta-analysis of fMRI data, i.e. acquired on other 616
individuals and at other times and locations, trading decoding power for lifting the 617
constraint of needing to acquired training data. Future work should investigate whether 618
the combination of machine learning approaches with fMRI meta-analyses would give 619
increased decoding power, although the overlap measures used here could still be used 620
as a measure of the contribution of different behaviors to a particular event. 621
622
CONCLUSION 623
To conclude, this work provides a novel method to decode events detected in fMRI data using 624
Sparse Paradigm Free Mapping in combination with brain decoding based on meta-analysis. 625
After validation in tasked motor movements, the proposed method has determined the nature of 626
spontaneous movements undertaken in the apparent resting state, and we have confirmed these 627
finding using EMG. These results underline our assertion that functional connectivity analysis of 628
resting state data is inevitably affected by spontaneous and unpredictable behaviors. The 629
decoding technique proposed here provides a means of interpreting such spontaneous activity. It 630
is now necessary to determine the sensitivity of these methods to more subtle behaviors and 631
responses. 632
For Peer Review
633For Peer Review
634635
REFERENCES 636
ALLAN, T. W., FRANCIS, S. T., CABALLERO-GAUDES, C., MORRIS, P. G., LIDDLE, E. B., LIDDLE,
637
P. F., BROOKES, M. J. & GOWLAND, P. A. 2015. Functional Connectivity in MRI Is
638
Driven by Spontaneous BOLD Events. PLoS ONE, 10, e0124577.
639
ALLEN, P. J., JOSEPHS, O. & TURNER, R. 2000. A method for removing imaging artifact from
640
continuous EEG recorded during functional MRI. Neuroimage, 12, 230-9.
641
ALLEN, P. J., POLIZZI, G., KRAKOW, K., FISH, D. R. & LEMIEUX, L. 1998. Identification of EEG
642
events in the MR scanner: the problem of pulse artifact and a method for its
643
subtraction. Neuroimage, 8, 229-39.
644
BINDER, J. R., FROST, J. A., HAMMEKE, T. A., BELLGOWAN, P. S., RAO, S. M. & COX, R. W.
645
1999. Conceptual processing during the conscious resting state. A functional MRI
646
study. J Cogn Neurosci, 11, 80-95.
647
BISWAL, B., YETKIN, F. Z., HAUGHTON, V. M. & HYDE, J. S. 1995. Functional connectivity in
648
the motor cortex of resting human brain using echo-planar MRI.
Magn Reson Med,
649
34, 537-41.
650
BLUMENTHAL, T. D., CUTHBERT, B. N., FILION, D. L., HACKLEY, S., LIPP, O. V. & VAN BOXTEL,
651
A. 2005. Committee report: Guidelines for human startle eyeblink electromyographic
652
studies. Psychophysiology, 42, 1-15.
653
CABALLERO-GAUDES, C., KARAHANOGLU, F. I., LAZEYRAS, F. & VAN DE VILLE, D. Structured
654
sparse deconvolution for paradigm free mapping of functional MRI data. Biomedical
655
Imaging (ISBI), 2012 9th IEEE International Symposium on, 2-5 May 2012 2012.
322-656
325.
657
CABALLERO GAUDES, C., PETRIDOU, N., FRANCIS, S. T., DRYDEN, I. L. & GOWLAND, P. A.
658
2013. Paradigm free mapping with sparse regression automatically detects
single-659
trial functional magnetic resonance imaging blood oxygenation level dependent
660
responses. Human brain mapping, 34, 501-18.
661
CHEN, J. E., CHANG, C., GREICIUS, M. D. & GLOVER, G. H. 2015. Introducing co-activation
662
pattern metrics to quantify spontaneous brain network dynamics. Neuroimage, 111,
663
476-88.
664
CISLER, J. M., BUSH, K. & STEELE, J. S. 2014. A comparison of statistical methods for
665
detecting context-modulated functional connectivity in fMRI. Neuroimage, 84,
1042-666
52.
667
COX, D. D. & SAVOY, R. L. 2003. Functional magnetic resonance imaging (fMRI) "brain
668
reading": detecting and classifying distributed patterns of fMRI activity in human
669
visual cortex. Neuroimage, 19, 261-70.
670
DEBENER, S., MULLINGER, K. J., NIAZY, R. K. & BOWTELL, R. W. 2008. Properties of the
671
ballistocardiogram artefact as revealed by EEG recordings at 1.5, 3 and 7 T static
672
magnetic field strength. Int J Psychophysiol, 67, 189-99.
673
EICKHOFF, S. B., BZDOK, D., LAIRD, A. R., KURTH, F. & FOX, P. T. 2012. Activation likelihood
674
estimation meta-analysis revisited. Neuroimage, 59, 2349-61.
675
EICKHOFF, S. B., LAIRD, A. R., GREFKES, C., WANG, L. E., ZILLES, K. & FOX, P. T. 2009.
676
Coordinate-based activation likelihood estimation meta-analysis of neuroimaging
677
data: a random-effects approach based on empirical estimates of spatial uncertainty.
678
Hum Brain Mapp, 30, 2907-26.
679
For Peer Review
FEINBERG, D. A., MOELLER, S., SMITH, S. M., AUERBACH, E., RAMANNA, S., GLASSER, M. F.,
680
MILLER, K. L., UGURBIL, K. & YACOUB, E. 2010. Multiplexed Echo Planar Imaging for
681
Sub-Second Whole Brain FMRI and Fast Diffusion Imaging. PLoS ONE, 5, e15710.
682
GAUDES, C. C., PETRIDOU, N., DRYDEN, I. L., BAI, L., FRANCIS, S. T. & GOWLAND, P. A. 2011.
683
Detection and characterization of single-trial fMRI bold responses: paradigm free
684
mapping. Human brain mapping, 32, 1400-18.
685
GLOVER, G. H., LI, T. Q. & RESS, D. 2000. Image-based method for retrospective correction
686
of physiological motion effects in fMRI: RETROICOR. Magn Reson Med, 44, 162-7.
687
GRIFFANTI, L., SALIMI-KHORSHIDI, G., BECKMANN, C. F., AUERBACH, E. J., DOUAUD, G.,
688
SEXTON, C. E., ZSOLDOS, E., EBMEIER, K. P., FILIPPINI, N., MACKAY, C. E., MOELLER,
689
S., XU, J., YACOUB, E., BASELLI, G., UGURBIL, K., MILLER, K. L. & SMITH, S. M. 2014.
690
ICA-based artefact removal and accelerated fMRI acquisition for improved resting
691
state network imaging. Neuroimage, 95, 232-47.
692
HASSON, U., FURMAN O FAU - CLARK, D., CLARK D FAU - DUDAI, Y., DUDAI Y FAU - DAVACHI,
693
L. & DAVACHI, L. Enhanced intersubject correlations during movie viewing correlate
694
with successful episodic encoding.
695
HAXBY, J. V., GOBBINI, M. I., FUREY, M. L., ISHAI, A., SCHOUTEN, J. L. & PIETRINI, P. 2001.
696
Distributed and overlapping representations of faces and objects in ventral temporal
697
cortex. Science, 293, 2425-30.
698
HAYNES, J. D. & REES, G. 2005. Predicting the stream of consciousness from activity in
699
human visual cortex. Curr Biol, 15, 1301-7.
700
HERNANDEZ-GARCIA, L. & ULFARSSON, M. O. 2011. Neuronal event detection in fMRI time
701
series using iterative deconvolution techniques. Magn Reson Imaging, 29, 353-64.
702
HORIKAWA, T., TAMAKI, M., MIYAWAKI, Y. & KAMITANI, Y. 2013. Neural decoding of visual
703
imagery during sleep. Science, 340, 639-42.
704
HUTZLER, F. 2014. Reverse inference is not a fallacy per se: Cognitive processes can be
705
inferred from functional imaging data. NeuroImage, 84, 1061-1069.
706
JO, H. J., GOTTS, S. J., REYNOLDS, R. C., BANDETTINI, P. A., MARTIN, A., COX, R. W. & SAAD,
707
Z. S. 2013. Effective Preprocessing Procedures Virtually Eliminate
Distance-708
Dependent Motion Artifacts in Resting State FMRI. J Appl Math, 2013.
709
JO, H. J., SAAD, Z. S., SIMMONS, W. K., MILBURY, L. A. & COX, R. W. 2010. Mapping sources
710
of correlation in resting state FMRI, with artifact detection and removal.
711
Neuroimage, 52, 571-82.
712
KAMITANI, Y. & TONG, F. 2005. Decoding the visual and subjective contents of the human
713
brain. Nat Neurosci, 8, 679-85.
714
KARAHANOGLU, F. I., CABALLERO-GAUDES, C., LAZEYRAS, F. & VAN DE VILLE, D. 2013. Total
715
activation: fMRI deconvolution through spatio-temporal regularization. Neuroimage,
716
73, 121-34.
717
LAIRD, A. R., FOX, P. M., PRICE, C. J., GLAHN, D. C., UECKER, A. M., LANCASTER, J. L.,
718
TURKELTAUB, P. E., KOCHUNOV, P. & FOX, P. T. 2005. ALE meta-analysis: Controlling
719
the false discovery rate and performing statistical contrasts. Human brain mapping,
720
25, 155-164.
721
LEMIEUX, L., SALEK-HADDADI, A., LUND, T. E., LAUFS, H. & CARMICHAEL, D. 2007. Modelling
722
large motion events in fMRI studies of patients with epilepsy. Magn Reson Imaging,
723
25, 894-901.
724
LIU, X., CHANG, C. & DUYN, J. H. 2013. Decomposition of Spontaneous Brain Activity into
725
Distinct fMRI Co-activation Patterns. Frontiers in Systems Neuroscience, 7.
726