Development and validation of QMortality risk prediction
algorithm to estimate short term risk of death and assess
frailty: cohort study
Julia Hippisley-Cox, Carol Coupland
ABSTRACT OBJECTIVES
To derive and validate a risk prediction equation to estimate the short term risk of death, and to develop a classification method for frailty based on risk of death and risk of unplanned hospital admission.
DESIGN
Prospective open cohort study. PARTICIPANTS
Routinely collected data from 1436 general practices contributing data to QResearch in England between 2012 and 2016. 1079 practices were used to develop the scores and a separate set of 357 practices to validate the scores. 1.47 million patients aged 65-100 years were in the derivation cohort and 0.50 million patients in the validation cohort.
METHODS
Cox proportional hazards models in the derivation cohort were used to derive separate risk equations in men and women for evaluation of the risk of death at one year. Risk factors considered were age, sex, ethnicity, deprivation, smoking status, alcohol intake, body mass index, medical conditions, specific drugs, social factors, and results of recent investigations. Measures of calibration and discrimination were determined in the validation cohort for men and women separately and for each age and ethnic group. The new mortality equation was used in conjunction with the existing QAdmissions equation (which predicts risk of unplanned hospital admission) to classify patients into frailty groups.
MAIN OUTCOME MEASURE
The primary outcome was all cause mortality. RESULTS
During follow-up 180 132 deaths were identified in the derivation cohort arising from 4.39 million person years of observation. The final model included terms for age, body mass index, Townsend score, ethnic group, smoking status, alcohol intake, unplanned hospital admissions in the past 12 months, atrial fibrillation, antipsychotics, cancer, asthma or chronic obstructive pulmonary disease, living in a care home, congestive heart failure, corticosteroids, cardiovascular disease, dementia, epilepsy, learning disability, leg ulcer, chronic liver disease or pancreatitis, Parkinson’s disease, poor mobility, rheumatoid arthritis, chronic kidney disease, type 1 diabetes, type 2 diabetes, venous thromboembolism, anaemia, abnormal liver function test result, high platelet count, visited doctor in the past year with either appetite loss, unexpected weight loss, or breathlessness. The model had good calibration and high levels of explained variation and discrimination. In women, the equation explained 55.6% of the variation in time to death (R2), and had very good discrimination—the D statistic was 2.29, and Harrell’s C statistic value was 0.85. The corresponding values for men were 53.1%, 2.18, and 0.84. By combining predicted risks of mortality and unplanned hospital admissions, 2.7% of patients (n=13 665) were classified as severely frail, 9.4% (n=46 770) as moderately frail, 43.1% (n=215 253) as mildly frail, and 44.8% (n=223 790) as fit.
CONCLUSIONS
We have developed new equations to predict the short term risk of death in men and women aged 65 or more, taking account of demographic, social, and clinical variables. The equations had good performance on a separate validation cohort. The QMortality equations can be used in conjunction with the QAdmissions equations, to classify patients into four frailty groups (known as QFrailty categories) to enable patients to be identified for further assessment or interventions.
Introduction
NHS England (the commissioning body for the English National Health Service) recently announced that from July 2017 all general practices in England will be contractually obliged to identify patients with moderate and severe frailty as part of the new General Medical Service contract. This is particularly challenging because frailty is a relatively new concept that does not have an agreed definition. Current approaches Division of Primary Care,
University Park, University of Nottingham, Nottingham NG2 7RD, UK
Correspondence to: J Hippisley-Cox
Julia.hippisley-cox@nottingham. ac.uk
Additional material is published online only. To view please visit the journal online.
Cite this as: BMJ 2017;358:j4208
http://dx.doi.org/10.1136/bmj.j4208 Accepted: 7 September 2017
WhAT IS AlReAdy knoWn on ThIS TopIC
Recent NICE guidance on multiple morbidities has highlighted the need to develop new robust equations to identify patients in primary care with reduced life expectancy so that relevant assessments and interventions can be targeted appropriately Existing equations to predict risk of death are based on biased samples, are insufficiently powered, fail to handle missing data appropriately, are poorly reported, or have poor performance to the extent that NICE has been unable to make a positive recommendation on any tool
WhAT ThIS STudy AddS
A new equation (QMortality) quantified absolute risk of death within the next one year in people aged 65 or more, taking account of demographic, social, and clinical variables
QMortality provides a valid measure of absolute risk of death in the general population of older patients, as shown by its performance in a separate validation cohort
to defining frailty involve identifying patients with a collection of diagnoses, symptoms, and social factors.1 2
These factors may be combined into a frailty score. This score is then used to identify patients at risk of important or preventable outcomes such as unplanned hospital admissions or death in the near future.
Although recent guidance from the National Institute for Health Care and Excellence on multiple morbidities3 has recommended tools to predict risk of
unplanned hospital admissions,4 5 NICE was unable
to identify any equations to reliably predict all cause mortality. NICE identified 41 studies that validated an equation to predict all cause mortality, all of which had major limitations. For example, some equations had been developed for purposes other than to predict all cause mortality.2 Other limitations were omitting
key determinants of death, such as age and sex; giving equal weighting to all component factors within an equation (for example, wearing glasses could have equal weighting to ischaemic heart disease); using small unrepresentative samples; inappropriate handling of missing data; and poor reporting and poor performance of the tool in predicting death. The NICE guideline therefore recommended that research should be undertaken to develop new robust equations to identify patients with reduced life expectancy so that relevant assessments and interventions can be targeted appropriately.
We aimed to address the NICE research recommendation by developing a new equation to predict risk of death over a one year period among people aged 65 and older using a large validated medical research database of representative patients in primary care. Our secondary objective was to develop a definition of frailty directly based on risk of outcomes. Instead of creating a frailty index in the hope that it would predict unplanned admissions and all cause mortality, we decided to work the other way round. Starting with principled estimators of unplanned admissions and all cause mortality, we decided to develop a new classification of frailty, known as QFrailty. This would group people into four categories—severely frail, moderately frail, mildly frail, or fit—based on their absolute risks of an unplanned hospital admission or death within a year. This could then provide an outcomes based classification to improve on the electronic frailty index recommended by NHS England.2
Methods
Study design and data source
We undertook a cohort study in a large population of primary care patients in England who were registered with practices contributing to the QResearch database (version 42). All practices had to have used EMIS computer system for at least a year. We randomly allocated three quarters of the practices to the derivation dataset and the remainder to a validation dataset. We identified an open cohort of patients aged 65-100 years registered with practices between 1 January 2012 and 30 September 2016. Exclusions were patients who did
not have a valid National Health Service number and those who did not have a postcode related Townsend score (eg, patients had moved to newly built houses with new postcodes not yet linked to deprivation data or patients were homeless or did not have a permanent residence). We determined an entry date to the cohort for each patient, which was the latest of his or her 65th birthday, date of registration with the practice plus one year, date on which the practice computer system was installed plus one year, and beginning of the study period (1 January 2012). Patients were censored at the earliest date of death, de-registration with the practice, last upload of computerised data, or the study end date (30 September 2016).
Outcomes
Our primary outcome was all cause mortality, using the date of death recorded on the QResearch database. We chose to evaluate risk of death at one year for comparability with other studies and to meet the requirements of the research recommendation in the NICE guidelines. The QResearch database is linked at individual patient level to the hospital admissions data and to mortality records obtained from the Office for National Statistics. The records are linked using a project specific pseudonymised NHS number. The recording of NHS numbers is valid and complete for 99.8% of QResearch patients, 99.9% for ONS mortality records, and 98% for hospital admissions records.4 6
Predictor variables
We examined several predictor variables (see box 1) based on established risk factors already included in the QAdmissions equation4 (which predicts risk
of unplanned hospital admissions) and variables highlighted in the related literature.2 3 7-10
The number of unplanned hospital admissions in the previous 12 months was derived from information on the linked hospital records. All predictor variables were based on the latest coded information recorded in the general practice record before entry to the cohort.
Derivation and validation of the models
We developed and validated the risk prediction equations using established methods.10 12-15 To replace
missing values for body mass index, smoking status, and alcohol intake we used multiple imputation with chained equations and used these values in our main analyses.16-19 We carried out five imputations as this
has relatively high efficiency20 and was a pragmatic
approach accounting for the size of the datasets and capacity of the available servers and software. We included all predictor variables in the imputation model, along with age interaction terms, the Nelson-Aalen estimator of the baseline cumulative hazard, and the outcome indicator.
Cox’s proportional hazards models estimated the coefficients for each risk factor in men and women separately. We used Rubin’s rules to combine the results across the imputed datasets.21 We used fractional
continuous variables (age and body mass index) using data from patients with recorded values to derive the fractional polynomial terms. Initially we fitted full models. We retained variables if they had an adjusted hazard ratio of <0.90 or >1.10 (for binary variables) and were statistically significant at the 0.01 level. We examined interactions between predictor variables and age at study entry and included statistically significant interactions in the final models.
For each variable from the final model we used the regression coefficients as weights, which we combined with the baseline survivor function at one year to derive risk equations.23 We estimated the baseline survivor
function based on zero values of centred continuous variables, with all binary predictor values set to zero.
Validation of the models
In the validation cohort we used multiple imputation to replace missing values for body mass index, smoking status, and alcohol intake. Five imputations were done. We applied the risk equations for men and women obtained from the derivation cohort to the validation cohort and calculated measures of discrimination. As in previous studies,24 we calculated R2 values (explained
variation where higher values indicate a greater Box 1: Predictor variables
• Age (continuous variable)
• Geographical region in England (10 regions) • Townsend deprivation score. This is an area level
continuous score based on the patients’ postcode.11 Originally developed by Townsend,11 the score includes unemployment (as a percentage of those aged 16 or more who are economically active), non-car ownership (as a percentage of all
households), non-home ownership (as a percentage of all households), and household overcrowding. These variables are measured for a given area of approximately 120 households, through the 2011 census, and combined to give a Townsend score for that area. A higher Townsend score implies a greater level of deprivation
• Ethnic group (nine categories)
• Alcohol intake (<1 unit/day, 1-2 units/day, 3-6 units/ day, 7-9 units/day, ≥9 units/day) (see www.nhs.uk/ Livewell/alcohol/Pages/alcohol-units.aspx) • Smoking status (non-smoker; former smoker; light,
moderate, or heavy smoker)
• Body mass index (continuous variable)
• Unplanned admissions in past 12 months (0, 1, 2, or ≥3) as recorded on the linked hospital data
• Poor mobility (poor mobility, housebound, confined to chair, bedridden, requires home visit, receives mobility allowance)
• Lives in a care home (nursing home or residential care)
• Lives alone • Atrial fibrillation • Congestive heart failure
• Cardiovascular disease (myocardial infarction, angina, stroke, or transient ischaemic attack) • Valvular heart disease
• Peripheral vascular disease
• Treated hypertension (hypertension and current antihypertensive treatment)
• Chronic kidney disease (stages 4 or 5) • Diabetes (none, type 1, type 2) • Hypothyroidism
• Hyperthyroidism • Cancer
• Chronic liver disease or pancreatitis
• Malabsorption (including Crohn’s disease, ulcerative colitis, coeliac disease, steatorrhea, blind loop syndrome)
• Peptic ulcer (gastric or duodenal ulcer, simple or complicated ulcer)
• Asthma or chronic obstructive airways disease • Epilepsy
• Dementia • Learning disability • Osteoporosis
• Fragility fracture (hip, spine, shoulder, or wrist fracture)
• Parkinson’s disease or syndrome • Rheumatoid arthritis
• Falls
• Bipolar disorder or schizophrenia • Depression in past 12 months
• Venous thromboembolism • Anaemia (haemoglobin <110 g/L)
• Abnormal liver function test result (bilirubin, alanine aminotransferase, or γ glutamyltransferase more than three times the upper limit of normal)
• High platelet count (>480×109/L)
• Leg ulcer (leg, shin, ankle or foot ulcer, ischaemic neuropathic, arterial, or venous ulcer)
• Blindness (registered blind or partially sighted or visual impairment)
• Appetite loss in past 12 months
• Weight loss in past 12 months (unexplained or abnormal weight loss)
• Urinary incontinence in past 12 months • Nocturia in past 12 months
• Urinary retention in past 12 months (acute or chronic retention)
• Syncope (vasovagal symptom, faint, collapse, “funny turn,” drop attack) in past 12 months
• Dizziness in past 12 months • Insomnia in past 12 months
• Dyspnoea in past 12 months (breathless at rest or on exertion, paroxysmal nocturnal dyspnoea)
• Hearing impairment or deafness in past 12 months • Loneliness in past 12 months
• Use of anticoagulants (≥2 prescriptions in past six months)
• Use of antidepressants (≥2 prescriptions in past six months)
• Use of antipsychotics (≥2 prescriptions in past six months)
• Use of corticosteroids (≥2 prescriptions in past six months)
proportion of variation in survival time explained by the model25), D statistic26 (a measure of discrimination
that quantifies the separation in survival between patients with different levels of predicted risk, where higher values indicate better discrimination), and Harrell’s C statistic at one year and combined these across datasets using Rubin’s rules. Harrell’s C statistic27 is a measure of discrimination (separation)
that quantifies the extent to which those with earlier events have higher risk scores. It is similar to the receiver operating characteristic statistic but takes account of the censored nature of the data. Higher values of Harrell’s C indicate better performance of the model for predicting the relevant outcome. A value of 1 indicates the model has perfect discrimination. A value of 0.5 indicates that the model discrimination is no better than chance. We also evaluated these performance measures in five age groups and nine ethnic groups. We calculated 95% confidence intervals for the performance statistics to allow comparisons with alternative models for the same outcome and across different subgroups.28
We assessed calibration of the mortality score by comparing the mean predicted risks evaluated at one year with the observed risks by 10th of predicted risk. The observed risks were obtained using the Kaplan-Meier estimates evaluated at one year for men and women. We also evaluated performance by calculating Harrell’s C statistics in individual general practices and combined the results using meta-analytical techniques.29
We also applied the latest version of the QAdmissions score to the validation cohort and calculated measures of discrimination for unplanned hospital admissions over one year.
Decision curve analysis
We used decision curve analysis in the validation cohort to evaluate the net benefits of the mortality score.30-32 This method assesses the benefits of correctly
identifying people who will have an event compared with the harms from a false positive classification (which could, for example, lead to unnecessary distress or interventions). The net benefit of a risk equation at a given risk threshold is given by calculating the difference between the proportion of true positives and the proportion of false positives multiplied by the odds of the risk threshold. We calculated the net benefits across a range of threshold probabilities and compared these with alternative strategies of “intervention in everyone” and “intervention in no one.” In general, the strategy with the highest net benefit at any given risk threshold is considered to have the most clinical value.
Development of frailty categories
Since there is no currently accepted threshold for classifying high risk of death, we examined the distribution of predicted risks and calculated a series of centile values. For each centile threshold, we calculated the sensitivity, specificity, and positive and negative predictive values of death over a one year follow-up
period. Using the latest version of the QAdmissions score we also examined the distribution of patients by their risk of unplanned hospital admission over one year.4 We identified unplanned admissions using
the hospital episode statistics linked to QResearch as in the original paper.4 We then classified patients
into four frailty groups based on a combination of their predicted risk of unplanned admission and their predicted risk of death over the next 12 months such that the proportion of patients in each group was broadly similar to that published elsewhere for the “electronic frailty score” (EFI) based on a similar English population.2 In the internal validation of the
EFI score, 3% of the validation cohort were categorised as having severe frailty, 12% as having moderate frailty, 35% as having mild frailty, and 50% as fit. The corresponding values for the EFI external validation cohort were 4%, 16%, 37%, and 43%.
We repeated some analyses, restricting the validation cohort to those with two or more medical conditions who would meet the NICE broad definition of having multiple morbidities. The supplementary tables present the results. To maximise the power and also generalisability of the results we used all the relevant patients on the database. STATA (version 14) was used for all analyses. We adhered to the TRIPOD statement for reporting.33
Patient involvement
No patients were involved in setting the research question or the outcome measures, nor were they involved in the design or implementation of the study. Patient representatives from the QResearch advisory board have written the information for patients on the QResearch website about the use of the database for research. They have also advised on dissemination of the results, including the use of lay summaries describing the research and its results.
Results
Overall study population
Derivation cohort—overall, 1436 QResearch practices in England met our inclusion criteria, of which 1079 were randomly assigned to the derivation dataset, with the remainder (n=357) assigned to the validation cohort. We identified 1 471 558 patients in the derivation cohort aged 65-100 years. Of these, we excluded 2550 (0.2%) who did not have a valid NHS number and a further 2410 (0.2%) who did not have a recorded Townsend score, leaving 1 466 598 for the derivation analysis.
Validation cohort—we identified 500 816 patients in the validation cohort aged 65-100 years. Of those, we excluded 505 (0.1%) who did not have a valid NHS number and a further 833 (0.2%) who did not have a recorded Townsend score, leaving 499 478 for the validation analysis.
Baseline characteristics
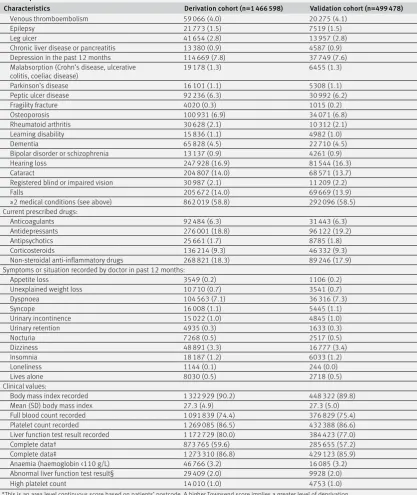
Table 1 | Baseline characteristics of patients aged 65-100 years in derivation and validation cohorts. Values are numbers (percentages) unless stated otherwise
Characteristics Derivation cohort (n=1 466 598) Validation cohort (n=499 478)
Men 661 694 (45.1) 224 547 (45.0)
Mean (SD) age (years) 75.3 (8.0) 75.3 (8.0)
Mean (SD) Townsend deprivation score* −0.7 (3.0) −0.6 (2.9)
Age band (years):
65-69 442 386 (30.2) 151 236 (30.3)
70-74 323 574 (22.1) 110 885 (22.2)
75-79 267 641 (18.2) 90 415 (18.1)
80-84 208 967 (14.2) 70 640 (14.1)
85-100 224 030 (15.3) 76 302 (15.3)
Region in England:
East Midlands 81 431 (5.6) 31 707 (6.3)
East of England 112 915 (7.7) 27 419 (5.5)
London 189 005 (12.9) 69 316 (13.9)
North east 61 255 (4.2) 19 346 (3.9)
North west 256 504 (17.5) 83 381 (16.7)
South central 165 438 (11.3) 81 030 (16.2)
South east 148 212 (10.1) 36 796 (7.4)
South west 179 601 (12.2) 75 051 (15.0)
West Midlands 187 298 (12.8) 50 884 (10.2)
Yorkshire and Humber 84 939 (5.8) 24 548 (4.9)
Ethnic group:
Recorded 1 177 596 (80.3) 391 503 (78.4)
White or not recorded 1 387 476 (94.6) 474 518 (95.0)
Indian 18 601 (1.3) 6065 (1.2)
Pakistani 8008 (0.5) 3160 (0.6)
Bangladeshi 5449 (0.4) 1516 (0.3)
Other Asian 8268 (0.6) 2731 (0.5)
Caribbean 15 916 (1.1) 4415 (0.9)
Black African 7953 (0.5) 2196 (0.4)
Chinese 2957 (0.2) 907 (0.2)
Other ethnic group 11 970 (0.8) 3970 (0.8)
Smoking status:
Recorded 1 451 343 (99.0) 494 576 (99.0)
Non-smoker 785 482 (53.6) 264 165 (52.9)
Former smoker 520 517 (35.5) 179 517 (35.9)
Light smoker 83 757 (5.7) 28 549 (5.7)
Moderate smoker 38 971 (2.7) 13 918 (2.8)
Heavy smoker 22 616 (1.5) 8427 (1.7)
Alcohol intake (units/day):
Recorded 1 349 728 (92.0) 456 150 (91.3)
Non-drinker 539 314 (36.8) 181 050 (36.2)
<1 416 894 (28.4) 141 499 (28.3)
1-2 182 700 (12.5) 62 769 (12.6)
3-6 191 013 (13.0) 63 658 (12.7)
7-9 13 455 (0.9) 4820 (1.0)
>9 5403 (0.4) 2045 (0.4)
Unplanned hospital admissions in past 12 months:
None 1 290 683 (88.0) 439 774 (88.0)
1 116 749 (8.0) 39 834 (8.0)
2 35 430 (2.4) 11 884 (2.4)
≥3 23 736 (1.6) 7986 (1.6)
Clinical and social characteristics:
Poor mobility 142 924 (9.7) 55 134 (11.0)
Living in a residential or nursing home 27 471 (1.9) 9275 (1.9)
Atrial fibrillation 120 671 (8.2) 40 729 (8.2)
Any cancer 162 406 (11.1) 55 175 (11.0)
Asthma or chronic obstructive airways disease 227 226 (15.5) 76 470 (15.3)
Congestive heart failure 57 572 (3.9) 19 749 (4.0)
Cardiovascular disease 307 499 (21.0) 104 925 (21.0)
Treated hypertension 628 106 (42.8) 215 567 (43.2)
Hyperthyroidism 23 432 (1.6) 7672 (1.5)
Hypothyroidism 134 476 (9.2) 46 172 (9.2)
Chronic kidney disease 25 641 (1.7) 8877 (1.8)
Type 1 diabetes 10 123 (0.7) 3348 (0.7)
Type 2 diabetes 220 886 (15.1) 73 909 (14.8)
in 80.3% (n=1 177 596), smoking status in 99.0% (n=1 451 343), alcohol intake in 92.0% (n=1 349 728), and body mass index in 90.2% (n=1 322 929). Overall, 86.8% (n=1 273 310) had complete data for smoking status, alcohol intake, and body mass index. The mean age was 75.3 years, and 12.0% (n=175 915) of patients had one or more unplanned hospital admissions in the past 12 months, 42.8% (n=628 106) had treated hypertension, 21.0% (n=307 499) had cardiovascular disease, 15.1% (n=220 886) had type 2 diabetes,
18.8% (n=276 001) were prescribed antidepressants, and 18.3% (n=268 821) were prescribed non-steroidal anti-inflammatory drugs (NSAIDs). The corresponding results for the validation cohort were similar.
[image:6.595.143.561.82.578.2]Supplementary table 1 shows the patients’ number of medical conditions. In the derivation cohort, 17.3% (n=253 585) did not have any of the 29 conditions listed, 23.9% (n=350 994) had one condition, and 58.8% (n=862 019) had two or more conditions.
Table 1 | Continued
Characteristics Derivation cohort (n=1 466 598) Validation cohort (n=499 478)
Venous thromboembolism 59 066 (4.0) 20 275 (4.1)
Epilepsy 21 773 (1.5) 7519 (1.5)
Leg ulcer 41 654 (2.8) 13 957 (2.8)
Chronic liver disease or pancreatitis 13 380 (0.9) 4587 (0.9)
Depression in the past 12 months 114 669 (7.8) 37 749 (7.6)
Malabsorption (Crohn’s disease, ulcerative
colitis, coeliac disease) 19 178 (1.3) 6455 (1.3)
Parkinson’s disease 16 101 (1.1) 5308 (1.1)
Peptic ulcer disease 92 236 (6.3) 30 992 (6.2)
Fragility fracture 4020 (0.3) 1015 (0.2)
Osteoporosis 100 931 (6.9) 34 071 (6.8)
Rheumatoid arthritis 30 628 (2.1) 10 312 (2.1)
Learning disability 15 836 (1.1) 4982 (1.0)
Dementia 65 828 (4.5) 22 710 (4.5)
Bipolar disorder or schizophrenia 13 137 (0.9) 4261 (0.9)
Hearing loss 247 928 (16.9) 81 544 (16.3)
Cataract 204 807 (14.0) 68 571 (13.7)
Registered blind or impaired vision 30 987 (2.1) 11 209 (2.2)
Falls 205 672 (14.0) 69 669 (13.9)
≥2 medical conditions (see above) 862 019 (58.8) 292 096 (58.5)
Current prescribed drugs:
Anticoagulants 92 484 (6.3) 31 443 (6.3)
Antidepressants 276 001 (18.8) 96 122 (19.2)
Antipsychotics 25 661 (1.7) 8785 (1.8)
Corticosteroids 136 214 (9.3) 46 332 (9.3)
Non-steroidal anti-inflammatory drugs 268 821 (18.3) 89 246 (17.9)
Symptoms or situation recorded by doctor in past 12 months:
Appetite loss 3549 (0.2) 1106 (0.2)
Unexplained weight loss 10 710 (0.7) 3541 (0.7)
Dyspnoea 104 563 (7.1) 36 316 (7.3)
Syncope 16 008 (1.1) 5445 (1.1)
Urinary incontinence 15 022 (1.0) 4845 (1.0)
Urinary retention 4935 (0.3) 1633 (0.3)
Nocturia 7268 (0.5) 2517 (0.5)
Dizziness 48 891 (3.3) 16 777 (3.4)
Insomnia 18 187 (1.2) 6033 (1.2)
Loneliness 1144 (0.1) 244 (0.0)
Lives alone 8030 (0.5) 2718 (0.5)
Clinical values:
Body mass index recorded 1 322 929 (90.2) 448 322 (89.8)
Mean (SD) body mass index 27.3 (4.9) 27.3 (5.0)
Full blood count recorded 1 091 839 (74.4) 376 829 (75.4)
Platelet count recorded 1 269 085 (86.5) 432 388 (86.6)
Liver function test result recorded 1 172 729 (80.0) 384 423 (77.0)
Complete data† 873 765 (59.6) 285 655 (57.2)
Complete data‡ 1 273 310 (86.8) 429 123 (85.9)
Anaemia (haemoglobin <110 g/L) 46 766 (3.2) 16 085 (3.2)
Abnormal liver function test result§ 29 409 (2.0) 9928 (2.0)
High platelet count 14 010 (1.0) 4753 (1.0)
*This is an area level continuous score based on patients’ postcode. A higher Townsend score implies a greater level of deprivation.
†Complete data for all of smoking status, alcohol intake, body mass index, haemoglobin concentration, platelet count, and liver function test before cohort entry.
‡Complete data for imputed variables: smoking status, alcohol intake, and body mass index.
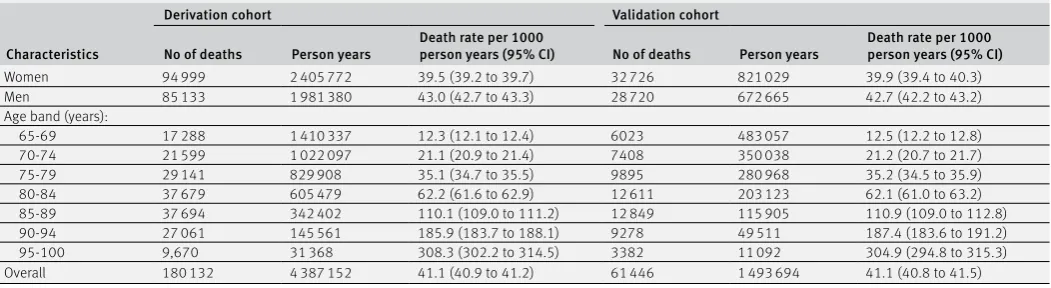
Incidence of death
Table 2 shows the number of patients who died during the study period, the person years of follow-up, and the death rates by age and sex. Overall in the derivation cohort, 180 132 deaths arose from 4.39 million person years of follow-up. In the validation cohort, 61 446 deaths arose from 1.49 million person years of follow-up. In the derivation and validation cohorts 581 702 and 197 834 people, respectively, had five or more years of follow-up.
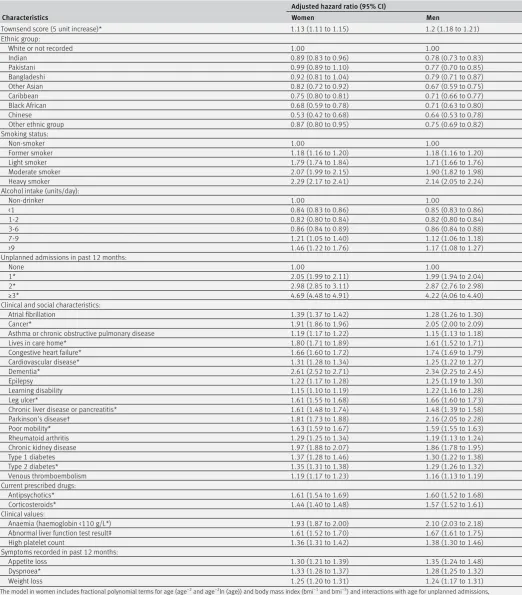
Predictor variables
Table 3 shows the adjusted hazard ratios for the final models for women and men in the derivation cohort. The final model included the variables: fractional polynomial terms for age, fractional polynomial terms for body mass index, Townsend score, ethnic group, smoking status, alcohol intake, unplanned hospital admissions in the past 12 months, atrial fibrillation, antipsychotics, cancer, asthma or chronic obstructive pulmonary disease, living in a care home, congestive heart failure, corticosteroids, cardiovascular disease, dementia, epilepsy, learning disability, leg ulcer, chronic liver disease or pancreatitis, Parkinson’s disease, poor mobility, rheumatoid arthritis, chronic kidney disease, type 1 diabetes, type 2 diabetes, venous thromboembolism, anaemia, abnormal liver function test result, high platelet count, and visits to a general practitioner in the past 12 months with either appetite loss, unexplained weight loss, or dyspnoea (breathlessness). The other variables tested did not meet the criteria for inclusion in the final model.
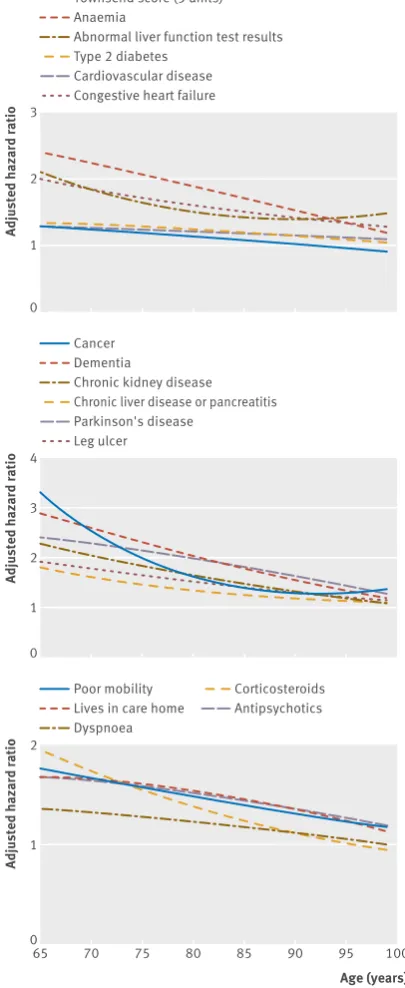
The graphs in figures 1 and 2 show the adjusted hazard ratios in women and men, respectively, for age interaction terms that were statistically significant (see footnote in table 3). For each of these interactions, hazard ratios for the predictors were higher at younger ages compared with older ages.
Validation Discrimination
Table 4 shows the performance of the QMortality score in the validation cohort for women and men at one year. Overall, the values for the R2, D, and C statistics
were higher in women than in men indicating that
the score performed better in women than in men. The mortality equation in women explained 55.6% of the variation in time to death (R2), the D statistic
was 2.29, and Harrell’s C statistic was 0.85. The corresponding values for men were 53.1%, 2.18, and 0.84. Table 4 also shows results for the latest version of the QAdmissions equation for predicting unplanned admissions (based on 160 217 unplanned admissions in the validation cohort over a one year period). Table 4 shows that the performance of the QMortality score for predicting deaths was better than the performance of the QAdmissions score for predicting unplanned admissions.
Supplementary table 2 shows the results for the mortality scores by age group and ethnic group. Performance tended to be better in the younger age groups but was similar across all ethnic groups.
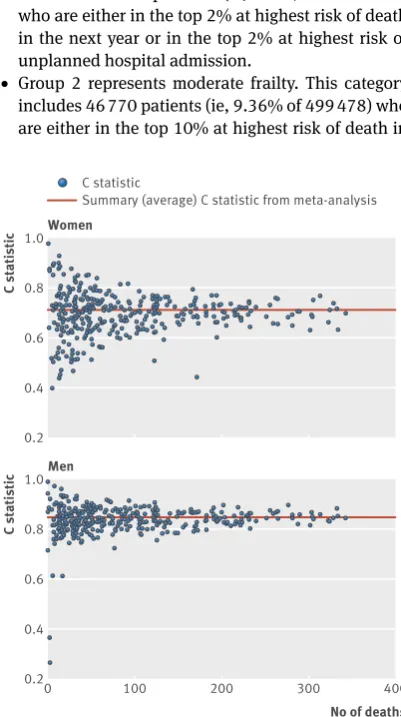
Figure 3 shows plots of Harrell’s C statistic for each general practice in the validation cohort against the number of deaths in each practice in women and men separately. The summary (average) C statistic for women was 0.854 (95% confidence interval 0.850 to 0.859) from a random effects meta-analysis. The I2 value (ie,
the percentage of total variation in C statistic owing to heterogeneity between practices) was 63.2%. The approximate 95% prediction interval for the true C statistic in women in a new practice was 0.80 to 0.91. For men, the summary C statistic was 0.844 (95% confidence interval 0.839 to 0.849). The I2 value was 70.3%. The
approximate 95% prediction interval for the true C statistic in men in a new practice was 0.76 to 0.92.
Supplementary table 3 shows the validation statistics for the mortality score among patients with two or more morbidities (as required by the NICE guideline3).
Calibration
[image:7.595.36.562.93.237.2]Figure 4 displays the observed risks and mean predicted risks of death across each 10th of the predicted risk score (1 representing the lowest risk and 10 the highest risk). This shows that the equation was well calibrated. Supplementary figure 1a-e shows the calibration within each age group. Supplementary table 5 shows overall calibration by age group and ethnic group and for the top 2%, 10%, and 50% of predicted risk. The Table 2 | Number of deaths, person years of follow up, and death rate per 1000 person years of observation (95% confidence intervals) in
derivation and validation cohort
Characteristics
Derivation cohort Validation cohort
No of deaths Person years Death rate per 1000 person years (95% CI) No of deaths Person years Death rate per 1000 person years (95% CI)
Women 94 999 2 405 772 39.5 (39.2 to 39.7) 32 726 821 029 39.9 (39.4 to 40.3)
Men 85 133 1 981 380 43.0 (42.7 to 43.3) 28 720 672 665 42.7 (42.2 to 43.2)
Age band (years):
65-69 17 288 1 410 337 12.3 (12.1 to 12.4) 6023 483 057 12.5 (12.2 to 12.8)
70-74 21 599 1 022 097 21.1 (20.9 to 21.4) 7408 350 038 21.2 (20.7 to 21.7)
75-79 29 141 829 908 35.1 (34.7 to 35.5) 9895 280 968 35.2 (34.5 to 35.9)
80-84 37 679 605 479 62.2 (61.6 to 62.9) 12 611 203 123 62.1 (61.0 to 63.2)
85-89 37 694 342 402 110.1 (109.0 to 111.2) 12 849 115 905 110.9 (109.0 to 112.8)
90-94 27 061 145 561 185.9 (183.7 to 188.1) 9278 49 511 187.4 (183.6 to 191.2)
95-100 9,670 31 368 308.3 (302.2 to 314.5) 3382 11 092 304.9 (294.8 to 315.3)
Table 3 | Adjusted hazard ratios (95% confidence interval) for death in derivation cohort. Models also include fractional polynomial terms for age and body mass index
Characteristics
Adjusted hazard ratio (95% CI)
Women Men
Townsend score (5 unit increase)* 1.13 (1.11 to 1.15) 1.2 (1.18 to 1.21)
Ethnic group:
White or not recorded 1.00 1.00
Indian 0.89 (0.83 to 0.96) 0.78 (0.73 to 0.83)
Pakistani 0.99 (0.89 to 1.10) 0.77 (0.70 to 0.85)
Bangladeshi 0.92 (0.81 to 1.04) 0.79 (0.71 to 0.87)
Other Asian 0.82 (0.72 to 0.92) 0.67 (0.59 to 0.75)
Caribbean 0.75 (0.80 to 0.81) 0.71 (0.66 to 0.77)
Black African 0.68 (0.59 to 0.78) 0.71 (0.63 to 0.80)
Chinese 0.53 (0.42 to 0.68) 0.64 (0.53 to 0.78)
Other ethnic group 0.87 (0.80 to 0.95) 0.75 (0.69 to 0.82)
Smoking status:
Non-smoker 1.00 1.00
Former smoker 1.18 (1.16 to 1.20) 1.18 (1.16 to 1.20)
Light smoker 1.79 (1.74 to 1.84) 1.71 (1.66 to 1.76)
Moderate smoker 2.07 (1.99 to 2.15) 1.90 (1.82 to 1.98)
Heavy smoker 2.29 (2.17 to 2.41) 2.14 (2.05 to 2.24)
Alcohol intake (units/day):
Non-drinker 1.00 1.00
<1 0.84 (0.83 to 0.86) 0.85 (0.83 to 0.86)
1-2 0.82 (0.80 to 0.84) 0.82 (0.80 to 0.84)
3-6 0.86 (0.84 to 0.89) 0.86 (0.84 to 0.88)
7-9 1.21 (1.05 to 1.40) 1.12 (1.06 to 1.18)
>9 1.46 (1.22 to 1.76) 1.17 (1.08 to 1.27)
Unplanned admissions in past 12 months:
None 1.00 1.00
1* 2.05 (1.99 to 2.11) 1.99 (1.94 to 2.04)
2* 2.98 (2.85 to 3.11) 2.87 (2.76 to 2.98)
≥3* 4.69 (4.48 to 4.91) 4.22 (4.06 to 4.40)
Clinical and social characteristics:
Atrial fibrillation 1.39 (1.37 to 1.42) 1.28 (1.26 to 1.30)
Cancer* 1.91 (1.86 to 1.96) 2.05 (2.00 to 2.09)
Asthma or chronic obstructive pulmonary disease 1.19 (1.17 to 1.22) 1.15 (1.13 to 1.18)
Lives in care home* 1.80 (1.71 to 1.89) 1.61 (1.52 to 1.71)
Congestive heart failure* 1.66 (1.60 to 1.72) 1.74 (1.69 to 1.79)
Cardiovascular disease* 1.31 (1.28 to 1.34) 1.25 (1.22 to 1.27)
Dementia* 2.61 (2.52 to 2.71) 2.34 (2.25 to 2.45)
Epilepsy 1.22 (1.17 to 1.28) 1.25 (1.19 to 1.30)
Learning disability 1.15 (1.10 to 1.19) 1.22 (1.16 to 1.28)
Leg ulcer* 1.61 (1.55 to 1.68) 1.66 (1.60 to 1.73)
Chronic liver disease or pancreatitis* 1.61 (1.48 to 1.74) 1.48 (1.39 to 1.58)
Parkinson’s disease† 1.81 (1.73 to 1.88) 2.16 (2.05 to 2.28)
Poor mobility* 1.63 (1.59 to 1.67) 1.59 (1.55 to 1.63)
Rheumatoid arthritis 1.29 (1.25 to 1.34) 1.19 (1.13 to 1.24)
Chronic kidney disease 1.97 (1.88 to 2.07) 1.86 (1.78 to 1.95)
Type 1 diabetes 1.37 (1.28 to 1.46) 1.30 (1.22 to 1.38)
Type 2 diabetes* 1.35 (1.31 to 1.38) 1.29 (1.26 to 1.32)
Venous thromboembolism 1.19 (1.17 to 1.23) 1.16 (1.13 to 1.19)
Current prescribed drugs:
Antipsychotics* 1.61 (1.54 to 1.69) 1.60 (1.52 to 1.68)
Corticosteroids* 1.44 (1.40 to 1.48) 1.57 (1.52 to 1.61)
Clinical values:
Anaemia (haemoglobin <110 g/L*) 1.93 (1.87 to 2.00) 2.10 (2.03 to 2.18)
Abnormal liver function test result‡ 1.61 (1.52 to 1.70) 1.67 (1.61 to 1.75)
High platelet count 1.36 (1.31 to 1.42) 1.38 (1.30 to 1.46)
Symptoms recorded in past 12 months:
Appetite loss 1.30 (1.21 to 1.39) 1.35 (1.24 to 1.48)
Dyspnoea* 1.33 (1.28 to 1.37) 1.28 (1.25 to 1.32)
Weight loss 1.25 (1.20 to 1.31) 1.24 (1.17 to 1.31)
The model in women includes fractional polynomial terms for age (age−2 and age−2ln (age)) and body mass index (bmi−1 and bmi−5) and interactions with age for unplanned admissions, Townsend score, anaemia, abnormal liver function test result, type 2 diabetes, cardiovascular disease, heart failure, cancer, dementia, chronic kidney disease, chronic liver disease or pancreatitis, leg ulcer, poor mobility, care home residence, dyspnoea, corticosteroids, and antipsychotics.
The model in men includes fractional polynomial terms for age (age3 and age3ln (age)) and BMI (bmi−2 and bmi−2ln(bmi)) and interactions with age for unplanned admissions, Townsend score, anaemia, abnormal liver function test result, type 2 diabetes, cardiovascular disease, heart failure, cancer, dementia, chronic kidney disease, chronic liver disease or pancreatitis, leg ulcer, poor mobility, care home residence, dyspnoea, corticosteroids, antipsychotics, and Parkinson’s disease.
*Interaction with age, hazard ratios evaluated at mean age for men and women. †interaction with age, hazard ratios evaluated at mean age for men only.
results were generally good except for over-prediction in Chinese women and under-prediction in black African women, although numbers of deaths were relatively small in these subgroups.
[image:9.595.143.556.65.570.2]Decision curve analysis
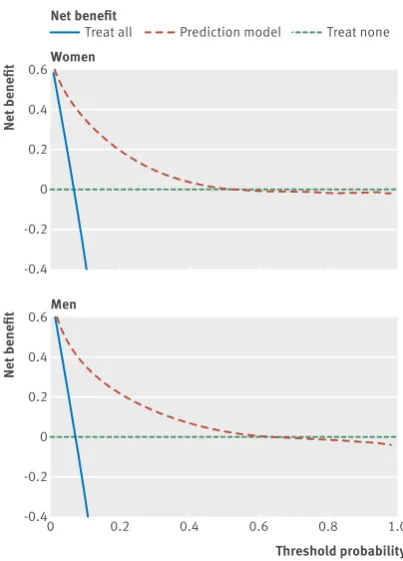
Figure 5 displays the net benefit curves for the mortality equations at one year in men and women. These show that the prediction equations had higher net benefit than did strategies based on considering either no patients or all patients for intervention for risk thresholds up to around 50%.
Sensitivity and specificity
Table 5 shows the sensitivity, specificity, and positive and negative predictive values for the mortality
equation at one year for various thresholds based on patients in the validation cohort.
Table 6 shows that the risk threshold for the top 2% at highest risk of death in the next year was 47.0%, for the top 10% was 20.3%, and for the top 50% was 2.9%. With a risk threshold of 20.3% over one year to identify the 10% of patients with the highest risk of death, the sensitivity for identifying deaths was 37.4%, specificity 97.3%, positive predictive value 46.0%, and negative predictive value 91.4%. Supplementary table 4 shows the results restricted to patients with two or more medical conditions.
Adjusted hazard ratio
0 1 2 3
Townsend score (5 units) Anaemia
Abnormal liver function test results Type 2 diabetes
Cardiovascular disease Congestive heart failure
Adjusted hazard ratio
0 1 2 4
3
Cancer Dementia
Chronic kidney disease
Chronic liver disease or pancreatitis Leg ulcer
Age (years)
Adjusted hazard ratio
0 1 2 3
65 70 75 80 85 90 95 100
Poor mobility Lives in care home Dyspnoea
[image:9.595.356.559.77.572.2] [image:9.595.141.341.83.541.2]Corticosteroids Antipsychotics
Fig 1 | Hazard ratios for all cause mortality in women by age
Adjusted hazard ratio
0 1 2 3
Townsend score (5 units) Anaemia
Abnormal liver function test results Type 2 diabetes
Cardiovascular disease Congestive heart failure
Adjusted hazard ratio
0 1 2 4
3
Cancer Dementia
Chronic kidney disease Chronic liver disease or pancreatitis Parkinson's disease
Leg ulcer
Age (years)
Adjusted hazard ratio
0 1 2
65 70 75 80 85 90 95 100
Poor mobility Lives in care home Dyspnoea
Corticosteroids Antipsychotics
The corresponding thresholds for risk of unplanned hospital admission over one year were 60.7% to identify the top 2%, 34.0% for the top 10%, and 10.0% for the top 50% (results not shown).
[image:10.595.34.349.100.209.2]Classification of frailty
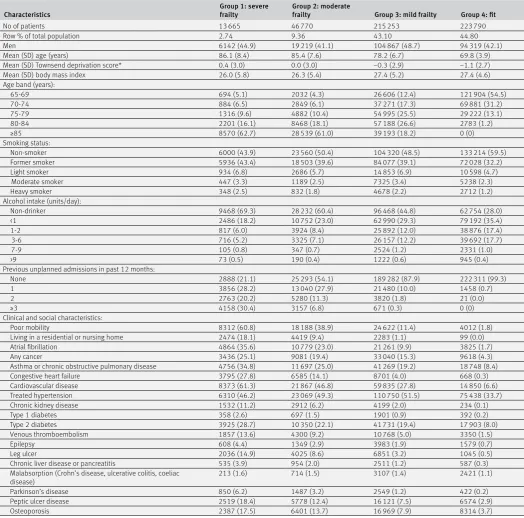
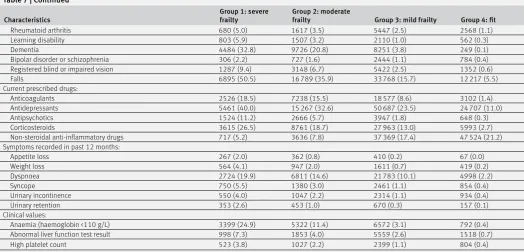
Table 7 shows the characteristics of patients from the validation cohort split into four QFrailty groups that are broadly equivalent to the proportion of patients reported to be in the four categories according to the EFI.2 • Group 1 represents severe frailty. This category
includes 13 665 patients (ie, 2.74% of 499 478) who are either in the top 2% at highest risk of death in the next year or in the top 2% at highest risk of unplanned hospital admission.
• Group 2 represents moderate frailty. This category includes 46 770 patients (ie, 9.36% of 499 478) who are either in the top 10% at highest risk of death in
the next year or in the top 10% at highest risk of unplanned hospital admission (excluding those in the severe category).
• Group 3 represents mild frailty. This category includes 215 253 patients (ie, 43.1% of 499 478) who are either in the top 50% at highest risk of death in the next year or in the top 50% at highest risk of unplanned hospital admission (excluding those in the severe and moderate categories).
• Group 4 represents being “fit.” This category includes 223 790 patients (ie, 44.80% of 499 478) not in the above three categories.
For example, for those in the severe frailty category, the mean age is 86.1 years, 98.5% (n=13 460) have multimorbidity, 60.8% (n=8312) have poor mobility, 61.3% (n=8373) have cardiovascular disease, 50.5% (n=6895) have had falls, 46.2% (n=6310) have treated hypertension, 40.0% (n=5461) are taking antidepressants, 35.6% (n=4864) have atrial fibrillation, 34.8% (n=4756) have asthma or chronic Table 4 | Performance of QMortality algorithm to predict one year risk of death, and
QAdmissions score to predict risk of unplanned admission over one year in men and women aged 65-100 years in validation cohort
Statistics
Mean (95% CI)
Women Men
QMortality score:
D statistic 2.29 (2.27 to 2.31) 2.18 (2.16 to 2.20)
Harrell’s C 0.853 (0.850 to 0.856) 0.844 (0.841 to 0.847)
R2 (%) 55.6 (55.2 to 56.0) 53.1 (52.6 to 53.6)
QAdmissions score:
D statistic 1.50 (1.49 to 1.51) 1.45 (1.44 to 1.46)
Harrell’s C 0.757 (0.755 to 0.759) 0.751 (0.748 to 0.753)
R2 (%) 34.9 (34.5 to 35.2) 33.5 (33.0 to 33.9)
C statistic
Women
Men
0.2 0.6 0.8 1.0
0.4
C statistic
Summary (average) C statistic from meta-analysis
No of deaths
C statistic
0 100 200 300 400
0.2 0.6 0.8 1.0
[image:10.595.357.558.325.730.2]0.4
Fig 3 | Plots of discrimination across 357 general practices showing Harrell’s C statistic against number of deaths in women and men
Predicted 1 year risk (%)
Observed 1 year risk (%)
Women
0 10 20 30 40 50
0 10 20 30 40 50
Observed 1 year risk (%)
Men
0 10 20 30 40 50
[image:10.595.141.342.362.721.2]obstructive pulmonary disease, 32.8% (n=4484) have dementia, 28.7% (n=3925) have type 2 diabetes, 25.1% (n=3436) have a diagnosis of cancer, 24.9% (n=3399) have anaemia, 19.9% (n=2724) have dyspnoea, 18.5% (n=2526) are taking anticoagulants, and 18.4% (n=2519) have peptic ulcer disease.
discussion
Recent NICE guidance on multiple morbidities3
highlighted the need to develop new robust equations to identify patients in primary care with reduced life expectancy so that relevant assessments and interventions can be targeted appropriately. Existing equations to predict risk of death are based on biased samples, are insufficiently powered, fail to handle
missing data appropriately, are poorly reported, or have poor performance to the extent that NICE has been unable to make a positive recommendation for any of the 41 models included in the review.3 We
therefore developed and validated equations to predict absolute risk of death over the next year in men and women aged 65-100 years. The QMortality equations performed well on a separate validation cohort, with good levels of discrimination and calibration, improving on other equations used to predict all cause mortality.2334 The final model has good face validity
as it includes demographic and clinical variables that clinicians would expect to affect mortality risk such as age, body mass index, deprivation, ethnicity, smoking status, alcohol intake, unplanned admissions in the past 12 months; atrial fibrillation, antipsychotics, cancer, asthma or chronic obstructive pulmonary disease, living in a care home, congestive heart failure, corticosteroids, cardiovascular disease, dementia, epilepsy, learning disability, leg ulcer, chronic liver disease or pancreatitis, Parkinson’s disease, poor mobility, rheumatoid arthritis, chronic renal disease, type 1 diabetes, type 2 diabetes, venous thromboembolism, anaemia, abnormal liver function test result, high platelet count, and visits to a doctor in the past year with either appetite loss, unexpected weight loss, or breathlessness.
Although the QMortality equation contains many variables, it is intended to be integrated into general practice computer systems where the extraction of data and risk calculation can be automated. We considered whether to develop a more parsimonious model with fewer predictors for use in other clinical settings but decided it would be preferable to have one model and for the user to select default values on the understanding that there may be a degree of under-estimation or over-under-estimation of risk depending on the predictor in question.
Potential uses of the frailty classification and mortality index
In this study we have described a specific novel use for mortality estimates, which is to classify patients
Net benefit
Women Net benefit
-0.4 -0.2 0 0.2 0.4 0.6
Threshold probability
Net benefit
Men
0 0.2 0.4 0.6 0.8 1.0
-0.4 -0.2 0 0.2 0.4 0.6
[image:11.595.141.343.68.349.2]Treat all Prediction model Treat none
Fig 5 | Decision curve analysis for women and men
Table 5 | Sensitivity, specificity, and positive and negative predictive values for death at different thresholds of predicted risk of death over one year in validation cohort
Threshold Risk threshold % True negative (count) False negative (count) False positive (count) True positive (count) Sensitivity (%) Specificity (%) Positive predictive value (%) Negative predictive value (%)
Top 1% 58.3 436 007 58 477 2025 2969 4.8 99.5 59.5 88.2
Top 2% 47.0 433 741 55 748 4291 5698 9.3 99.0 57.0 88.6
Top 3% 40.2 431 282 53 212 6750 8234 13.4 98.5 55.0 89.0
Top 4% 35.4 428 786 50 713 9246 10 733 17.5 97.9 53.7 89.4
Top 5% 31.7 426 128 48 377 11 904 13 069 21.3 97.3 52.3 89.8
Top 10% 20.3 411 084 38 447 26 948 22 999 37.4 93.8 46.0 91.4
Top 15% 14.3 393 760 30 797 44 272 30 649 49.9 89.9 40.9 92.7
Top 20% 10.6 374 710 24 873 63 322 36 573 59.5 85.5 36.6 93.8
Top 25% 8.2 354 411 20 198 83 621 41 248 67.1 80.9 33.0 94.6
Top 30% 6.4 333 225 16 410 104 807 45 036 73.3 76.1 30.1 95.3
Top 35% 5.1 311 237 13 424 126 795 48 022 78.2 71.1 27.5 95.9
Top 40% 4.2 288 786 10 901 149 246 50 545 82.3 65.9 25.3 96.4
Top 45% 3.4 265 826 8887 172 206 52 559 85.5 60.7 23.4 96.8
[image:11.595.38.564.599.757.2]Table 6 | Thresholds for classification of patients into one of four frailty groups
1 year risk of death*
1 year risk of unplanned hospital admission*
≥60.7% 34.1-60.6% 10.1-34.0% <10.1%
≥47.0% Severe frailty Severe frailty Severe frailty Severe frailty
20.3-46.9% Severe frailty Moderate frailty Moderate frailty Moderate frailty
2.9-20.2% Severe frailty Moderate frailty Mild frailty Mild frailty
<2.9% Severe frailty Moderate frailty Mild frailty Fit
Patients are classified according to the highest risk group. For example, a patient with a one year risk of death of 50% and a one year risk of unplanned admission of 8% would be classified in the severely frail group; a patient with a one year risk of death of 50% or a one year risk of unplanned admission of 62% would be classified in the severely frail group; and a patient with a 2% risk of death and a 5% risk of unplanned admission would be classified as “fit.”
*Risk thresholds correspond to highest 2%, 10%, and 50% absolute risks.
Table 7 | Characteristics of patients in validation cohort in each of the four frailty categories based on one year risk of unplanned admission or one year risk of death. Values are numbers (column percentages) unless stated otherwise
Characteristics Group 1: severe frailty Group 2: moderate frailty Group 3: mild frailty Group 4: fit
No of patients 13 665 46 770 215 253 223 790
Row % of total population 2.74 9.36 43.10 44.80
Men 6142 (44.9) 19 219 (41.1) 104 867 (48.7) 94 319 (42.1)
Mean (SD) age (years) 86.1 (8.4) 85.4 (7.6) 78.2 (6.7) 69.8 (3.9)
Mean (SD) Townsend deprivation score* 0.4 (3.0) 0.0 (3.0) −0.3 (2.9) −1.1 (2.7)
Mean (SD) body mass index 26.0 (5.8) 26.3 (5.4) 27.4 (5.2) 27.4 (4.6)
Age band (years):
65-69 694 (5.1) 2032 (4.3) 26 606 (12.4) 121 904 (54.5)
70-74 884 (6.5) 2849 (6.1) 37 271 (17.3) 69 881 (31.2)
75-79 1316 (9.6) 4882 (10.4) 54 995 (25.5) 29 222 (13.1)
80-84 2201 (16.1) 8468 (18.1) 57 188 (26.6) 2783 (1.2)
≥85 8570 (62.7) 28 539 (61.0) 39 193 (18.2) 0 (0)
Smoking status:
Non-smoker 6000 (43.9) 23 560 (50.4) 104 320 (48.5) 133 214 (59.5)
Former smoker 5936 (43.4) 18 503 (39.6) 84 077 (39.1) 72 028 (32.2)
Light smoker 934 (6.8) 2686 (5.7) 14 853 (6.9) 10 598 (4.7)
Moderate smoker 447 (3.3) 1189 (2.5) 7325 (3.4) 5238 (2.3)
Heavy smoker 348 (2.5) 832 (1.8) 4678 (2.2) 2712 (1.2)
Alcohol intake (units/day):
Non-drinker 9468 (69.3) 28 232 (60.4) 96 468 (44.8) 62 754 (28.0)
<1 2486 (18.2) 10 752 (23.0) 62 990 (29.3) 79 192 (35.4)
1-2 817 (6.0) 3924 (8.4) 25 892 (12.0) 38 876 (17.4)
3-6 716 (5.2) 3325 (7.1) 26 157 (12.2) 39 692 (17.7)
7-9 105 (0.8) 347 (0.7) 2524 (1.2) 2331 (1.0)
>9 73 (0.5) 190 (0.4) 1222 (0.6) 945 (0.4)
Previous unplanned admissions in past 12 months:
None 2888 (21.1) 25 293 (54.1) 189 282 (87.9) 222 311 (99.3)
1 3856 (28.2) 13 040 (27.9) 21 480 (10.0) 1458 (0.7)
2 2763 (20.2) 5280 (11.3) 3820 (1.8) 21 (0.0)
≥3 4158 (30.4) 3157 (6.8) 671 (0.3) 0 (0)
Clinical and social characteristics:
Poor mobility 8312 (60.8) 18 188 (38.9) 24 622 (11.4) 4012 (1.8)
Living in a residential or nursing home 2474 (18.1) 4419 (9.4) 2283 (1.1) 99 (0.0)
Atrial fibrillation 4864 (35.6) 10 779 (23.0) 21 261 (9.9) 3825 (1.7)
Any cancer 3436 (25.1) 9081 (19.4) 33 040 (15.3) 9618 (4.3)
Asthma or chronic obstructive pulmonary disease 4756 (34.8) 11 697 (25.0) 41 269 (19.2) 18 748 (8.4)
Congestive heart failure 3795 (27.8) 6585 (14.1) 8701 (4.0) 668 (0.3)
Cardiovascular disease 8373 (61.3) 21 867 (46.8) 59 835 (27.8) 14 850 (6.6)
Treated hypertension 6310 (46.2) 23 069 (49.3) 110 750 (51.5) 75 438 (33.7)
Chronic kidney disease 1532 (11.2) 2912 (6.2) 4199 (2.0) 234 (0.1)
Type 1 diabetes 358 (2.6) 697 (1.5) 1901 (0.9) 392 (0.2)
Type 2 diabetes 3925 (28.7) 10 350 (22.1) 41 731 (19.4) 17 903 (8.0)
Venous thromboembolism 1857 (13.6) 4300 (9.2) 10 768 (5.0) 3350 (1.5)
Epilepsy 608 (4.4) 1349 (2.9) 3983 (1.9) 1579 (0.7)
Leg ulcer 2036 (14.9) 4025 (8.6) 6851 (3.2) 1045 (0.5)
Chronic liver disease or pancreatitis 535 (3.9) 954 (2.0) 2511 (1.2) 587 (0.3)
Malabsorption (Crohn’s disease, ulcerative colitis, coeliac
disease) 213 (1.6) 714 (1.5) 3107 (1.4) 2421 (1.1)
Parkinson’s disease 850 (6.2) 1487 (3.2) 2549 (1.2) 422 (0.2)
Peptic ulcer disease 2519 (18.4) 5778 (12.4) 16 121 (7.5) 6574 (2.9)
[image:12.595.35.560.241.759.2]into four frailty categories. This has been achieved by combining the one year predicted risk of death with the one year predicted risk of unplanned hospital admission to help identify the most severely frail patients for enhanced care packages to meet the immediate requirements of the UK General Medical Services contract. The most severe frailty category will identify patients with particularly high levels of morbidity who are at highest risk of death or unplanned hospital admission. This group of patients is likely to reflect elderly patients who are the most severely frail and who can be identified for focused assessment and intervention as part of the new General Medical Services contract in England. This includes falls assessment and drug review. The QMortality score could be used in conjunction with the QAdmissions score to allocate patients to one of four QFrailty categories. It could also be used recurrently to build and maintain practice based lists of patients with different levels of frailty or mortality risks over time. This could be done as an automated procedure using electronic health records.
The models can also be used in a face-to-face consultation between the patient and clinician with the intention of sharing the information with the patient to assess management options. The decision curve analysis shows there is a higher net benefit for the prediction models than strategies based on considering either no patients or all patients for intervention for risk thresholds up to around 50%. Mortality estimates including cancer stage and grade are already used to help patients with cancer to weigh up the risks and benefits of surgery, chemotherapy, and radiotherapy.35 Patients with a high risk of death
in the near future may choose to decline aggressive
treatments or defer preventive treatments, screening interventions, or interventions for asymptomatic conditions.36 Mortality estimates could also be used to
help guide the introduction and addition of palliative care to help plan end of life care.37 For example,
six month mortality estimates in the United States are used to trigger Advance Care Planning and also to determine access to hospice services under the Medicare scheme.38 They are also used to improve
self awareness of health status; to measure, monitor, and compare outcomes between different healthcare providers36; and are used by governments to decrease
the burden of certain risk factors at a population level.34
Ethical considerations
We see an important distinction between factors that are included in a risk equation to ensure that the risk estimates are as accurate as possible and how the risk equation is then used in guidelines and clinical practice to ensure ethical, effective, and equitable access to services for everyone. The primary purpose of our paper is to report on the development and validation of new risk equations rather than to produce national policy or clinical guidance, although we recognise the results may be used by policy makers and clinicians. All clinical decisions about the beneficial and safe use of these risk equations necessarily remain the responsibility of the attending clinician. However, there are ethical issues to consider about how the tools might be used. We have analysed this within the “four ethical principles” framework, which is widely used in medical decision making. The four principles are autonomy, beneficence, justice, and non-maleficence.39 The new
[image:13.595.35.560.79.331.2]risk equations, when implemented in clinical software, Table 7 | Continued
Characteristics Group 1: severe frailty Group 2: moderate frailty Group 3: mild frailty Group 4: fit
Rheumatoid arthritis 680 (5.0) 1617 (3.5) 5447 (2.5) 2568 (1.1)
Learning disability 803 (5.9) 1507 (3.2) 2110 (1.0) 562 (0.3)
Dementia 4484 (32.8) 9726 (20.8) 8251 (3.8) 249 (0.1)
Bipolar disorder or schizophrenia 306 (2.2) 727 (1.6) 2444 (1.1) 784 (0.4)
Registered blind or impaired vision 1287 (9.4) 3148 (6.7) 5422 (2.5) 1352 (0.6)
Falls 6895 (50.5) 16 789 (35.9) 33 768 (15.7) 12 217 (5.5)
Current prescribed drugs:
Anticoagulants 2526 (18.5) 7238 (15.5) 18 577 (8.6) 3102 (1.4)
Antidepressants 5461 (40.0) 15 267 (32.6) 50 687 (23.5) 24 707 (11.0)
Antipsychotics 1524 (11.2) 2666 (5.7) 3947 (1.8) 648 (0.3)
Corticosteroids 3615 (26.5) 8761 (18.7) 27 963 (13.0) 5993 (2.7)
Non-steroidal anti-inflammatory drugs 717 (5.2) 3636 (7.8) 37 369 (17.4) 47 524 (21.2)
Symptoms recorded in past 12 months:
Appetite loss 267 (2.0) 362 (0.8) 410 (0.2) 67 (0.0)
Weight loss 564 (4.1) 947 (2.0) 1611 (0.7) 419 (0.2)
Dyspnoea 2724 (19.9) 6811 (14.6) 21 783 (10.1) 4998 (2.2)
Syncope 750 (5.5) 1380 (3.0) 2461 (1.1) 854 (0.4)
Urinary incontinence 550 (4.0) 1047 (2.2) 2314 (1.1) 934 (0.4)
Urinary retention 353 (2.6) 453 (1.0) 670 (0.3) 157 (0.1)
Clinical values:
Anaemia (haemoglobin <110 g/L) 3399 (24.9) 5322 (11.4) 6572 (3.1) 792 (0.4)
Abnormal liver function test result 998 (7.3) 1853 (4.0) 5559 (2.6) 1518 (0.7)
High platelet count 523 (3.8) 1027 (2.2) 2399 (1.1) 804 (0.4)
are designed to provide more accurate information for patients and clinicians on which to base decisions, thereby promoting shared decision making and patient autonomy. They are intended to result in clinical benefit by identifying where changes in management are likely to benefit patients, thereby promoting the principle of beneficence. Justice can be achieved by ensuring that the use of the risk equations results in fair and equitable access to health services that are commensurate with the patients’ level of risk. Lastly, the risk assessment must not be used in a way that causes harm either to the individual patient or to others (for example, by introducing or withdrawing treatments where this is not in the patients’ best interest) thereby supporting the non-maleficence principle. How this applies in clinical practice will naturally depend on many factors, especially the patient’s wishes, the evidence base for any interventions, the clinician’s experience, national priorities, and the available resources. The risk assessment equations therefore supplement clinical decision making, not replace it.
Comparison with the other risk scores
A recent review of 41 mortality risk scores reported in 24 research papers failed to identify any that could be reliably used to predict mortality in a community settitng.3 Of the studies reviewed, the Charleston
comorbidity index, which consists of 23 variables, achieved the best C statistic, with a value of 0.77 in the internal validation cohort and 0.80 in the external validation cohort.3 40 Other studies have used risk
scores to predict mortality, such as the John Hopkins Aggregated Diagnostic Groups (ADG) score41 and the
Hospital-patient One-year Mortality Risk (HOMR) score.36 The HOMR score consists of 12 patient
variables and eight hospital admission factors and was designed to predict one year mortality risk in adults aged 18-100 years admitted to hospital. It includes fractional polynomial terms for continuous variables and interactions between statistically significant predictors. The HOMR score has excellent calibration and discrimination, with a C statistic of 0.92, although this may reflect the much wider age range in the HOMR study. The ADG score consists of 30 variables and has been validated using a community based sample. However, the C statistic was lower (0.81) than the values for the QMortality score (0.84 in men and 0.85 in women), and the ADG equation is not published or freely available.41
The electronic frailty index (EFI) is a simple unweighted count of the number of “deficits” a patient has out of a total of 36, where a deficit is a physical disability or social vulnerability as identified by a consensus panel.2 The EFI has also
been used to predict mortality in a UK community based population, although performance (based on standard definitions42) was poor or fair, with a C
statistic of 0.66 on an internal validation cohort and 0.76 on an external validation cohort.2 The EFI also
had extremely low levels of explained variation in time to death of 0.02-0.04%,2 whereas the QMortality
scores explained 53% and 55% of the variation in men and women, respectively. The EFI equation has not been published and it does not appear to include continuous variables such as age. The QMortality and QAdmissions equations include all the factors in the EFI, where these predicted either risk of death or risk of unplanned hospital admission. Unlike the EFI, our equations include further key determinants of death and unplanned admissions, such as age, sex, ethnic group, smoking status, alcohol intake, deprivation, and previous unplanned admissions, and also include major conditions—cancer, epilepsy, serious mental illness, chronic liver disease, inflammatory bowel disease, learning disability, specific drug treatments— which are all relevant to risk of outcomes and for which patients are likely to need ongoing careful assessment. Our multivariable analysis has allowed us to attribute appropriate weights to each factor and incorporate interactions between age and different medical conditions. This means, for example, that a patient who is 65 years old with three medical conditions will have a different absolute risk of death or unplanned hospital admission than a patient with the same conditions but who is aged 95 years.
Methodological considerations
The methods to derive and validate these models are broadly the same as for a range of other clinical risk prediction tools derived from the QResearch database.7 8 12 43 44 The strengths and limitations of the
approach have already been discussed in detail.7 14 43 45-47
In summary, key strengths include size, duration of follow-up, representativeness, and lack of selection, recall, and respondent bias. UK general practices have good levels of accuracy and completeness in recording clinical diagnoses and prescribed drugs.48 We think
our study has good face validity since it has been conducted in the setting where most patients in the UK are assessed, treated, and followed up. Limitations of our study include the lack of formal adjudication of diagnoses, information bias, and potential for bias owing to missing data. Our database has linked hospital admissions data and is therefore likely to have picked up the majority of hospital admissions, thereby minimising ascertainment bias. We focused on two hard outcomes to identify frail patients (unplanned admissions and mortality) rather than admission to a nursing home or decline in function, as both of these are more difficult to measure using electronic health records. Also, for simplicity we grouped all cancers together as a single variable rather than distinguish between different types of cancer and account for grade and stage. This was a pragmatic decision, partly driven by the lack of information in general practice records about grade and stage of cancer and the availability of existing purpose designed tools such as the QCancer prognostic scores.49 QMortality will tend