The permeability of virtual macroporous structures generated by sphere packing
models: Comparison with analytical models
A. J. Otaru and A. R. Kennedy
#Faculty of Engineering, University of Nottingham, Nottingham, UK
#Corresponding author: Tel +44 115 9513744
Email:
[email protected]
;
Abstract
Realistic porous structures typical of those made by replication of packed beds of spherical particles have been produced by a novel modelling method. Fluid dynamics simulation of the permeability of these structures agrees well with experimental measurements and similar modelling of structures derived from X-ray tomographic images. By varying the model structures the “bottleneck” flow concept proposed by analytical models in the literature was substantiated, confirming the high dependence of permeability on the size of the windows connecting the pores but also highlighting the need for accurate determination of the connectivity of the pores for these models to be accurate.
Keywords
Porous material, modelling, simulation
Porous metals are commonly used as structures that interact with a fluid in processes such as heat exchange and storage, filtration and separation. Pivotal to the performance of these structures is the resistance to fluid flow that is provided by the porous body, usually described by the pressure drop per unit length developed across the structure as a function of the flow rate (or velocity) of the fluid through it. For laminar flow conditions in a given fluid, the permeability of the porous structure, which is affected by the porosity, pore size, shape and connectivity, relates flow rate and pressure gradient through Darcy’s law.
Fig 1 Optical micrographs, left of a porous sample made by vacuum casting using near-spherical NaCl beads [4] and right, an X-ray CT image showing the typical pore connectivity.
Simple permeability models for laminar flow have been developed [5, 6] which could assist with the design of these porous metal structures to meet the requirements for specific applications. Both approaches use the same premise, considering the window between the pores to be a “bottleneck” to the flow through the structure. The models consider different particle contact cases (loose packing [6] and packing enhanced through compaction [5]) with different approaches to including contributions from the window size and coordination number. The model to predict the
permeability according to [6] is presented in Eq 1 where is the porosity, Nc the coordination
number, rw the window radius and rp the radius of the pore. The coordination number and window
radius are defined in separate equations, the coordination number as a function of the packing fraction (also shown in Eq 1), and the window radius in terms of the infiltration pressure and particle (pore) size. The model in [5] reduces to the same expression for permeability for the case of dense random particle packing if Nc = 6 (which is not atypical of this packing condition [7, 8])
𝐾 = 𝑁𝑐 ∅𝑟𝑤3
6𝜋𝑟𝑝 where 𝑁𝑐 =
4−∅+√2+7∅+∅2
2(1−∅)
Eq 1
𝐾 𝑟𝑝 𝑟𝑤3 = 𝑁𝑐
∅ 6𝜋
Reasonable correlation between experimental measurements of permeability and the models was observed in both cases, with deviations attributed, in part, to the non-spherical nature of some of the salt particles used. Thus a strong dependence upon the size of the windows connecting the pores and the permeability is apparent and controlling the window size,
through varying the infiltration pressure [6] has the capacity (for a given pore size) to vary the permeability by more than a factor of 10 and would be more convenient way to vary the permeability rather than by altering the packing (porosity) through additional and potentially costly processing steps.
A prior study by this group [4] demonstrated that the discrete element method (DEM) can be used to accurately model the packing of spherical NaCl particles (both monosized and in binary mixtures) and from this the structures of porous metals made by the infiltration thereof. Coupled with simple mathematical processing of the spatial data for the packed spheres and development of the
conditions for contacting of neighbouring beads, the number of windows linking neighbouring pores, and their size, was also accurately predicted, enabling useful insights into the
connectivity of these structures.
This study has adopted this same DEM method and has created packed beds of monosized spheres, controlling the packing fraction by altering the coefficient of friction between the particles, giving packing conditions varying from loose to dense random packing (in the range of packing fraction from 0.59 to 0.64). Simple code written in MATLAB was used to process x, y, z particle coordinates and radius data from the DEM simulation, applying a criterion to determine whether particles are connected. This method is detailed in [ 4] but in brief, two particles are assumed to be connected if the gap separating them cannot be filled by the infiltrating liquid. This ability to fill the gap is controlled by the capillary radius, rc,
determined from the Laplace equation. For the Al-NaCl system [9, 10] an infiltration pressure of 1 bar leads to a capillary radius of approximately 20 m and hence particles separated by less than 40 m are deemed “contacting” for this infiltration condition. An extension to this previous study is the graphical representation of this connection through calculation of the radius of the zone that is excluded from infiltration by the liquid (using a simple geometrical model also presented in [4]) and adding the position of the centre of the contact and the radius to the data set. The Matlab code then draws a series of 2D sliced (binary) images of the particles and contacts and exports them as tiff files (in this case at a resolution of 300 dpi).
A representative model was created by converting the 2D slices into a 3D volume within the ScanIP package of SimplewareTM, a 3D image processing, analysis and model generation software package.
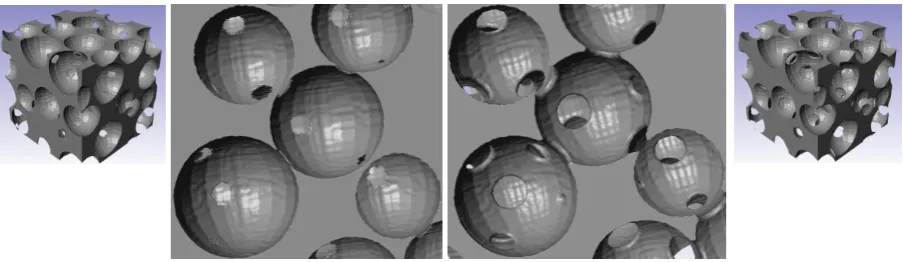
[image:3.595.73.525.634.765.2]The binary images were thresholded and then a smoothing function was applied to minimise facets created by the slicing process. A smart mask process (with 10 iterations) was preferred to a recursive Gaussian smoothing operation as this more accurately preserved the imported geometry, in particular the geometry of the windows. A cubic representative volume element (RVE) that was 6 times the particle or pore radius was extracted from the centre of the samples, the size of which was determined by expanding a small volume until the sphere volume (or porosity) was the same as the bulk. Porosity and pore radius measurements were made within Scan IP to ensure that the sphere dimensions and packing characteristics were a close representation of the DEM data.
Figure 2 Images of DEM structures and RVE for different capillary radii (left) 10m and (right) 80m
Simulations were performed using the + Flow module in SimplewareTM, using a built-in Stokes flow
solver. The permeability in the flow direction was determined from the calculated pressure drops (the outlet pressure was set to zero) for a series of flow velocities (for water) in the laminar flow regime. Impermeable side wall boundary conditions were applied (the normal velocity component at the walls is constrained to zero) but for the RVE size chosen and for the reasonably symmetrical structures, a less than a 5% difference in the permeability was observed when either linear pressure variation or solid side wall boundary conditions were applied. Extensive scale-dependent and mesh-dependent studies were conducted to determine the optimum balance of mesh scale to convergence time and accuracy. A linear tetrahedral mesh (LTM) was used and to capture information in the “bottleneck” areas the mesh growth rate was optimised leading to element counts of the order of 1.5 - 2.0 million. Permeability values obtained in the same way using the CFD module in COMSOL Multiphysics were within >95% agreement with the +Flow module.
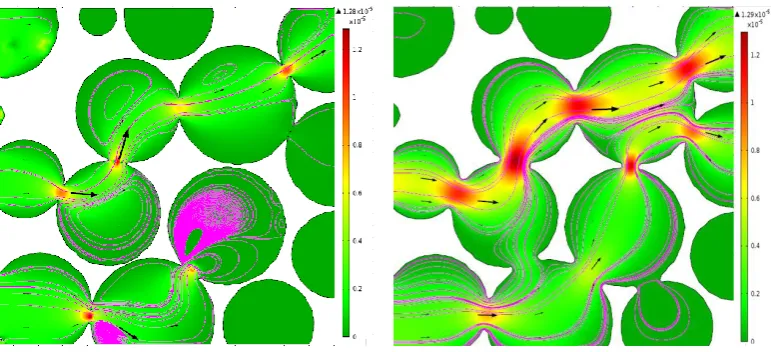
CFD modelling was performed for structures constructed from monosized spheres that were 1, 2 and 3 mm in diameter, for capillary radii between 10 and 80 m, leading to porosities between 60 and 68%, typical of structural characteristics that might be observed for porous metals made by salt bead replication using vacuum or low pressure casting methods. Figure 3 shows the typical flow behaviour in these structures, for the same region but extremes of capillary radius. Rate-controlling “bottleneck” flow is apparent through the windows between pores, highlighted by the regions of high velocity that correspond to the colour scale and which are also indicated by the velocity vectors. Streamlines that have been superimposed onto these plots show recirculation of fluid in “dead end” pores at low capillary radius and that at high capillary radius the flow is less constricted as the interconnectivity of the pores increases.
[image:4.595.105.491.449.625.2]
Figure 3: Representations of flow behaviour (fluid velocity scale and streamlines) on 2D slices for different capillary radii (left) 10m and (right) 80m.
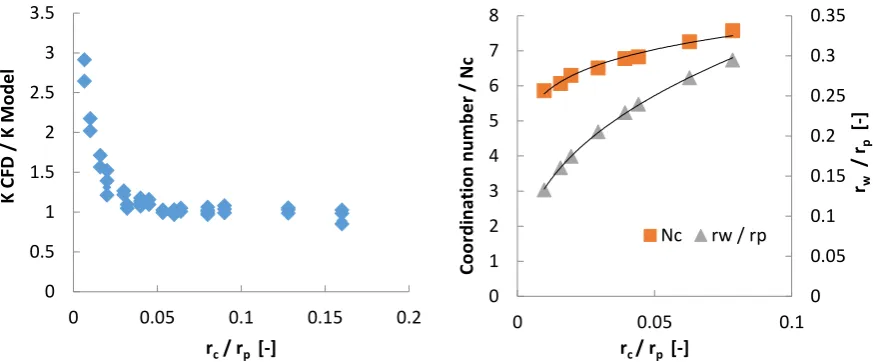
be seen that the window radius more than doubles over the range of capillary radius investigated and that the coordination number increases much more significantly than for the very small change in packing fraction than would be predicted by the Nc expression in Eq 1 (although for constant
capillary radius, changes in porosity lead to increases in coordination number that are consistent with those predicted by Eq 1). If Nc is determined from the porosity alone, using Eq 1 (from [6]), CFD predictions are still in reasonable agreement, overestimating the model by, on average, less than 20%. The model in [6] was found to underestimate experimental data for the permeability of structures made at low pressure (low capillary radius) and it is likely that neglecting the strong effect of capillary radius on the coordination number contributes strongly to this. It should be noted that disagreement between CFD and both the models increases to >50% for large pore sizes and small capillary radii (rc/rp < 0.016) which may indicate that these conditions stretch the capacity for the geometrical
[image:5.595.83.520.253.434.2]construction and smoothing process (reflected by more jagged-edged pores in Figure 2).
Figure 4 Comparison of modelled and CFD predictions for normalised permeability (left) and (right) the influence of normalised capillary radius on structural parameters
For comparison, CFD simulation was performed on a 3D model constructed from a series of 2D CT slices taken of a porous metal made by infiltration of near-spherical beads, 2-2.5 mm in diameter, at 0.9 bar (reported in [4]). From the average window diameter in this structure (180 m [4]), closest agreement with DEM-derived virtual structures is for those generated with capillary radius values between 10 and 20m. K/rp2 for the CT structure was 9.0x10⁻⁴, for equivalent DEM-derived
structures with capillary radius values of 10 and 20m, they were 8.6 and 11.7x10⁻⁴,showing
excellent agreement between flow simulation in real and virtual structures. Experimental
measurement of the permeability in the laminar flow region for this same sample, using a variable head permeameter similar to that used in [6], yielded values of 10.1 ± 0.7 x10⁻⁴ [11], confirming a
good correlation between flow simulation and experimentation.
In conclusion, experimental measurements and CFD modelling of CT images of real structures, demonstrate that the DEM/CFD approach is capable of creating realistic porous metal structures and the accurate modelling thereof. The good correlation between the output from the DEM/CFD process and the analytical models substantiates the “bottleneck” flow concept developed in these models and the resulting high dependence of the permeability on the size of the windows connecting the pores. It also highlights the importance of accurate representation of the coordination number, which is a complex function of several parameters and not easy to measure by microscopy or from CT images, if the analytical models are to be accurate. This approach, with some minor modification to either the DEM step or to the particle data processing in MATLAB, could be extended to model more complex geometries that deviate from monosized, spheres to those that have increased particle contact areas (windows) produced by a compaction step (such as in [5]).
0 0.5 1 1.5 2 2.5 3 3.5
0 0.05 0.1 0.15 0.2
K C FD / K M o d e l
rc/ rp [-]
0 0.05 0.1 0.15 0.2 0.25 0.3 0.35 0 1 2 3 4 5 6 7 8
0 0.05 0.1
Co o rd in ation n u m b e r / N c
rc / rp [-]
Nc rw / rp
rw
/
rp
References
1. R. Goodall, A. Marmottant, L. Salvo, A. Mortensen. Mater. Sci. Eng. A465, (2007) 124-135. 2. J.F. Despois, A. Marmottant, L. Salvo, A. Mortensen, Mater. Sci. Eng. A462 (2007) 68–75 3. R. Goodall, J-F. Despois, A. Marmottant, L.Salvo, A. Mortensen, Scripta Materialia, 54 (2006)
2069-2073.
4. P. Langston, A.R. Kennedy, Powder Technology 268 (2014) 210–218 5. J.F. Despois, A. Mortensen, Acta Materialia 53 (2005) 1381–1388 6. E. L. Furman, A. B. Finkelstein, M. L. Cherny, Metals 3 (2013) 49-57. 7. N. D. Aparicio, A.C.F. Cocks, Acta Metall, 43 (1995) 3873-3884.
8. J-F. Jerier, V. Richefeu, D. Imbault, F-V. Donzé, Computer Methods in Applied Mechanics and
Engineering 199 (2010) 1668–1676
9. A. Jinnapat, A.R. Kennedy, Metals, 1 (2011) 49-64. 10. A. Jinnapat, A.R. Kennedy, Metals, 2 (2012) 122-135.
![Fig 1 Optical micrographs, left of a porous sample made by vacuum casting using near-spherical NaCl beads [4] and right, an X-ray CT image showing the typical pore connectivity](https://thumb-us.123doks.com/thumbv2/123dok_us/8654722.374204/2.595.64.507.72.246/optical-micrographs-porous-casting-spherical-showing-typical-connectivity.webp)