Effect of Modulation Error on All Optical Fiber Current
Transformers
Zhengping Wang, Yuekun Wang, Shuai Sun Science School, Harbin Engineering University, Harbin, China
Email: [email protected]
Received September 14, 2012; revised October 16, 2012; accepted November 17, 2012
ABSTRACT
For actively modulated In-line Sagnac interferential all optic fiber current transformers (AOFCTs), the accuracies are directly affected by the amplitude of the modulation signal. In order to deeply undertand the function of the modulator, a theoretical model of modulation effect to AOFCTs is built up in this paper. The effect of the amplitude of the modula- tion signal to the output intensity of AOFCTs is theoretically formulated and numerical calculated. The results show that the modulation voltage variation could affect the output accuracies significantly. This might be some references on the investigation for practical applications of AOFCTs.
Keywords: Electronic Current Transformer; All Optical Fiber Current Transformer; Faraday Effect; Active Modulation; Modulation Error
1. Introduction
At present, Electronic Current Transformers (ECTs) are widely used in power systems. Comparing with other kinds of ECTs, all optical fiber current transformers (AO FCTs) have been considered mainly for applications in high, ultra high, even high voltages substations. Most of reported articles about AOFCTs were based on the the- ory and technology of fiber optic gyroscope [1,2]. Ordi- nary Sagnac type interferometers have received consi- derable attention for optical fiber current transforming, because of their advantages [3-6] such as: optical fiber loop is located in high voltage area (without any elec- tronic component), so it is easy to solve the problems like high-voltage partial discharge, insulation problems and electromagnetic shielding effectiveness. Moreover, in the high voltage area the elements of AOFCT are small and light [7-8]. In-line configuration [9], which is a kind of improved Sagnac interferometer, is two times more sen- sitive than that of Sagnac loop, substantially reduces the sensitivity to mechanical and thermal disturbances of the leading fibers, and exhibits accurate behavior in current measurement. Some major error sources of AOFCTs like temperature and mechanical perturbations, imperfect quar- ter wave plate, shot noise, performance of scale factor and residual fiber birefringence have already been well discussed [10-15].
According to the Faraday effect, the rotation of the plane of polarization is proportional to the intensity of the applied magnetic field in the direction of light propaga- tion. The Faraday rotation angle F is proportional to
the component of the magnetic field along the propaga- ting direction of the light beam. For a closed optical loop, applying the Ampere’s law, the formula of the Faraday effect can be written as
F VNi
(1) where V is the Verdet constant of the fiber, N is number
of sensing coils and i is the current intensity to induce the
effect. As Faraday rotation angle is very small, it may bring significant difficulties to detect the angle directly in AOFCTs without necessary phase shift. Therefore, it is necessary to add a phase modulator for easier detecting and achieving better accuracies. Accuracies of a few tenths of a percent are required for metering applications of ECT, and much better accuracies are required for cer- tain incipient fault detection applications such as detec- ting the presence of leakage currents. Therefore, a careful analysis respect to modulation errors should be given to show how they affect the current transformers’ perfor- mance.
and sine-modulation [17]. For current transformer, espe- cially those for line protect applications, sine-modulation could much better meet the demand of responsivity.
2. Theoretical Analysis
For In-line AOFCTs, the reference frame (x, y, z) has its x and y axes at 45˚ with respect to the input linear pola-
rization, the HiBi fiber has its birefringence axes parallel to the x and y axes and the orientation of the z axis is gi-
ven by the propagation vector. The layout of an active modulation AOFCT is shown in Figure 1.
The optical vector emerging from the source can be described as E. After being launched into the fiber pola-
rizer, the output light Ein of the polarizer, which will be lunched into the HiBi fiber delay line, can be represented by the Jones vector as
in 1 1 2 E
E (2)
Suppose that the HiBi fiber is an ideal one, which means that no cross coupling arises from one birefrin- gence axis to the other, the Jones matrices for forward and backward propagation of a light beam in the HiBi are the same, which could express by the Jones matrix as
exp 2 0
0 exp 2
l l j f f j (3)
Here the right direction arrow represents forward pro- pagation, and the left one represents backward propaga- tion and is the phase difference between the two modes propagating in the two principal axes of the HiBi fiber, respectively. The principal axes of a quarter wave retarder are connected at a 45˚ angle with respect to that of the HiBi fiber. The Jones matrices of the retarder can be given as
1 1 1 2 j r j
(4.1)
1 1 1 2 j r j (4.2)
For the leading fiber, the use of highly twisted fiber can increase the circular birefringence of the fiber to quench its intrinsic linear birefringence. The circular bire- fringence of the leading fiber is reciprocal, hence the Jones matrices of the leading fiber for forward and back- ward propagation have the same form, which can be ex- pressed as
cos sin sin cos c cf f
(5)
where is the rotation angle induced by the highly
Detector
3dB Coupler
Fiber polarizer HiBi Fiber
[image:2.595.318.531.86.171.2]Sensor head mirror /4 Current-carrying conductor Isolator LED 45° PZT modulator 45° Modulation signal
Figure 1. Layout of the AOFCTs with active modulation technique.
circular birefringence fiber.
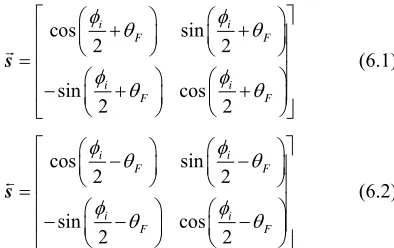
In the sensor head part, the fiber used to compose the sensing coil is the same as the leading one. Thus they have identical Jones matrix representations. Because the Faraday effect is nonreciprocal, its induced term be- comes negative for backward propagation. As the Fara- day effect occurs, the induced extrinsic circular birefrin- gence should superimpose onto the intrinsic one. So the Jones matrix representations for the sensor head could be represented as cos sin 2 2 sin cos 2 2 i i F F i i F F
s (6.1)
cos sin 2 2 sin cos 2 2 i i F F i i F F
s (6.2)
where
i is the rotation angle in the highly twisting circular birefringence fiber.The mirror is represented by the Jones reflection ma- trix
1 0 0 1
m
(7)
The output Eout at the connecting point between the fiber polarizer and the leading part is described as
out f r fl c s m s fc r fl i
E E (8)
By means of Jones matrix manipulation, the result can be shown as
out exp 2 exp 2 2 F F j j j EE (9)
To get the interference between the two orthogonal polarizations at the output, a linear polarizer with its trans- mission axis aligned at 45˚ with respect to the reference axis has to be introduced.
1 1 1
1 1 2 P
[image:2.595.340.537.331.455.2]When the reflected light Eout is launched into the fi- ber polarizer, interference occurs. The interference Et in
the output electrical field form is represented as
out
1 sin 2
1
t P
E E E F
(11)
Without further measures, the detected intensity re- sulting from the interference of the returning waves is given by
0 1 cos 4 F 2
II (12) where I0 E2 and I t t
E E (“+” means Hermitian
operators).
Equation (12) indicates that when the bus current in- tensity is very small, the detecting accuracy would be very small, because of the cosine function. Therefore, it is necessary to add a phase shift to move the working point to the most sensitive position.
PZT is one of the most widely used phase modulator. Under the control of the modulation signal u(t), the
length L and refractive index n of the optical fiber wound
around the PZT will correspondingly change to realize the phase modulate function. The phase variation of the fiber [18] can be written as:
2πn L L L
(13)
where is light wavelength in vacuum, is gauge factor of fiber, and L is the length variation of fiber.
31
2 1
ln 1 1
dp
e E
k d L
u t L r r r A
f (14)
where re
r1r2
2, r1 and r2 are the internal and ex- ternal radius of the PZT, f is the Poisson ratio of fiber,kdp is load coefficient, d31 is piezoelectric strain constant and AE is a constant associate with PZT material. To
analyze the relationship between modulation signal and the detected output optical intensity.
The phase modulation signal could be written as m . Where U0 is the amplitude of the modulation signal and 0
m( ) cos
r t U
t
is the modulation fre- quency. Here it is supposed that the is a constant, because we are only interested in the effect of the U0, although the is changeable with the environment factors. Accordingly, Equation(12) become
0 1 cos 4
2
t t F r
I
IE E t (15) where
0
2 sin sin 2
r r r
m m
t t T t
T U
Ideally, r( )t should equal to
−/2 (means 0
ideal 2 1 sin 4 F I
I ), but it can be seen form the equation that the amplitude of the modulation signal U0, the modulation frequency m and the length of fiber L are the key factors to the output optical inten-
sity. For a given In-line typed optical current transformer, ignoring any other influenced factor, m and L are fixed, so the main factor become U0.
3. Numerical Calculation Results
To assess the effect of the amplitude of the modulation signal on the output, the transformer is assumed that all optical devices used are ideal except the modulator. And only the effect of U0 is taken into consideration. The normalized 01 is used. Then one has
0
ideal 2 1 sin 4 F I
I
and
0
Pract 0, 1 cos 4 2 0cos
2 F m
I
I U t U t
Assuming 2π 58.82 10 rad s3
m , matching the mo-
dulation frequency
m
and the time delay
(means π
2 2 m
T
), then L = 861 m could be obtained.
Take F as an example, the output error of the system is defined as
2
10 rad
0
idealideal
,
100% I U t I
e
I
(16)
Equation (16) has its variable U0 and t. The simula- tion results are plotted in Figure 2 for a fixed voltage
0 5 V
U within the time interval between 20 s and 38
s and Figure 3 at a certain time t = 21.12 s (when
r
(
t
)
achieves –/2 for the modulation voltage of 5 V) with the U0 ranging from 4.9 to 5.1 V.The pattern in Figure 2(a) is predictable form Equa- tion (16) that the output error varies periodically with time
t. Figure 2(b) shows that for a sampling process, the accuracy of the detected signal is such sensitive that dif- ferent sampling time jilter may cause signficant error. Therefore, necessary technical desgn such as peak value preserving circuit should be used.
2 T t
Time t (s) (a)
E
rro
r (
%
)
50
0
-50 100
-100
25 30 35
20
Time t (s) (b)
E
rro
r (%)
27.728 27.729 27.730
27.727
0.2
0
-0.2 0.4
-0.4
27.731
Figure 2. (a) The error for a fixed modulation voltage U0 = 5 V within the time interval between 20 s and 38 s; (b) The de iled ta
view for the dots in the square region of (a) with parallel dash lines representing the up limit of acceptable error percentage (±0.2%, and the corresponding voltages are marked by vertical lines).
Voltage U0 (v)
(a)
E
rro
r (
%
)
2
0
-1 3
-3 1
4.95 5.00 5.05
4.90 5.10 -2
Voltage U0 (v)
(b)
E
rro
r (%
)
0 0.4
-0.4 0.2
4.995 5.000 5.005
4.990 5.010
-0.2
Figure 3. (a) The error induced by modulation voltage shifting from 5 V at the time t = 21.12 s; (b) The detailed view f r the
ation error associated with modu-
be taken into consideration during the design procedures
Faraday Effect Current Sen- sing Using a Sagnac Interferometer with a 3 × 3 Cou-
pler,” Proceed ibreSensors Con-
ference, Sydney . 325-328. o dots in the square region of (a). Two parallel dash lines refers to the maximum error acceptable (±0.2%). Vertical lines indi- cates the corresponding voltages.
arefully designed. c
4. Conclusion
An analysis of modul
lating voltage to the modulator of the AOFCTs has been calculated. The effects of the modulation voltagevaria- tion used in the system on the performance of modulation signal to the AOFCTs have been theoretically analyzed, corresponding numerical calculation results have also been given. The results reported here indicate that even though the active modulation method has many advantages, the stability of the amplitude of modulation signal must still
for those practical applications.
REFERENCES
[1] L. R. Veeser and G. W. Day, “
ings of the 7th Optical F , 2-6 December 1990, pp
[image:4.595.83.516.84.284.2] [image:4.595.82.515.334.537.2]doi:10.1109/50.317541
[3] M. C. Oh, J. K. Seo, K. J. Kim, H. Kim, J. W. Kim and W. S. Chu, “Optical Current Sensors Consisting of Polymeric Waveguide Components,” Journal of Lightwave nology, Vol. 28, No. 12,
2010, pp. 1851-1857.
doi:10.1109/JLT.2010.2049093
[4] V. H. Ortiz, J. L. Flores and G. García-Torales, “A Re- view on Optical Current Transducers for Power System Metering,” Proceedings of Fiber Optic Sensors
plications V, Boston, 10-12 Septem
and Ap-ber 2007, p. 6770181. doi:10.1117/12.735082
[5] P. R. Watekar, S. Ju, S. A. Kim, S. Jeong, Y. Kim and W. T. Han, “Development of a Highly Sensitive Compact Sized Optical Fiber Current Sensor,” Optics Express, Vol. 18 No. 16, 2010, pp. 17096
, -17105.
doi:10.1364/OE.18.017096
[6] I. S. Nikolay, V. R. Maksim, K. C. Yurii, P. G. Vladimir, I. S. Aleksandr, K. M. Sergey and M. K. Nikita, “Inter- ferometric Fiber-Optic Electric Cu
trial Application,” Key Engi
rrent Sensor for Indus- neering Materials, Vol. 437, 2010, pp. 314-318.
doi:10.4028/www.scientific.net/KEM.437.314
[7] Y. N. Ning, Z. P. Wang, A. W. Palmer, K. T. V. Grattan and D. A. Jackson, “Recent Progress in Optical Current Sen- sing Techniques,” Review Science Instruments
No. 5, 1995, pp. 3097-3111. doi:10.1063/1.1145, Vol. 66, 537 [8] Z. P. Wang, Y. K. Wang and S. Sun, “Inquiry about All Fiber-Optic Electronic Current Transformer Technology,” Optics and Optoelectronic Technology, in press.
J. Blake, P. Tantaswadi and R. T. Carvalho, “In-Line
[9] Sag-
nac Interferometer Current Sensor,” IEEE Transactions on Power Delivery, Vol. 11, No. 1, 1996, pp. 116-121. doi:10.1109/61.484007
[10] I. G. Clarke, “Temperature-Stable Spun Elliptical-Core Op- tical-Fiber Current Transducer,” Optics Letters, Vol. 18, No. 2, 1993, pp. 158-160. doi:10.1364/OL.18.000158
[11] J. Blake, P. Tantaswadi and R. T. de Carvalho, “In-Line Sagnac Interferometer Current Sensor,” IEEE Transac- tions on Power Delivery, Vol. 11, No. 1, 1996, pp. 116-
121. doi:10.1109/61.484007
[12] A. H. Rose, Z. B. Ren and G. W. Day, “Twisting and An-
ort, J. U. de Arruda, A. A. Tselikov and J. Blake,
ändle “Tem- nealing Optical Fiber for Current Sensors,” Journal of Lightwave Technology, Vol. 14, No. 11, 1996, pp. 2492- 2498.
[13] S. X. Sh
“Stable Scale Factor Performance of an In-line Sagnac Interferometer Current Sensor,” The 12th International Con- ference on Optical Fiber Sensors, Washington DC, 28-31 October, 1997, pp. 100-103.
[14] K. Bohnert, P. Gabus, J. Nehring and H. Br
perature and Vibration Insensitive Fiber-Optic Current Sensor,” Journal of Lightwave Technology, Vol. 20, No. 2, 2002, pp. 267-276. doi:10.1109/50.983241
[15] R. Wüest, A. Frank, S. Wiesendanger, P. Gabus, U. E.
fect of Temperature
Liu and Y. L. Hao, “Com-
u, Z. Q. Le and D. F. Shen, “Magnetooptics,”
ervision, Inspec- Meier, J. Nehring and K. Bohnert, “Influence of Residual Fiber Birefringence and Temperature on the High-Current Performance of an Interferometric Fiber-Optic Current Sensor,” Conference on Optical Sensors, Prague, 20-22 April, 2009, pp. 73560K1-73560K8.
[16] Y. K. Wang and Z. P. Wang, “The Ef
Characteristic of Faraday Rotator to Passively Demodu- lated All Optical Fiber Current Transformers,” Power System Technology, in press.
[17] Y. X. Zhao, X. Y. Li, C. X.
parative Research in Signal Processing of FOG,” Journal of Chinese Inertial Technology, Vol. 11, No. 2, 2003, pp. 52-56.
[18] G. Q. Li
Shanghai Science and Technology Press, Shanghai, 2001. [19] International Electrotechnical Commission, International
Standard IEC 60044-8, Instrument Transformers, Part 8, Electrical Current Transformers, 2002.
[20] General Administration of Quality Sup