Fluid Flow Characterisation inside the Gap of a
Parallel Disc Device
N. Subaschandar
Department of Mathematics and Statistical Sciences, Botswana International University of Science & Technology, Palapye, Botswana
Abstract: Fluid flow in the gap between the stationary bottom and rotating top discs of an electrochemical Parallel Disc Device (PDD) has been studied here. The smallness of the gap between the discs is a challenge to accurately study the fluid flow in the gap. The two discs of this device, built primarily to study aspects of flow accelerated corrosion, are separated by a small gap. The bottom disc was stationary while the top disc rotated and enabled a flow of liquid between the discs. The PDD was capable of generating very high wall shear rates and the shear of liquid at the working electrode is purely tangential as long as flow between the discs remains laminar. This paper presents results of computations of the fluid flow in the gap between the parallel discs. The computed results were validated against the volume flow rates obtained by experiments.
Keywords: Parallel Disc Device, Flow accelerated corrosion, Wall shear stress, Volume Flow Rate, Computational Fluid Dynamics.
I. INTRODUCTION
In industrial process plants it is often observed that high fluid flow shear rates may result in flow enhanced corrosion of steel surfaces. However, due to the inherent difficulties in measuring corrosion rates in the plant environment we often need to resort to rapid laboratory tests to get an estimate of this important parameter[1]. The generally accepted approach for laboratory corrosion testing in flowing liquids is to use simple geometries that generate predictable flow that can be related to fluid flow in complex plant situations. Common laboratory geometries include the rotating disc, rotating cylinder and the impinging jet technique [1]. Although these techniques can model flow for a wide range of fluid velocities, only rarely do they permit quantitative modelling of plant corrosion rates [2,3]. The obstacles to improving the accuracy of corrosion testing data are inherently a consequence of the very complex nature of turbulent flow. However, there is a real demand for corrosion testing under very severe flow conditions with Reynolds numbers of the order of 107 and wall shear rates as high as 105 to 107 s-1. It has been widely accepted that both wall shear stress and mass transfer coefficient are key parameters when investigating the condition of similarity between laboratory corrosion data and corrosion in the plant environment[4]. In 2005 a Parallel Disc Device (PDD) that allowed the generation of high wall shear rates, while maintaining laminar flow conditions, was reported[5].
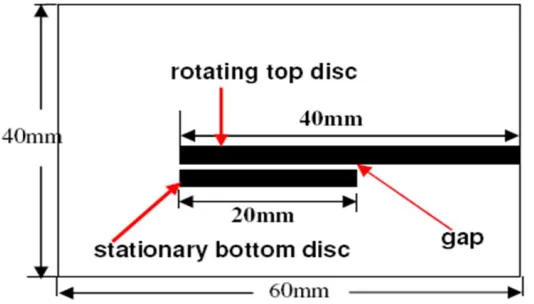
A schematic of the device is shown in Fig.1. The PDD consists of two discs (1 and 2) separated by a precision controlled gap distance, G. The top disc has a diameter of 80mm and it can be rotated by a DC motor capable of speeds up to 10,000rpm through a tooth belt driving a pulley (3). The bottom disc is immobile and incorporates the test (or working) electrode (4). The gap distance can be set by the operator within the range 0.05 to 5.0mm, with an estimated precision of + 0.005mm. This precision is made possible by two coaxial columns (5 and 6) sliding inside each other. Precision nuts (7 and 8) fix the relative position of the columns, which in turn fixes the gap distance. The device assembly is rigidly held together by three support columns (9). In the Fig. 1, the region of interest for the present study also has been highlighted. Also shown in Fig. 1 is the arrangement to measure volume flow rates at different rotation speed(rpm) of the top disc and for different gap distances between the discs.
The Reynolds number for the flow in the gap between the discs (RePDD) with gap width G as characteristic length and the
circumferential velocity at the surface of the rotating disc (
2
r
) as characteristic velocity has been estimated as follows:
r
G
PDD
2
Re
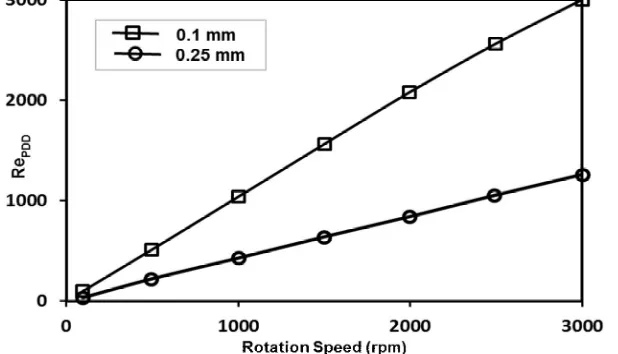
, (1)where r is the radius of the top disc (40mm), is the angular velocity and is the kinematic viscosity of water. Fig. 2 shows RePDD
as a function of rotation speed (rpm) for the gap widths of 0.10mm and 0.25mm. Fig. 2, also, illustrates that at rotation speeds not exceeding 1,500rpm the risk of the onset of the turbulent flow regime in the gap of the PDD is low for both gap dimensions.
Fig. 2 Calculated Reynolds numbers for the PDD as a function of rotation speed for two gap distances, 0.1mm and 0.25mm
Although the use of the parallel disc arrangement is not new in flow accelerated corrosion studies[6,7], fluid flow at the working electrode for the devices developed by other researchers was distinctly turbulent. The device presented here has laminar flow in the gap between the discs and it is this feature that makes it unique. In the present study fluid flow characterisation inside the gap of the PDD has been carried out using computational fluid dynamics method. In this paper key aspects of the computational fluid dynamics (CFD) characterisation of the PDD as well as the results of some electrochemical investigations conducted with this device are presented.
II. EXPERIMENTAL DATA
[image:2.612.154.463.188.365.2]In order to validate the computational results, a relatively simple arrangement was used to determine actual fluid volume flow rates through the gap(corresponding to the radial component of flow) for comparison. This simple arrangement has, also, been shown in Fig. 1. A funnel and tube was attached to the underside of the bottom disc. Water was drawn from the feed vessel on the left(A), through the gap between the discs, by the suction generated when the top disc rotates. Water then overflowed from the main vessel into another container on the right(B). By timing the addition of a known volume of water to the feed vessel, so that its level was kept constant and the same as the main vessel, liquid volume flow rates through the PDD were able to be calculated. The volume flow rate data thus obtained at different rotational speeds is used to validate the computational model.
III. COMPUTATIONAL STUDY
The object of investigation of this paper is the steady flow of viscous fluid between two parallel disks, one stationary and the other rotating, where the fluid enters the gap in an axial direction and emerges at the outlet at the edge of the discs(Fig. 1). It should be noted here that the present problem differs from the celebrated Von Karman problem and its generalization since the present study investigated the swirling flow induced by the rotation of infinite discs [9]. In the context of application in the design of centrifugal pumps, Breiter and Pohlhausen[10], studied a problem which was similar to the present study. From the linearized boundary layer approximations of Navier-Stokes equations they derived the analytical expressions for velocity components and pressure showing that the solution depends on kinematic viscosity, angular velocity and the distance between the disks. They also provide a numerical solution of the non-linearized equations using the finite difference method with constant inlet profile. This line of research was continued by Rice and coworkers, whose main goal was the prediction of the performance of a centrifugal pump/compressor. They used different methods to obtain velocity and pressure distribution of flow between two disks. Rice [11] studied the flow with equations derived by using hydraulic treatment of bulk flow. Boyd and Rice [12] used the finite difference method to calculate velocity and pressure for various parabolically distributed inlet velocities. Boyack and Rice [13] used what they called the integral method, in which the velocity components are represented by a polynomial of the axial coordinate. Another line of research of the so called laminar source-sink flow in a rotating cylindrical cavity originated with the analytical study by Hide[14] who gave the approximate asymptotic expressions for velocity components using the boundary-layer technique. Numerically, by using the finite-difference method, the problem was solved[15]. Owen et al [16] used the integral-momentum of Von Karman that extended Hide's linear approximation to the turbulent flow. Recently, the steady flow between rotating disks was included in the study by Crespo del Arco et al [17] using a pseudo-spectral numerical method. From the above brief review of literature it is clear that the problem is analytically and especially numerically well studied and the results of calculations are in agreement with experiments. However, all available analytical solutions are based on variants of approximation. In this article, an alternative analytical solution will be presented, which is based on the asymptotic expansion of unknown functions by a method similar to those of Savage [18], who considered the stationary radial directed flow between steady disks. Subaschandar et al [19] presented preliminary results of this computational study of a simpler geometrical configuration of a PDD. The present study is a more exhaustive extension to the work of Subaschandar et al [19], giving additional results.
IV. BASIC EQUATIONS
Here a steady axisymmetrical isothermal flow of incompressible viscous fluid between two co-rotating disks in the absence of body force is considered. Since modelling the whole geometry shown in Fig. 1 requires huge computational resources and computational time, a simple computational domain, which focuses on the flow between the gaps between the stationary bottom disc and rotating top disc, has been chosen in two dimensions. The computations have been carried out assuming axisymmetry of the flow. A schematic of the computational domain in two-dimensional space, for a PDD, is presented in Fig. 3. For description of flow, the reference frame rotating with angular velocity Ω is used. In this frame, by using the cylindrical coordinate system with coordinates r and z, the continuity equation and Navier-Stokes equations , for an axisymmetric flow, have the form given in [20,21]:
0
1
z
w
ru
r
r
(2)
2 2 2 2 2 21
1
2
z
u
r
u
r
u
r
r
u
r
p
u
r
v
z
u
w
r
u
u
(3)
2 2 2 2 21
2
z
v
r
v
r
v
r
r
v
u
r
uv
z
v
w
r
v
u
(4)
2 2 2 21
1
z
w
r
w
r
r
w
z
p
z
w
w
r
w
u
(5)
Fig. 3 A schematic diagram of the computational domain for the PDD
V. COMPUTATIONAL DETAILS
The modelling for this study was done using the commercially available CFD software ANSYS FLUENT ver. 16. For the single rotating disc the computational domain was set up as a three-dimensional model and is not shown here. A two-dimensional axisymmetric model was developed to avoid the vast computing resources required for the whole PDD geometry. ANSYS FLUENT Ver 16 was used to construct and mesh the computational domain for both the RDE and the PDD. The computational model for the RDE is similar to that for the PDD, except for the fact that the RDE had no bottom disc and that it was constructed in a three-dimensional domain. The geometries constructed for the present CFD analysis are simplified models of the actual geometries. For the PDD, the rotational speed was varied from 100 rpm to 1600 rpm and the gap distance(G) between the discs was varied from 0.025mm to 0.25mm. The computational domain for the RDE had approximately 340,000 nodes, while the number of nodes varied between 200,000 and 500,000 in the gap distance range considered in this study. Water was used as the working fluid and the flow was assumed to be laminar. Grid independence study was carried out for the RDE geometry. Computations were carried out with three mesh sizes, namely, 280000, 340000 and 370000 nodes in the computational domain. The velocity profiles did not show any significant differences between computations using mesh sizes of 340000 and 370000 nodes. Hence it was decided to carry out further computations with a mesh size of 340000 nodes and use the same values for the parameters to generate mesh for all other geometries studied here.
VI. RESULTS AND DISCUSSION
A. Single Rotating Disc Electrode (RDE) Modelling
A three-dimensional model was generated for this well characterized system. Fig. 4 compares the computed velocity components with the analytical von Karman solution [8]. The excellent agreement between the computational and analytical solutions validates the model used. The velocity components computed using CFD method (open symbols) are compared to the von Karman mathematical solution (solid line) for a single rotating disc for the non-dimensional radial velocity, the non-dimensional circumferential velocity and the non-dimensional axial velocity. The horizontal axis represents a non-dimensional distance
[image:4.612.174.441.77.229.2][=y√(ω/ν)] from the bottom disc (Y-axis is normal to the disc surface for this three-dimensional model).
Fig. 4 Computed velocity components compared to the Von Karman mathematical solution for a single rotating disc. The horizontal axis represents a non-dimensional distance from the disc (y-axis is normal to the disc surface, for this three-dimensional
B. Parallel Disc Device(PDD) Modelling
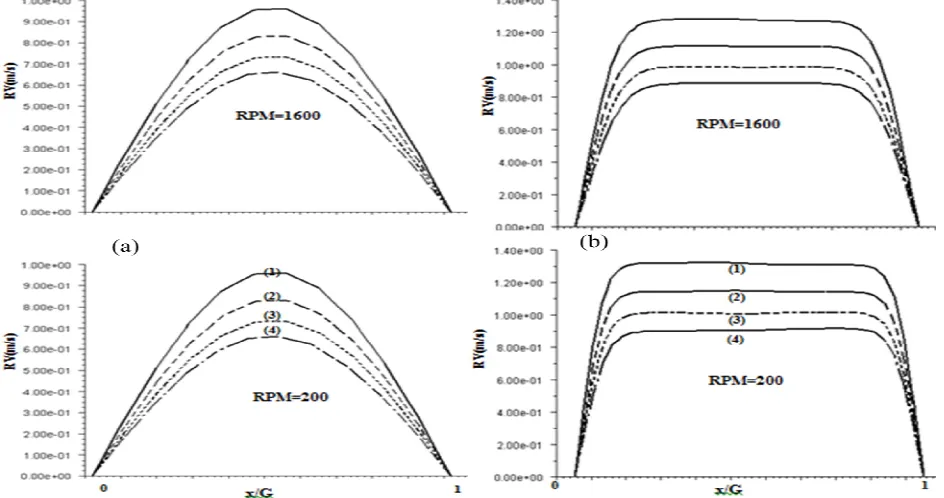
[image:5.612.72.544.134.383.2]Flow within the gap between the discs exhibited complex behaviour. Figs. 5 presents the profiles of radial velocity at 4 radial stations inside the gap for two gap distances, namely 0.025mm and 0.25mm. The profiles are presented at four radial stations of y/R=0.55,0.65,0.75 and 0.85.
Fig. 5 Variation of Radial Velocity (RV in m/s) in the gap between discs, (a) G=0.025 mm and (b) G= 0.25mm. x/G=0 -Bottom(Stationary) surface; x/G=1–Top(Rotating) Surface. Curves: (1)–y/R=0.55; (2)-y/R=0.65; (3) - y/R=0.75; (4) - y/R=0.85
A contour plot of the velocity magnitude in the computational domain for a gap distance of 0.25mm and a rotational speed of 1000 rpm is shown in Fig. 7. Instability can be observed near the outer rim on the top surface of the rotating disc (this result was also observed experimentally).
Fig. 7 Contours of velocity magnitude (m/s) in the PDD computational domain. G = 0.250 mm and rotation speed =1,000 rpm.
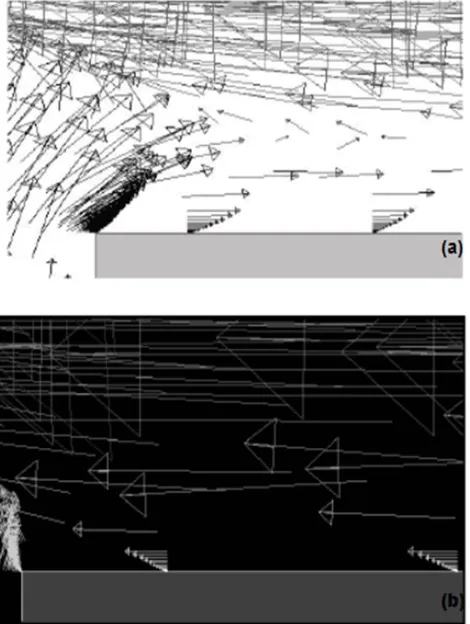
[image:6.612.190.425.365.677.2]Similar flow patterns were observed for a PDD with other gap distances at the rotational speed of 1000 rpm. Fig 8 shows the velocity vectors inside the gap and near the outer edge of the discs for the gap distances of 0.25mm and 0.100mm. This refers to a small, approximately 20 and 50 m wide regions, close to the stationary disc for gap distances 0.100 mm and 0.250mm respectively. From the Fig. 8(a) it can be seen that for a gap distance of 0.25mm there is a reverse flow region existing on the surface of the stationary disc close to the outer edge of the disc, while for the gap distance of 0.1mm the reverse flow has been eliminated(Fig. 8(b)). The elimination of reverse flow was observed to occur gradually from a gap distance of 0.25mm to 0.100mm gap distance.
Fig. 9 Comparison of computed non-dimensional radial component of velocity(open circles) with Von Karman Solution (solid line), inside a gap of 0.25mm and at a rotational speed of 1000 RPM. The horizontal axis represents a non-dimensional distance
from the disc. (Y-axis is normal to the disc surface). Insert : profiles within the close vicinity of the rotating disc.
[image:7.612.171.442.82.255.2]In Fig. 9 the computed profile of radial velocity is compared with von Karman’s solution[8] for a PDD. This velocity profile is presented for the PDD with a gap of 0.25mm and a rotational speed of 1,000rpm. The data was taken at a location near the midsection of the lower disc. Since similar agreement was observed for the circumferential velocity component, only the results for the radial component are presented here. In the present study, similar behaviour of radial component of velocity was observed for the gap distances and rotational speeds in the ranges studied here. As can be seen from the insert of Fig. 9, the agreement is good within the close vicinity of the rotating upper disc. At the same time, at greater distances from the top disc, the computed velocity profile deviates markedly from von Karman’s solution due to the influence of the stationary bottom disc.
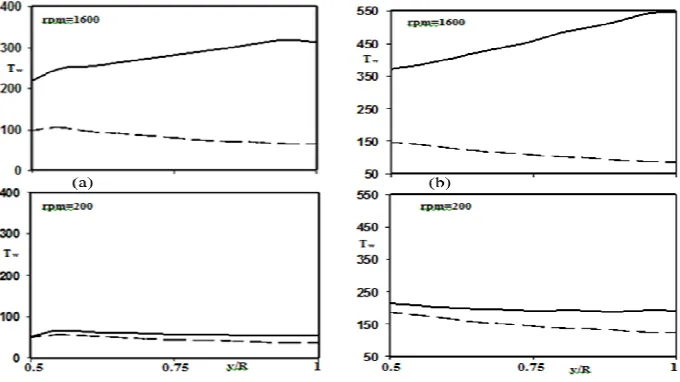
Fig. 10 shows the dependence of computed wall shear stress with distance from the centre of rotation at the bottom surface of the top disc and the upper surface of the immobile bottom disc. The results are presented for 0.25mm and 0.025mm gap distances and at rotational speeds of 200rpm and 1600rpm. From the Fig. 10, it can be seen that the wall shear stress values are higher on the stationary bottom disc than on the rotating top disc. The differences in the values of wall shear stress on both surfaces, for the same gap distance, increases as the rotational speed increases. Fig. 10 shows, also, that as the gap distance is increased the differences in the wall shear stress values on both surfaces increase, for the same rotational speed.
Fig. 9 Variation of wall shear stress(Tw in pascals) on the surfaces (a) G=0.025mm and G=0.25 mm).
[image:7.612.137.477.498.689.2]These results were observed for all gap distances in the range of rotational speeds studied here. These results supported the initial assumption that the PDD can generate high wall shear stress values and that placement of electrode on the stationary bottom disc is justified. The formation of flow instabilities at the wall of a single RDE has been noted by other researchers. For example, Poulson [22] proposed that, for a rotating disc electrode, above a critical Re, a central laminar region may be surrounded by transition and turbulent zones where mass transfer will be increasing with increasing radial distance. The three-dimensional model of a single RDE described above, revealed a similar tendency towards the formation of flow instabilities as shown in Fig. 11.
[image:8.612.175.440.197.387.2]The CFD model was validated experimentally by measuring the liquid volume flow rates for the PDD as a function of rotation speed at various gap distances. Fig. 12 gives a comparison of the CFD data and the experimentally determined volume flow rate values. Experimental points were averages of 8 readings.
Fig. 11 Dependence of computed wall shear stress with distance at the Rotating Disc Electrode(RDE) [radius=40mm, rotational speed = 1000rpm] as predicted by the three-dimensional model
The volume flow rates were calculated at the exit end of the gap. Agreement was reasonable considering the simplicity of the computational geometry. This provided a fair degree of validity to the two-dimensional axisymmetric CFD model and the data generated in this study.
[image:8.612.144.472.475.707.2]VII. ELECTROCHEMICAL STUDY
To evaluate the performance of the PDD for electrochemical measurements the reduction of dissolved oxygen at the copper electrode has been studied:
O2(aq) + 4e + 2H2O (liq) = 4OH-(aq)
[image:9.612.153.460.159.310.2]A detailed description of the methodology of this study has been already reported [23]. The data relevant to the gap widths of 0.10mm and 0.25mm are presented here.
Fig. 13 Cathodic “current density–potential” curves for the PDD at selected rotation speeds for the gap distance of 0.100mm. The potential difference(E) is measured with respect to saturated calomel electrode(SCE). Rotation speeds (rpm) are shown for each
curve.
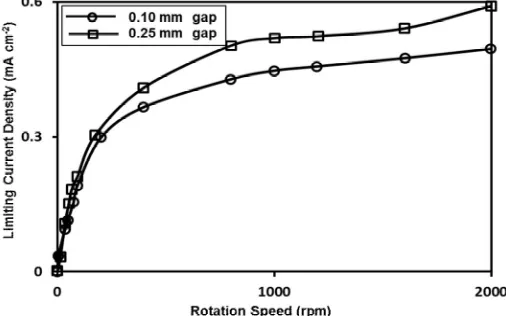
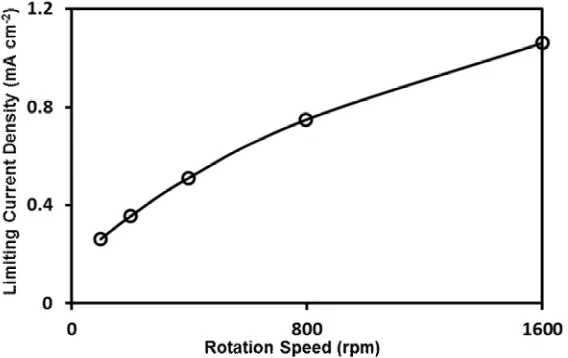
The PDD working electrode was made from 99.90% copper with an internal diameter of 51mm and an outer diameter of 74mm. The same electrochemical system was studied with a copper Rotating Disc Electrode (RDE) of diameter 7mm, embedded in a cylinder of epoxy resin with an outer diameter of 15mm. A selection of “current density-potential” curves at various rotation frequencies for gap distance of 0.10mm of the PDD are shown in Fig. 13. The variation of limiting current density with rotation speed for the PDD is provided in Fig. 14 and a similar representation of the data obtained for the RDE is shown in Fig. 15. For both devices the rotation speed was varied over the range 0 to 2,000rpm.
A CFD model that incorporates the mass transfer of dissolved oxygen is needed to thoroughly analyse the presented electrochemical data. This is an objective of our future studies. At this stage, it is possible only to qualitatively describe the trends observed. Additionally, the comparison of data obtained with different geometries (PDD and RDE) allows us to make some conclusions on the PDD performance. It is generally accepted that the limiting diffusion current is directly proportional to the mass transfer coefficient and independent of the electrode potential[24]. In turn, the mass transfer coefficient for laminar flow is directly proportional to U00.5
and inversely proportional to L0.5 (where U0 is the bulk flow velocity; and L is the length of diffusion, or, in other words, the
dimension of the working electrode measured along the flow direction) [24]. For the purpose of this qualitative analysis it is reasonable to assume that for the PDD the mass-transfer coefficient is determined by the radial velocity component only.
[image:9.612.179.432.552.710.2]The validity of this assumption can be explained as follows. At zero radial velocity, but non-zero circumferential velocity, the mass-transfer of oxygen to the electrode is not possible, since there will be no renewal of liquid at the electrode surface. Hence, after a short time the solution at the electrode surface will be totally depleted of dissolved oxygen. For the RDE delivery of fresh solution to the electrode surface is additionally facilitated by the axial component of the flow velocity, which does not exist in the gap of the PDD. Thus, the trends in the variation of limiting diffusion current seen in both Fig. 13 and Fig. 14 may be interpreted by consideration of the behaviour of both radial and axial velocities for both devices.
Fig. 15 Variation of limiting current density with rotation speed for the RDE
The radial velocity within a 0.25mm gap of the PDD is substantially decreased by the proximity of the immobile disc, compared with radial velocity near the surface of the RDE [Fig.8]. For a 0.10mm gap this decrease is expected to be even more pronounced, since flow rate is lower for the smaller gap. From a comparison of the curves plotted in Figs 13 and 14 it is possible to emphasize the following: the values of the limiting current density for the RDE were about two times greater than the relevant values for the PDD, the limiting current density curves for the PDD were much steeper in the range of angular velocities from 0 to 400rpm. The lower values of the limiting current density for the PDD are likely to be caused by differences in both radial and axial velocities in the vicinity of the working electrode. Another contributing factor is the substantially longer diffusion paths for the PDD (appreciably larger than those for the RDE). The steepness of the limiting current density curves for the PDD, and the lower values of current density at low rotation speeds, may be attributed to the absence of the axial velocity component near the electrode surface of the PDD. For the PDD fresh solution can be only be delivered to the internal rim of the electrode, while for the RDE there is an axial flux of fresh solution approaching the entire electrode surface. Higher values of limiting current density observed for a 0.25mm gap compared to those for a 0.10mm gap can be easily explained by greater values of the radial velocity within the larger gap. This was experimentally confirmed by the flow rate measurements displayed in Fig. 11. At the same time, the downward trend visible at the right-hand side of the curve for a 0.25mm gap may be attributable to the occurrence of reversed flow as revealed by the CFD model. For the RDE the limiting current density is proportional to 0.5
, as long as flow in the device is laminar [24]. To estimate the range of validity of laminar flow at the RDE a simple flow-visualisation experiment was conducted with the RDE cell. Flow was visualised using 50m polystyrene particles and light-sheet illumination generated by a laser. It was observed that laminar flow patterns were distorted by the occurrence of vortices when the rotation speed of the RDE exceeded 600rpm. At the same time, the CFD model demonstrated that there were no flow instabilities either for 0.10mm or for 0.25mm gap between the parallel discs, except for 5mm long region showing flow at the outlet for a 0.25mm gap.
VIII. CONCLUSIONS
CFD modelling analysis of simplified geometries of both the PDD and the RDE has been carried out. Velocity components for the RDE compare well with theoretical solution. For the PDD the velocity components in the gap agreed reasonably well with the von Karman solution at close proximity to the rotating disc. Reverse flow was observed in the gap near the outer edge of the discs of the PDD for a gap distance of 0.25mm. The reverse flow reduced gradually as gap distance is reduced. It was observed that a slight modification to the geometry eliminated the reverse flow for all gaps and at rotational speeds studies here. For the PDD, the values of wall shear stress are higher on the stationary bottom disc than on the rotating top disc, justifying the placement of the electrode on the stationary bottom disc. For the PDD the difference in the wall shear stress at the rotating disc and the stationary disc was reduced as the gap is reduced. The computed volume flow rates of fluid for the PDD agree reasonably well with measured values. The electrochemical study has confirmed that the PDD can develop higher wall shear stresses than the RDE while maintaining laminar flow conditions.
IX. ACKNOWLEDGMENTS
Author acknowledges the support provided by the Department of Mathematics and Statistical Science, BIUST in this research. Author acknowledges many discussions with Dr. Alex Deev.
REFERENCES
[1] Roberge, P., (2004) ,Erosion-Corrosion, NACE International.
[2] ASTM G 170-01a,(2003), Standard Guide for Evaluating and Quantifying Oilfield and Refinery Corrosion Inhibitors in the Laboratory, ASTM International. [3] Papavinasam, S., Revie, R. W., Attard, M., Demoz, A. & Michaelian, K., (2003), Comparison of laboratory methodologies to evaluate corrosion inhibitors for
oil and gas pipelines, Corrosion, 59(10), 897-912.
[4] Silvermam, D.C., (2004), The Rotating Cylinder Electrode for Examining Velocity-Sensitive Corrosion-A Review, Corrosion, 60, 1003-1023.
[5] Deev, A., Connor, J.N., Clegg, R., Hoare, G & Druskovich, D., (2005), A Rotating Parallel Disc Device for Corrosion Studies, Corrosion and Prevention Conference Proceedings, Australasian Corrosion Association, paper 043.
[6] Tarantseva, K. P.; Pakhomov, V. S. (1997), Primenenie sistemy dvuh diskov dlia issledovaniia pittingovoi korrozii stalei v dvizhushchihsia hloridsoderzhashchih sredah (Use of double-disk systems to study pitting corrosion of steel in moving chloride-containing media). Khimicheskoe i Neftegazovoe Mashinostroenie, (4), 74-76.
[7] von Heil, K., Heitz, E., Weber, J., (1981), Versuchsanlage fuer erkstoffuntersuchungen bei hohen Stroemungsgeschwindigkeiten (Apparatus for testing materials at high flow speeds), Materialpruefung, 23 (5), 166-170.
[8] von Karman, T., (1921), On Laminar and Turbulent Friction. Zeitschrift f'ur Angewandte Mathematik und Mechanik, 1: p. 233-252. [9] Rajagopal, K.R., (1992), Flow of Viscoelastic Fluids Between Rotating Disks., Theoretical and Computational Fluid Dynamics 3, 185-206 [10] Breiter, M.C. and Pohlhausen, K., (1962), Laminar Flow Between Two Parallel Rotating Disks, ARL, USAF, Dayton, Ohio
[11] Rice, W., (1963), An Analytical and Experimental Investigation of Multiple Disk Pumps and Compressors. Journal of Engineering for Power, Trans. ASME, 191-198.
[12] Boyd, K.E. and Rice, W., (1968), Laminar Inward Flow of Incompressible Fluid Between Rotating Disks, with Full Peripheral Admission, J. App. Mech., Trans. ASME, pp. 229-237
[13] Boyack, B.E. and Rice, W., (1971), Integral Method for Flow Between Co-rotaning Disk, J. Basic Eng., Trans. ASME, 350-354 [14] Hide, R. (1968), On Source-Sink Flows Stratified in a Rotating Annulus. J. Fluid Mechanics, 32, 737-764
[15] Bennetts, D.A. and Jackson, W.D.N., (1974), Source-sink Flows in a Rotating Annulus–A Combined Laboratory and Numerical Study. J. Fluid Mech., 66, 689-705
[16] Owen, J.M., Pincombe, J.R., Rogers,R.H., (1985), Source-sink Flow Inside a Rotating Cylindrical Cavity. Journal of Fluid Mechanics 155, 233-265
[17] Crespo del Arco, E., Maubert, P., Randriamampianina, A. and Bontoux, P., (1996), Spatio Temporal Behaviour in a Rotating Annulus with a Source-Sink Flow. J. Fluid Mech., 32, 1-27
[18] Savage, S.B., (1964), Laminar Radial Flow Between Parallel Plates, J. App. Mech.,Trans. ASME, 594-596
[19] Subaschandar, N., Connor, J.N., Deev, A.V., McNeilly, I.R. and Druskovich, D.,(2007), A Parallel Disc Device for studying corrosion under intense flow conditions, 16th Australasian Fluid Mechanics Conference, Gold Coast, QLD, Australia, Dec 2-7.
[20] Acheson, D.J., (1990). Elementary Fluid Dynamics. Oxford University Press
[21] Landau, L.D., Lifshitz, E.M., (1987). Fluid Mechanics, 2nd edition, Butterworrth-Heineman
[22] Poulson, B., (1983), Electrochemical measurements in flowing solution, Corrosion Science, 23(4), 391-430
[23] McNeilly, I.R., Connor, J.N., Deev, A., Clegg, R.& Druskovich, D., (2006), Electrochemical Characterisation of the Parallel Disc Device, Corrosion and Prevention Conference Proceedings, Australasian Corrosion Association, paper 031.
![Fig. 11 Dependence of computed wall shear stress with distance at the Rotating Disc Electrode(RDE) [radius=40mm, rotational speed = 1000rpm] as predicted by the three-dimensional model](https://thumb-us.123doks.com/thumbv2/123dok_us/1252687.652266/8.612.144.472.475.707/dependence-computed-distance-rotating-electrode-rotational-predicted-dimensional.webp)