http://wrap.warwick.ac.uk/
Original citation:
Fan, Xijian and Tjahjadi, Tardi. (2015) A spatial-temporal framework based on histogram
of gradients and optical flow for facial expression recognition in video sequences.
Pattern Recognition, 48 (11). pp. 3407-3416.
http://dx.doi.org/10.1016/j.patcog.2015.04.025
Permanent WRAP url:
http://wrap.warwick.ac.uk/71508
Copyright and reuse:
The Warwick Research Archive Portal (WRAP) makes this work of researchers of the
University of Warwick available open access under the following conditions. Copyright ©
and all moral rights to the version of the paper presented here belong to the individual
author(s) and/or other copyright owners. To the extent reasonable and practicable the
material made available in WRAP has been checked for eligibility before being made
available.
Copies of full items can be used for personal research or study, educational, or
not-for-profit purposes without prior permission or charge. Provided that the authors, title and
full bibliographic details are credited, a hyperlink and/or URL is given for the original
metadata page and the content is not changed in any way.
Publisher statement:
© 2015 Elsevier, Licensed under the Creative Commons
Attribution-NonCommercial-NoDerivatives 4.0 International
http://creativecommons.org/licenses/by-nc-nd/4.0/
A note on versions:
The version presented here may differ from the published version or, version of record, if
you wish to cite this item you are advised to consult the publisher’s version. Please see
the ‘permanent WRAP url’ above for details on accessing the published version and note
that access may require a subscription.
Spatial-Temporal Framework based on Histogram of Gradients and Optical Flow for Facial
Expression Recognition in Video Sequences
Xijian Fan, Tardi Tjahjadi
School of Engineering, University of Warwick Gibbet Hill Road, Coventry, CV4 7AL, United Kingdom.
Abstract
Facial expression causes different parts of the facial region to change over time and thus dynamic descriptors
are inherently more suitable than static descriptors for recognising facial expressions. In this paper, we
extend the spatial pyramid histogram of gradients to spatio-temporal domain to give 3-dimensional facial
features and integrate them with dense optical flow to give a spatio-temporal descriptor which extracts both
the spatial and dynamic motion information of facial expressions. A multi-class support vector machine
based classifier with one-to-one strategy is used to recognise facial expressions. Experiments on the CK+
and MMI datasets using leave-one-out cross validation scheme demonstrate that the integrated framework
achieves a better performance than using individual descriptor separately. Compared with six state of the
art methods, the proposed framework demonstrates a superior performance.
Keywords: histogram of gradients, facial expression, optical flow, feature extraction.
1. Introduction
The automated recognition of facial expressions has been a widely researched topic in recent years due to
its wide range of applications such as surveillance, human-computer interaction and data-driven animation.
Other motivations include advancements in related research in face detection [1], tracking and recognition
[2], as well as new developments in feature extraction algorithms and machine learning [3]. Six prototypical
facial expressions were first formalised in [4], namely anger, disgust, fear, happiness, sadness and surprise.
Although much progress has been made since then, accurate recognition of facial expressions is still a
challenging problem due to the subtlety, complexity and variability of facial expressions [5, 6].
Most existing works on facial expression recognition focus on analysing and extracting facial features in a
single image or one frame in an image sequence, i.e., recognition of static expression. Previous methods have
mainly concentrated on attempting to capture expressions through either action units [5, 7] or via discrete
frame extraction techniques [8]. All of these methods require either manual selection of facial features in
order to determine where the particular changes in the facial region occur, or the subjective thresholding
for feature selection. This means that any classification is highly dependent on subjective information in
A facial expression involves a dynamic process, and the dynamic information such as the movement
of facial landmarks and the change in facial shape contains useful information that can represent a facial
expression more effectively. Thus, it is important to capture such dynamic information so as to recognise
facial expressions over the entire video sequence. Previous recognition methods on video sequences tend to
only focus on the movement of facial landmarks, not analysing the variation of facial shape. In this paper, we
utilise two types of dynamic information to enhance the recognition: a novel spatio-temporal descriptor based
on the Pyramid Histogram of Gradients (PHOG) [9] to represent changes in facial shape, and dense optical
flow to estimate the movement (displacement) of facial landmarks. We view an image sequence as a
spatio-temporal volume, and use spatio-temporal information to represent the dynamic movement of facial landmarks
associated with a facial expression. In this context, we extend PHOG descriptor representing spatial local
shape to spatio-temporal domain to capture the changes in local shape of facial sub-regions in the temporal
dimension to give 3-dimensional (3D) facial component sub-regions of forehead, mouth, eyebrow and nose.
We refer this descriptor as PHOG Three Orthogonal Planes (PHOG TOP). By combining PHOG TOP and
dense optical flow of the facial region, we exploit the fusion of discriminant features for classifying and thus
recognising facial expressions.
The main contributions of this paper are: (a) a framework that integrates the dynamic information
extracted from variation in facial shape and movement of facial landmarks; (b) PHOG TOP 3D facial
features; (c) a means of fusing weighted PHOG TOP with dense optical flow; and (d) an analysis on the
contribution of different facial subregions using the proposed framework.
This paper is organised as follows. Previous related work is presented in Section 2. Section 3 presents
PHOG TOP, the dense optical flow descriptor, and the fusion of these descriptors. The proposed facial
expression recognition framework and the experimental results are respectively presented in Section 4 and
Section 5. Finally, Section 6 concludes the paper.
2. Related Work
There are two main approaches to recognising facial expressions: (1) recognition based on facial action
coding system (FACS) [10] action units (AUs); and (2) direct content-based recognition (non-AU). The
weakness of the AU based approach is that errors in the AU classification affect the recognition rate. Thus,
the framework proposed in this paper adopts the non-AU approach.
A typical facial expression recognition system comprises three modules: image pre-processing, facial
feature extraction, and facial expression classification. The feature extraction module is important and
thus numerous methods for facial features extraction have been proposed. These methods can either be
appearance-based or geometric-based methods. The features extracted using either approach should
In the appearance-based approach, transformations and statistical methods are used to determine the
feature vectors that represent textures and are thus simple to implement. Gabor wavelets [11] and local
binary patterns (LBPs) [12] are two representative feature vectors of such approach that describe the local
appearance models of facial expressions. Gabor magnitudes are commonly adopted as features as they
are robust to misalignment of corresponding image features. However, computing Gabor filters has a high
computational cost, and the dimensionality of the output can be large, especially if they are applied to a wide
range of frequencies, scales and orientations of the image features. The LBP descriptor is a histogram where
each bin corresponds to one of the different possible binary patterns representing a facial feature, resulting
in a 256-dimensional descriptor. However, it has been shown that some of the patterns are more prone
to encoding noise. The most popular LBP is the uniform LBP [13]. Zhao and Pietikainen [14] proposed
a method which extends LBP to spatio-temporal domain so as to utilise the dynamic information, which
results in a significant improvement in the recognition rate. One drawback of appearance-based approach
is that it is difficult to generalise appearance features across different persons.
In the geometric-based approach, shape and position information of facial landmarks or region are
extracted to represent the face geometry [11, 15, 16, 17]. For example, the method in [11] uses the geometric
position of 34 fiducial points as facial features to represent the face geometry. In image sequences, optical flow
analysis has been applied to detect the movements of facial components which are qualified by measuring
the geometric displacement of facial feature points between two consecutive frames [18, 19]. Although
geometric-based methods are sensitive to noise, and require accurate tracking of facial features, geometric
features alone can provide sufficient information for efficient recognition of facial expressions.
Histogram of gradients (HOG) [20] was originally developed for person detection and object recognition.
In [21], HOG descriptors are extracted from face image using a dense grid, and are used for face recognition.
The PHOG proposed in [9] is an extension of HOG and is used to represent the local shape of facial region.
However, all these methods only analyse individual frames of a video sequence, i.e., not taking the dynamics
of a facial expression into account.
Many techniques have been proposed for classification of facial expressions. Support vector machines
(SVM) [7] classifier has been shown to be effective in recognising different expressions. Though new kernels
have been presented, the linear, polynomial and Radial Basis Function (RBF) kernels are the most widely
used.
3. Dynamic Features
Our framework uses dynamic features. This takes the form of PHOG TOP and dense optical flow,
3.1. PHOG TOP descriptor
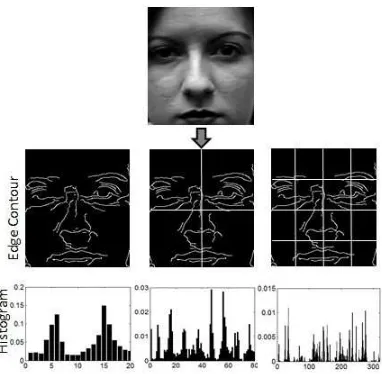
PHOG [9], originally designed for object classification, contains the local shape information of an
im-age and spatial layout of this shape. This descriptor was inspired by HOG [20] and the imim-age pyramid
representation [22]. In essence, the PHOG is a descriptor based on edge information. More specifically,
edge contours of an image are extracted at different pyramid resolution level, and occurrences of gradient
orientation of edges are counted to construct a gradient histogram. The PHOG descriptor is obtained by
concatenating the histograms from selected pyramid levels. An example of a PHOG descriptor of a face is
[image:5.595.200.391.265.452.2]shown in Fig. 1.
Figure 1: PHOG descriptor of a face.
Facial expression is usually performed dynamically, thus its dynamic information is essential for its
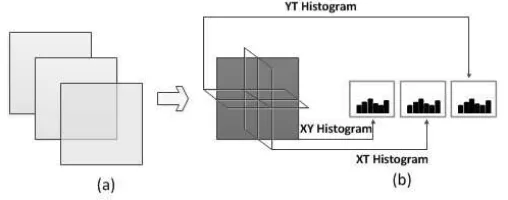
recognition. Motivated by the temporal extension of LBP [12], we propose a spatial-temporal descriptor
by concatenating the PHOG of three orthogonal planes XY, XT and YT to give PHOG TOP, taking into
account the co-occurrence statistics in these three planes. The XY plane is used to extract the local spatial
information, and the XT and YT planes are used to extract temporal information. We consider a video
sequence as a stack of XY slices in the temporal dimension, and similarly for XT and YT slices but in the
Y and X dimensions, respectively. The spatio-temporal PHOG over each slice in three orthogonal axes (i.e.,
XY PHOG, XT PHOG, and YT PHOG) are separately obtained and then combined. Take XY PHOG for
instance, we compute PHOG descriptor in every single image from a video sequence, i.e., along the temporal
axis. First, the Canny edge detector is employed to capture the edge information. The image region is
divided into a set of spatial grid by repeatedly doubling the number of divisions along each axis. Thus, the
grid at resolution levell has 2lcells along each dimension.
Gaussian smoothing, as the smoothing decreases the performance of classification [9]. The histogram of edge
orientations within an image sub-region is quantized into K bins, whereK is set to 20 as in [9]. In order
to reflect the contribution of each edge, a weight proportional to its magnitude is added. Each bin in the
histogram represents the occurrences of edges that have orientations within a certain angular range. We use
the range [0, 360] to take into account all orientations. The PHOG descriptor for a slice (image) is obtained
by concatenating all the vectors at each pyramid resolution. The final PHOG XY is obtained by averaging
the PHOG features over all slices in the temporal dimension. The creation of the PHOG descriptor is
[image:6.595.171.425.267.367.2]illustrated in Fig. 2.
Figure 2: Three planes in spatio-temporal domain for extracting TOP features, and the histogram
con-catenated from three planes: (a) original image, (b) the x-y, y-t, and x-t planes, and the concatenation of
resulting histograms into a single feature set.
The PHOG is normalised to sum to unity. Consequently, level 0 is represented by a K vector
corre-sponding toK bins of the histogram, level 1 by a 4K-vector, and the normalised PHOG XY descriptor of
the entire sequence is the vector
PHOG XYSeq= P
kPHOG XYk
k (1)
with dimensionality
Dimxy=KX
l∈L
4l, (2)
whereLdenotes the number of levels, which is set to 2 to prevent over fitting of the edge contours over the
grid. PHOG TOP is a concatenation of the descriptors of three planes (PHOG XYSeq, PHOG XTSeq, and
PHOG YTSeq, resulting in
PHOG TOP ={PHOG YTSeq,PHOG XTSeq,PHOG XYSeq} (3)
of dimensionality Dimxy+ Dimxt+ Dimyt.
Similar to [23], we segment an image sequence into a number of 3D facial component sub-regions
subdivide the video sequence in the temporal dimension. This is because the length of the video sequences
(as used in our experiments which start with the neutral expression and end with the peak phase, i.e., with
the most significant motion) extracted from Extended CK+ dataset [24] and MMI dataset [29] are
rela-tively short. Fig. 3 shows the four facial sub-regions, and the 3D sub-region of mouth in video sequences.
PHOG TOP is applied to the entire face video sequence and four different sub-regions.
Figure 3: (Left) four facial sub-regions, and (right) face video sequence with 3D mouth sub-region.
3.2. Dense optical flow descriptor
Optical flow captures the dynamic information in a video sequence. For our framework, optical flow
is used to track facial points in a video sequence and compute the displacement which represents the
movement of corresponding points between two consecutive frames. Instead of tracking some facial fiducial
points (landmarks), we track dense facial points uniformly distributed on a grid placed on the central facial
region. The merit of the dense optical flow is that the points on the grid are tracked as one entity. As a
result, the global displacement of these considered points is obtained, which is used to generate the feature
vector.
The Lucas-Kanade optical flow algorithm [25] has been used to estimate the displacement of facial
feature points. It is a gradient-based method for motion estimation, and approximates the motion between
two consecutive frames. Given two consecutive frames It−1 and It, for a point p= (x, y)T in It−1, if the
optical flow isd= (u, v)T then the corresponding point inI
tisp+d, whereT is the transpose operator. The
algorithm find thedwhich minimises the match error between the local appearances of two corresponding
points. A cost functione(d) is defined for the local areaR(p), i.e.,
e(d) = X x∈R(p)
w(x)(It(x+d)−It−1(x))2, (4)
wherew(x) is a weights window, which assigns larger weight to pixels that are closer to the central pixel as
these pixels give more importance than others. Optimising (4) gives the solution
[image:7.595.208.388.211.311.2]where
G= X
x∈N(p)
w(x)∇It(∇It)T (6)
H = X
x∈N(p)
w(x)∇It∆I (7)
∆I=It−1−It (8)
∇It=
dIt
dx. (9)
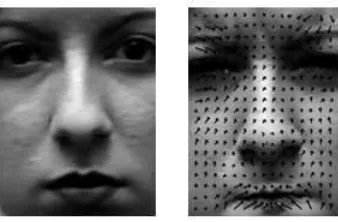
The efficiency of computing the dense optical flow depends on the grid size. Since a grid with small cells
leads to high computation, we use a grid of 20×15 placed on the central face region, and its vertices are the
facial points to be tracked. The displacement vector of two consecutive frames is then computed on these
300 points, which reduces the computation significantly. The right image of Fig. 4 shows the trajectories of
tracked points from the previous frame of a neutral facial expression.
Figure 4: (Left) a neutral image, and (right) with the dense optical flow superimposed.
The corresponding inter-frame displacement vectors are added to obtain the global displacement vectors
corresponding to each point during an expression (i.e., from a neutral face to the peak phase of the
expres-sion). More formally, let (p1, . . . , pS) be the respective spatial image positions of a facial feature point (i.e.,
one of the grid vertices)pat frames 1, . . . , S, whereS is the number of frames in the video sequence. The
global displacement vector of pointpis
vp= S−1 X
i=1
vpi= S−1 X
i=1
(pi+1−pi), (10)
where
kvpk= q
p2
x+p2y , θp=tan−1(
py
px
), (11)
andpx andpy are respectively thexandy components ofvp.
The normalisation of the dense optical flow is slightly different from that of PHOG TOP, where we do
not detect the landmakes over the entire video sequence. Instead, we only locate the landmarks of the first
[image:8.595.213.382.334.445.2]eye corner points are used to define a reference vector ¯nvand its angleθwith the horizontal axis ¯w= (1,0)T,
i.e.,
knvk¯ =qnv2
x+nvy2 (12)
θ= cos−1( nv¯ ·w¯
knvkk¯ wk¯ ). (13)
These are used to normalise the global displacement vectors and to correct the orientation angles of these
vectors. Finally, the global displacement of any feature point is
dglobal=
kvpk
knvk¯ . (14)
Its normalised angle is computed by adding it toθp¯(i.e., the orientation of vector ¯pis the positive or negative
value ofθ) to give
θglobal=θ+θp¯. (15)
Two normalised features are thus obtained for each of the tracked feature points.
A global feature vector vglobal of 600 components, i.e., the dense optical flow, is then created for each
video sequence, containing the pair of displacement features of the points, i.e.,
vglobal= [kp1k, θp1,kp2k, θp2, . . . ,kpRk, θpR] , (16)
wherekpik andθpi respectively denote the normalised modulus and the normalised angle of the vectorpiof
accumulated displacement of a given feature point, and R denotes the number of tracked points.
3.3. Integration of descriptors
The integration of the normalised descriptors of a video sequence is
fInt = {fmotion, fspatial}
= {ω1·PHOG YTSeq, ω2·PHOG XTSeq,
ω3·vglobal, ω4·PHOG XYSeq}, (17)
whereωidenote the weights for the different descriptors and represent the contribution of the descriptors to
the integrated descriptor. Note that if every weight is set to 1 then the integration is simply the concatenation
of all descriptors. The analysis of the selection of weights is presented in Section 5. The set of the integrated
feature vectors, corresponding to all considered video sequences, is divided into two disjoint sets: training
4. Framework for Facial Expression Recognition
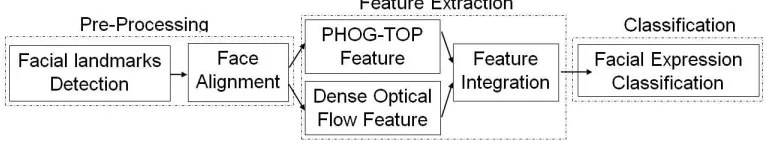
The proposed framework comprises three phases: pre-processing, feature extraction and classification
as shown in Fig. 5. The pre-processing includes facial landmark detection and face alignment, where face
alignment is applied to reduce the effect of variation in head pose and scene illumination to give a better
[image:10.595.105.490.219.291.2]recognition performance.
Figure 5: Framework for the facial expression recognition.
The Local Evidence Aggregated Regression (LEAR) [26] is employed to detect facial landmarks over
every frame of a video sequence, and the locations of the detected eyes are then used to align any in-plane
rotation, where the angle of two eyes in each frame are rotated at their centre to line up to the horizontal
axis. The two eyes and nose tip are used to scale and crop the image into a 160×240 rectangular region of
interest containing the central face region. In the cropped image, thexcoordinate of the centre of two eyes
are the centre in the horizontal direction, while they coordinate of the nose tip locates the lower third in
the vertical direction.
The feature extraction phase includes the generation of PHOG TOP andvglobal. The details are presented
in Section 3.
SVM has been widely applied to facial expression recognition due to its following properties: (1) its
ability to work with high-dimensional data; and (2) a high generalisation performance without the need of
a priori knowledge, even when the dimension of the input space is very large. The linear, polynomial, and
RBF kernels have been shown in [27] to achieve good performance in facial expression recognition. Thus, to
achieve an effective classification of facial expressions, we apply the classical SVM classifier with the RBF
kernel. In this paper, we use grid-search and 10-fold cross-validation [28] to estimate the kernel parameter.
The parameter that achieves the best cross-validation accuracy is selected.
SVM is a binary classifier, however, the classification of facial expressions is a multiclass classification
problem. Thus, the binary SVM classifiers need to be combined for recognition of multiple classes [28]. Two
strategies are commonly used: one-versus-one and one-versus-all. In the one-versus-all strategy, the classifier
with the highest output assigns the class. In the one-versus-one case, every classifier assigns test data to one
of the two classes, the vote for the assigned class is increased by one vote, and finally the class with the most
of its implementation and its robustness in classification as follows. SupposeC classes are classified using
binary classifiers,C(C−1)/2 binary classifiers are built from all pairs of distinct classes. Sometimes, more
than one expressions (i.e., classes) obtain the most number of votes. In this case the features extracted from
image sequences of one of the two classes, say classm, are averaged to obtain a template representing that
class,
Tm= ΣM
i fi,m
M , (18)
wherefi,mdenotes theith feature belonging to classm. During the classification, a simple nearest neighbour
classifier is used and the feature belonging to the test datah1is classified as the nearest class template, i.e.,
Tm:D(h1, Tm)< D(h1, Tn), (19)
where D(.,.) is distance function, andmandnare the indices of the two classes with the most votes.
5. Experiments
5.1. Facial expression datasets
The Extended CK+ dataset (CK+) [24] is the most widely used data for evaluating facial expression
recognition methods, and is publicly available. This dataset contains 593 image sequences of seven basic facial
expressions (namely Anger, Contempt, Disgust, Fear, Happiness, Sadness and Surprise). These expressions
were performed by 120 subjects. The age of the participants ranges from 18 to 30 years, 65% of them are
female, 81% are Euro-American, 13% are Afro-American, and 6% of other racial groups. Each frame of
the image sequences is 640×480 or 640×490 pixels with an 8-bit grey scale. The video sequences vary in
duration (i.e., 10 to 60 frames) and incorporate the onset (i.e., the neutral frame) to peak phase of the facial
expression. We used 327 image sequences of seven expressions, where we replaced the expression neutral
with Contempt. The top row of Fig. 6 shows sample images of a subject expressing six expressions. Table 1
shows the occurrences of the various expression classes in CK+ dataset.
The MMI dataset [29] is another well-known dataset, which comprises video sequences including both
posed and spontaneous expressions. These expressions were performed by 19 subjects (44% female), with
age ranging from 19 to 62, and of European, Asian and South American ethnicity. The subjects performed
79 expressions including the six basic facial expressions with neutral frame at the start of each sequence.
Every video frame is at 720×576 spatial resolution. We converted the original frames into 8-bit greyscale
images for our experiments, and extracted the sub-sequence from the neutral frame to the peak phase. In
our experiments, 203 image sequences labelled as one of the six basic facial expressions are selected from
the MMI dataset. The bottom row of Fig. 6 shows sample images of the six basic expressions.
Since the MMI dataset is generated in a different way to the CK+ dataset, and may contain larger pose
Figure 6: Example of expressions from CK+ dataset (top row) and MMI dataset (bottom row). Each image
is the frame with the most expressive face in a video sequence.
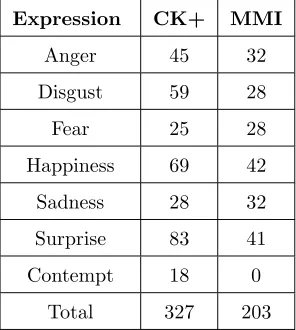
Table 1: Number of image sequences (subjects) for each expression in the CK+ dataset.
Expression CK+ MMI
Anger 45 32
Disgust 59 28
Fear 25 28
Happiness 69 42
Sadness 28 32
Surprise 83 41
Contempt 18 0
Total 327 203
used to detect and subtract the effect of head motion. For PHOG TOP, since the sequences selected for
our experiments are frontal view with no out-of-plane head pose which can cause self-occlusions of the eyes
region (which are used for our alignment process), we applied the same pre-processing method as for CK+
dataset.
5.2. Experimental results
Three sets of experiments are performed on the CK+ dataset (with smaller head motion than in MMI
dataset) to evaluate the performance of the proposed framework and to compare its performance with
two state of the art facial expression recognition methods. Leave-sequence-out cross-validation scheme is
employed as follows. One video sequence is selected for testing and the remaining video sequences are used
for training, which guarantees that a sequence selected for testing is not in the training set and consequently
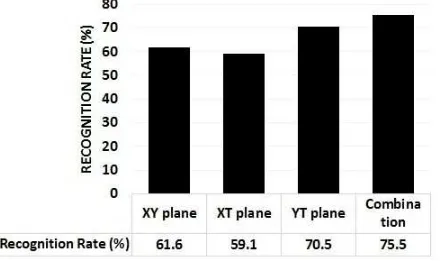
[image:12.595.224.372.346.511.2]The first set of experiments investigates whether spatio-temporal PHOG performs better than using only
one histogram from either XY, YT or XT plane. Cross-validation was applied 327 times on the selected
327 video sequences. The recognition rate of classifying all expressions using PHOG from each individual
plane, i.e., PHOG XYSeq, PHOG XTSeq and PHOG YTSeq, and their combination, i.e., PHOG TOP, are
[image:13.595.192.412.209.340.2]summarized in Fig. 7.
Figure 7: Recognition rates of all expressions PHOG from either XY, XT, YT or their combination, i.e.,
PHOG TOP.
Fig. 7 shows that the recognition rate using the non-weighted (i.e., withωi=1 fori=1, 2, 3, 4) combination
of features is the highest. Also, using the features from YT plane gives the better performance than from
the other two planes, and the features which represent the variation in shape horizontally from the XT plane
give the lowest rate. This means: 1) the dynamic motion features (i.e., feature from the YT plane) plays
more important role than spatial features in recognizing facial expressions; and 2) the vertical variations in
shape (e.g, the opening of mouth) are more significant than horizontal variations.
We combine the features extracted from the three planes on the assumption that all components have
equal contribution in the recognition. However, from the aforementioned analysis, not all features are equally
important, and some of them contain more useful information than others. A weighting strategy is thus
introduced to improve the performance in recognition.
In order to determine the appropriate weights, the recognition rates achieved by using features from the
three planes separately are analysed so that the features that give better recognition are identified and are
allocated bigger weight, i.e.,
fweighted =ωifi (20)
whereωi andfi are the weight of theith plane and PHOG extracted from theith plane, respectively.
The weighting strategy is as follows. First, given the three recognition rates achieved using features from
lower the rate the smaller contribution the feature has. The weight vector
ωi=
kRik
kRk, (21)
where k · k is L2 norm, Ri denotes the average recognition rate using features from the ith plane, and
R= [R1, R2, R3].
The recognition rates achieved using combination of non-weighted and weighted features are shown in
Fig. 8. The use of the combination of weighted features resulted in better performance for sadness and
surprise, and similar performance for disgust and contempt. This is because the variations in shape in
[image:14.595.186.408.279.406.2]sadness and surprise are more significant.
Figure 8: Recognition rates of all expressions in using combination of non-weighted and weighted
[image:14.595.171.424.519.671.2]PHOG TOP.
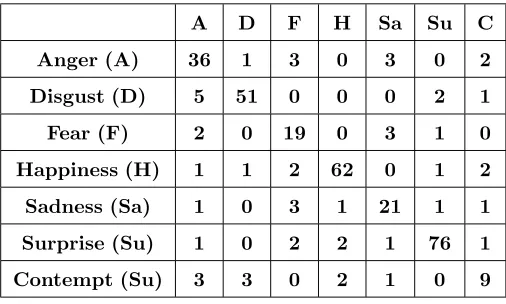
Table 2: Multiclass SVM results of PHOG TOP from the whole face on classification of six facial expressions
and Contempt of the CK+ dataset with leave-sequence-out cross-validation.
A D F H Sa Su C
Anger (A) 36 1 3 0 3 0 2
Disgust (D) 5 51 0 0 0 2 1
Fear (F) 2 0 19 0 3 1 0
Happiness (H) 1 1 2 62 0 1 2
Sadness (Sa) 1 0 3 1 21 1 1
Surprise (Su) 1 0 2 2 1 76 1
Contempt (Su) 3 3 0 2 1 0 9
The second set of experiments evaluates the discriminant power of the different facial regions (i.e., how
discriminative different facial regions are) and determines how much the PHOG TOP extracted from different
forehead, nose and mouth) are extracted and are used to compute the PHOG TOP. The concatenation of
these facial sub-regions are also taken into account. Table 2 shows the classification of PHOG TOP from the
whole facial region achieves good recognition rate (i.e.,≥85%) for Disgust, Happiness and Surprise, but less
for Fear and Sadness. This is due: (a) the number of samples for Fear and Sadness are relatively small; (b)
Happiness and Surprise were performed with much more distinguishable movement of facial landmarks; and
(c) Fear and Sadness were poorly performed that it is difficult even for human to distinguish them. Fig. 9
shows the average classification of six expressions using PHOG TOP for the considered sub-regions and their
concatenation. The results show that among the sub-regions the mouth provides the best recognition rate.
This is due to the more-differentiated movement of the mouth muscles (and consequently the corresponding
facial points) for each facial expression. Fig. 9 also shows the concatenation of the four sub-regions provides
better recognition than using the whole face. This is because the local shape information in both spatial
[image:15.595.187.410.331.463.2]and temporal domains is enhanced, while the other information is removed.
Figure 9: Discriminant power of of facial sub-regions in recognising six expressions using PHOG TOP.
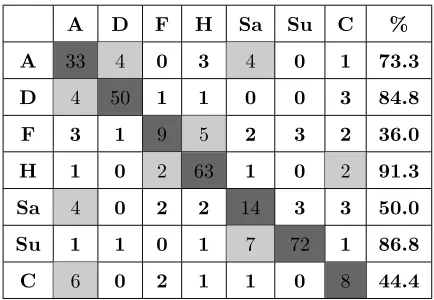
The third set of experiments evaluates the effectiveness of combining spatial shape information with
dynamic motion features. Table 3, Table 4 and Table 5 respectively show the results obtained in using
dense optical flow, PHOG TOP and the proposed framework with multi-class SVM classifier, including
the overall classification performance of multi-class SVM, where the dark grey shade indicates the correct
recognition result of each emotion while the lighter grey shade indicates the recognition result of each
emotion misclassified with the maximal error. The three tables show that the combination of PHOG TOP
and dense optical flow feature is more accurate than using individual features separately in recognising facial
Table 3: Multiclass SVM results in using Dense flow optical flow on classification of six facial expressions
and Contempt of the CK+ dataset with leave-sequence-out cross-validation. Dark grey shade - correct
recognition result of each emotion; and lighter grey shade - recognition result of each emotion misclassified
with the maximal error.
A D F H Sa Su C %
A 33 4 0 3 4 0 1 73.3
D 4 50 1 1 0 0 3 84.8
F 3 1 9 5 2 3 2 36.0
H 1 0 2 63 1 0 2 91.3
Sa 4 0 2 2 14 3 3 50.0
Su 1 1 0 1 7 72 1 86.8
C 6 0 2 1 1 0 8 44.4
Table 4: Multiclass SVM results in using PHOG TOP on classification of six facial expressions and Contempt
of the CK+ dataset with leave-sequence-out cross-validation. Dark grey shade - correct recognition result
of each emotion; and lighter grey shade - recognition result of each emotion misclassified with the maximal
error.
A D F H Sa Su C %
A 38 1 3 0 2 0 1 84.4
D 4 53 0 0 0 1 1 89.8
F 1 0 21 0 3 0 0 84.0
H 0 1 2 64 0 0 2 92.8
Sa 2 0 3 0 21 1 1 75.0
Su 0 0 1 2 1 79 0 95.2
[image:16.595.189.407.544.693.2]Table 5: Multiclass SVM results in using the proposed framework on classification of six facial expressions
and Contempt of the CK+ dataset with leave-sequence-out cross-validation. Dark grey shade - correct
recognition result of each emotion; and lighter grey shade - recognition result of each emotion misclassified
with the maximal error.
A D F H Sa Su C %
A 40 0 1 0 3 0 1 88.9
D 2 55 1 0 0 0 1 93.2
F 0 1 20 1 3 0 0 80.0
H 1 0 2 65 0 1 0 94.2
Sa 2 0 3 0 22 0 1 78.5
Su 0 0 0 1 3 79 0 95.2
It is difficult to make a quantitative comparison between the state of the art facial expression recognition
methods due to the different pre-processing and experiment strategies involved. Since the methods of Eskil
and Benli [30] and Lucey et al. [24] were evaluated on the CK+ dataset using leave-one-out cross-strategy,
it is possible to compare the proposed framework with these methods as shown in Table 6. Table 6 shows
that the proposed framework achieves an average recognition rate for all seven facial expressions of 83.70%,
which outperforms the dynamic method of Eskil and Benli [30] and the static method of Lucey et al. [24].
The confusion matrices in Table 7, Table 8 and Table 9 respectively show the recognition rate in using
the proposed features of dense optical flow, PHOG TOP and the combined optical flow and PHOG TOP
(i.e., the proposed framework), where the number in a parentheses denotes the difference in recognition rate
in using the proposed features and those used in Lucey at al [24] (i.e., shape, appearance and combined
shape and appearance, respectively), where a positive number indicates the proposed features performs
better and a negative number indicate worse. Table 7 and 8 respectively show the use of dense optical
flow and PHOG TOP achieves significantly better performance than the use of shape and appearance in
five of the seven facial expressions. Table 9 shows the combined use of dense optical flow and PHOP TOP
is significantly better in three expressions, slightly worse in two expressions and significantly worse in one
expression. However the average recognition performance of the proposed framework is slightly better as
shown in Table 6. We can also conclude that the combination of spatial local shape information and dynamic
[image:18.595.157.435.486.602.2]features improves the recognition.
Table 6: Comparative evaluation of the proposed framework with 2 methods using leave-subject-out
cross-validation.
Study Methodology Recognition Rate
Eskil and Benli [30] SVM 76.8
Adaboost 76.3
Lucey et al. [24] SVM(shape) 50.4
SVM(Appearance) 66.7
SVM(Combined) 83.3
Table 7: Confusion matrix in using dense flow optical flow on classification of six facial expressions and
Contempt of the CK+ dataset with leave-sequence-out cross-validation. The value in a parentheses denotes
the difference in recognition rate in using dense optical flow and in using shape (of Lucey et al. [24].) Dark
grey shade - correct recognition result of each emotion; and lighter grey shade - recognition result of each
emotion misclassified with the maximal error.
A D F H Sa Su C
A 73.3(38.3) 8.9 0.0 6.7 8.9 0.0 2.2
D 6.8 84.8(16.4) 1.7 1.7 0.0 0.0 5.1
F 12.0 4.0 36.0(14.3) 20.0 8.0 12.0 8.0
H 1.4 0.0 2.9 91.3(-7.1) 1.4 0.0 2.9
Sa 14.3 0.0 7.1 7.1 50.0(46.0) 10.7 10.7
Su 1.2 1.2 0.0 1.2 8.4 72(-28.0) 1.2
C 33.3 0.0 11.1 5.6 5.6 0.0 44.4(19.0)
Table 8: Confusion matrix in using PHOG TOP on classification of six facial expressions and Contempt of
the CK+ dataset with leave-sequence-out cross-validation. The value in a parentheses denotes the difference
in recognition rate in using PHOG TOP and in using appearance (of Lucey et al. [24].) Dark grey shade
- correct recognition result of each emotion; and lighter grey shade - recognition result of each emotion
misclassified with the maximal error.
A D F H Sa Su C
A 84.4(14.4) 2.2 6.7 0.0 4.4 0.0 2.2
D 6.8 53(41.7) 0.0 0.0 0.0 1.7 1.7
F 4.0 0.0 84.0(62.3) 0.0 12.0 0.0 0.0
H 0.0 1.4 2.9 64.0(-36.0) 0.0 0.0 2.9
Sa 7.1 0.0 10.7 0 75.0(15.0) 3.6 3.6
Su 0 0 1.2 2.4 1.2 95.2(-0.8) 0
[image:19.595.93.502.553.704.2]Table 9: Confusion matrix in using the proposed framework on classification of six facial expressions and
Contempt of the CK+ dataset with leave-sequence-out cross-validation. The value in a parentheses denotes
the difference in recognition rate in using the combined features of dense optical flow and PHOG TOP and
in using the combined features of shape and appearance (of Lucey et al. [24].) Dark grey shade - correct
recognition result of each emotion; and lighter grey shade - recognition result of each emotion misclassified
with the maximal error.
A D F H Sa Su C
A 88.9(13.9) 0.0 2.2 0.0 6.7 0.0 2.2
D 3.4 93.2(-1.5) 1.7 0.0 0.0 0.0 1.7
F 0.0 4.0 80.0(14.8) 4.0 12.0 0.0 0.0
H 1.4 0.0 2.9 94.2(-5.6) 0.0 1.4 0
Sa 7.1 0.0 10.7 0.0 78.5(10.5) 0.0 3.6
Su 0.0 0.0 0.0 1.2 3.6 95.2(-0.8) 0
C 16.7 5.6 5.6 11.1 11.1 0.0 55.6(-28.8)
The MMI dataset is used to provide quantitative comparisons with the methods developed by Shan et al.
[27], Fang et al. [31], AAM [31], and ASM [31]. For the experiments, we performed 10-fold cross-validation.
The average recognition rates are shown in Table 10. The performance of the proposed framework on MMI
dataset is worse than that on the CK+ dataset. This is because there are fewer data for training and there
are larger changes in head pose in MMI dataset. However, the proposed framework outperforms all the
other four methods.
To evaluate the across-dataset performance of the proposed framework, we extracted the integrated
features from CK+ dataset as training data, and then use the MMI dataset for testing. The recognition
result (in Table 10) shows the generalisation performance across datasets is much lower (58.7% on the MMI
database). Thus, we conclude that the current expression classification trained on a single dataset under
controlled environment gives good performance only on that dataset.
The computational complexity is analysed with the view of assessing the potential of our proposed
frame-work for real-time application. The processing time is approximated to be the time needed for preprocessing,
extracting the dense optical flow and PHOG TOP, and classification per image frame of the video sequence.
The processing time (measured using the computer system clock) is estimated using OpenCV 2.4.3 in
Mi-crosoft Visual Studio 2010 Express Edition environment on an Intel(R) Core (TM) i7-3770 CPU @ 3.40ghZ
with 16GB RAM running on Windows 7 operating system. The average processing time per image is under
Table 10: Comparative evaluation of the proposed framework using MMI dataset
Study Recognition Rate
Shan et al. [27] 54.45
AAM in [31] 62.38
ASM in [31] 64.35
Fang et al. [31] 71.56
Proposed framework 74.30
train: CK+ Test: MMI 58.70
6. Conclusion
This paper presents a facial expression recognition framework which uses PHOG TOP and dense optical
flow. The framework which comprises pre-processing, feature extraction and multi-class SVM-based feature
classification achieves better performance than two state of the art methods on CK+ dataset and four other
methods on MMI dataset. The average recognition rate is 83.7% on the CK+ dataset and 74.3% on the
MMI dataset. The expressions of Happiness and Surprise are easier to be distinguished than other facial
expressions, and the results on these two expressions demonstrate the capability of the proposed framework.
Nevertheless, the recognition rate of the expressions of Contempt (55.6%) and Sadness (78.5%) on the CK+
dataset are lower because these two expressions are often misclassified as Anger and Fear. A limitation of the
proposed framework is its generalisation to other datasets. This is because different datasets are generated
under different environments (e.g., with varying illumination and head pose).
The proposed framework is able to classify the expressions of Happiness and Surprise accurately, but
encountered some difficulty in recognising the other expressions. This is because the datasets used in this
paper are small and some of the expressions are poorly represented. One way to address this is to either
balance the dataset, or acquire more data. Another limitation of the proposed framework is that it does
not consider occlusions (e.g., subjects wearing glasses and with varying hair styles), which will be addressed
in our future work. Other aspects that could be useful are the use of more contextual information (e.g.,
body movements) to achieve better performance and a better understanding of human emotions. The
incorporation of contextual information will also be investigated in our future work.
7. Acknowledgements
The authors would like to thank China Scholarship Council / Warwick Joint Scholarship for providing
Reference
[1] Viola, P. (2002). Rapid object detection using a boosted cascade of simple features: Computer Vision and Pattern Recognition. CVPR 2001. Proceedings of the 2001 IEEE Computer Society Conference on, vol. 1, pp. 511-518.
[2] Fang, H., and Costen, N. (2009). From rank-n to rank-1 face recognition based on motion similarity. in: Proceedings of the British Conference on Machine Vision, pp. 1-11.
[3] Cornelis, C., Cock, M.D., and Radzikowska, A.M. (2007). Vaguely quantified rough sets. in: Proceedings of the Interna-tional Conference on Rough Sets, Fuzzy Sets, Data Mining and Granular Computing, vol. 4482, Springer, pp. 87-94. [4] Ekman, P., and Friesen, W. (1971). Constants across cultures in the face and emotion J. Pers. Soc. Psychol., 17(2), pp.
124-129.
[5] Pantic, M. and Rothkrantz, L.J.M. (2000). Automatic analysis of facial expressions: the state of the art. IEEE Transactions Pattern Analysis and Machine Intelligence, 22(12), pp. 1424-1445.
[6] Fasel, B. and Luettin, J. (2003). Automatic facial expression analysisi: a survey. Pattern Recognition, 36(1), pp. 259-275. [7] Bartlett, M., Littlewort, G., Frank, M., Lainscsek, C., Fasel, I., and Movellan, J. (2005). Recognising facial expres-sion:machine learning and application to spontaneous behavior. in:IEEE Computer Society Conference on Computer Vision and Pattern Recognition, vol. 2, pp. 568-573.
[8] Tian, Y.-I., Kanade, T., and Cohn, J. (2002). Recognizing action units for facial expression analysis. IEEE Transactions Pattern Analysis and Machine Intelligence, 23(2), pp. 97-115.
[9] Bosch, A., Zisserman, A., and Munoz, X. (2007). Representing shape with a spatial pyramid kernel, In Proceedings of the International Conference on Image and Video Retrieval, pp. 401-408.
[10] Cohn, J. F., Zlochower, A., Lien, J., and Kanade, T. (1998). Feature-point tracking by optical flow discriminates subtle differences in facial expression. In Third IEEE international conference on automatic face and gesture recognition, pp. 396-401.
[11] Zhang, Z. and Lyons, M., Schuster, M. and Akamatsu, S. (1998). Comparison between geometry-based and gabor-wavelets-based facial expression recognition using multilayer. Proceeding of International Conference on Automatic Face and Gesture Recognition, pp.454-459.
[12] Zhan, G. and Pietikainen, M. (2007). Dynamic texture recognition using local binary patterns with an application to facial expression. IEEE Transactions on Pattern Analysis and Machine Intelligence, 29(6), pp. 915-928.
[13] Ojala, T., Pietikainen, M., and Maenpaa, T. (2002). Multiresolution gray-scale and rotation invariant texture classification with local binary patterns, IEEE Transactions on Pattern Analysis and Machine Intelligence, 24(7), pp. 971-987. [14] Zhao, G.Y., and Pietikainen, M. (2007). Dynamic texture recognition using local binary pattern with an application to
facial expression, IEEE Transactions on Pattern Analysis and Machine Intelligence, 2(6), pp. 915-928.
[15] Zhang, Y., and Ji, Q. (2005). Active and dynamic information fusion for facial expression understanding from image sequences. IEEE Transactions on Pattern Analysis and Machine Intelligence. 27(5). pp. 699-714.
[16] Pantic, M., and Patras, I. (2006). Dynamics of facial expression: recognition of facial actions and their temporal segments from face profile image sequences. IEEE Transactions on Systems, Man, and Cybernetics 36(2), pp. 433-449.
[17] Valstar, M.F., and Patras, I. (2005). Facial action unit detection using probabilistic actively learned support vector machines on tracked facial point data. In: IEEE Conference on Computer Vision and Pattern Recognition Workshop, pp. 76-84.
[18] Yacoob, Y., and Davis, L.S. (1996). Recognizing human facial expression from long image sequences using optical flow, IEEE Transactions on Pattern Analysis and Machine Intelligence, 18(6), pp. 636-642.
[20] Dalal, N. and Triggs, B. (2005). Histograms of oriented gradients for human detection. IEEE Conference on Computer Vision and Pattern Recognition, vol. 1, pp. 886-893.
[21] Deniz, O., Bueno, G., Salido, J., and De la Torre. (2011). F. Face recognition using histograms of oriented gradients. Pattern Recognition Letters, 32(12), pp. 1598-1603.
[22] Lazebnik, S., Schmid, C., and Ponce, J. (2006). Beyond bags of features: Spatial pyramid matching for recognizing natural scene Categories, In IEEE Computer Society Conference on Computer Vision and Pattern Recognition, vol. 2, pp. 2169-2178.
[23] Li, Z., Imai, J., and Kaneko, M. (2009). Facial-component-based Bag of Words and PHOG Descriptor for Facial Expression Recognition, In IEEE International Conference on Systems, Man and Cybernetics, pp. 1353-1358.
[24] Lucey, P., Cohn, J. F., Kanade, T., Saragih, J., Ambadar, Z., and Matthews, I. (2010). Extended Cohn-Kande Dataset (CK+): A complete facial expression dataset for action unit and emotion-specified expression. Paper presented at the Third IEEE Workshop on CVPR for Human Communicative Behaviour Analysis, pp. 94-101.
[25] Lucas, B.D.,Kanade, T. (1981). An iterative image registration technique with an application to stereo vi-sion,in:Proceedings of the 7th International Joint Conference on Artificial Intelligence, vol. 2, pp. 674-679.
[26] Martinez B., Valstar M.F.,Binefa X., and Pantic, M. (2013). Local Evidence Aggregation for Regression Based Facial Point Detection. IEEE Transactions on Pattern Analysis and Machine Intelligence. 35(5), pp. 1149-1163.
[27] Shan, C., Gong, S., and McOwan, P. (2009). Facial Expression Recognition based on Local Binary Patterns: A Compre-hensive Study. Image and Vision Computing, vol. 27, pp. 803-816.
[28] Hsu, Chih-Wei, Lin,Chih-Jen. (2002). A Comparison of Methods for Multiclass Support Vector Machines. IEEE Transac-tions on Neural Networks, 13(2), pp. 415-425.
[29] Pantic, M., Valstar, M., Radermaker, R., and Maat, L. (2005). Web-based Database for Facial Expression Analysis, in: Proceedings of the 13th ACM International Conference on Multimedia, pp. 317-321.
[30] Eskil, M.T., and Benli, K. (2014). Facial expression recognition based on anatomy, Computer Vision and Image Under-standing, vol. 119, pp. 1-14.