Original citation:
Hugh-Jones, David and Leroch, Martin A. (2012) Reciprocity towards groups : a laboratory experiment on the causes. Working Paper. Coventry, UK: Department of Economics, University of Warwick. (CAGE Online Working Paper Series).
Permanent WRAP url:
http://wrap.warwick.ac.uk/57895
Copyright and reuse:
The Warwick Research Archive Portal (WRAP) makes this work of researchers of the University of Warwick available open access under the following conditions. Copyright © and all moral rights to the version of the paper presented here belong to the individual author(s) and/or other copyright owners. To the extent reasonable and practicable the material made available in WRAP has been checked for eligibility before being made available.
Copies of full items can be used for personal research or study, educational, or not-for-profit purposes without prior permission or charge. Provided that the authors, title and full bibliographic details are credited, a hyperlink and/or URL is given for the original metadata page and the content is not changed in any way.
A note on versions:
The version presented here is a working paper or pre-print that may be later published elsewhere. If a published version is known of, the above WRAP url will contain details on finding it.
WORKING PAPER SERIES
Centre for Competitive Advantage in the Global Economy
Department of Economics
September 2012 No.99
Reciprocity towards groups: a laboratory experiment on the
causes
Reciprocity towards groups: a laboratory experiment on the causes
1Authors: David Hugh-Jones*, Martin A. Leroch**
Affiliations:
* CAGE, University of Warwick, [email protected] ** University of Mainz, [email protected]
Abstract: Field studies of conflict report cycles of mutual revenge between groups, often linked to
perceptions of intergroup injustice. We test the hypothesis that people are predisposed to reciprocate
against groups. In a computerized laboratory experiment, subjects who were harmed by a partner’s
uncooperative action reacted by harming other members of the partner’s group. This group
reciprocity was only observed when one group was seen to be unfairly advantaged. Our results
support a behavioral mechanism leading from perceived injustice to intergroup conflict. We discuss
the relevance of group reciprocity to economic and political phenomena including conflict,
discrimination and team competition.
1This work was supported by British Academy Small Research Grant SG101553. We thank Astrid Buba, Vittoria Levati, Werner Güth, Eva Steiger, Johannes Weisser, Ro'i Zultan, David Reinstein, Ryan McKay, Eva van den Broek, Shaun Hargreaves Heap, Brian Lickel, Arthur Lupia, Tore
Introduction
Laboratory experiments show that humans are prepared to reciprocate wrongs by harming the
offender, even at a cost to themselves (Fehr and Gächter 2000). Field studies of ethnic and
communal violence report tit-for-tat processes, with attacks on one group being avenged by attacks
on (previously uninvolved) members of the attackers’ group (Horowitz 1985, 2001; Chagnon 1988).
For example, in Atlanta, 1906, after a spate of newspaper coverage of black attacks on white
women, a group of whites went downtown to a black neighborhood and killed 25 black men
(Bauerlein 2001). Similarly, after an argument between an Indian Dalit and an upper caste farmer,
upper caste villagers attacked 80 Dalit families and subsequently imposed a “social boycott”,
forcing Dalits to leave the village (Hoff et al. 2011). Such reports suggest that humans reciprocate
not only towards individuals, but also towards entire groups, even if this means harming innocent
people.
This behavior, which we call “group reciprocity”, could explain the persistence of intractable
conflicts which hinder development in many of the world's poorest states (World Bank 2011).
Group reciprocity may also affect the international macroeconomy. Keynes (1922), describing the
Treaty of Paris’ intentional devastation of the German economy, quoted Thomas Hardy: “Nought
remains / But vindictiveness here amid the strong, / And there amid the weak an impotent rage. ”
Similar motivations might be at play between German and Greek voters in the current European
crisis.
We conducted a computerized laboratory experiment to test for group reciprocity, looking both for
direct group reciprocity in response to actions affecting oneself, and for indirect group reciprocity,
in response to actions affecting others (Nowak and Sigmund 2005). Individual transgressions do not
occurs. Our controlled laboratory conditions allow us to test different causal explanations in a way
hard to achieve with field research. In particular, many studies suggest that intergroup inequality
and injustice lead to intergroup conflict (Tambiah 1996; Horowitz 2001; Cederman et al. 2011).
Group reciprocity might provide one mechanism for this causal link: in a context of intergroup
unfairness, resentment at one individual’s actions may spread towards that person’s entire group,
and lead to intergroup revenge behavior. We therefore use different treatments to vary the perceived
unfairness of intergroup allocations.
Our results support the hypothesis that humans group-reciprocate. We find little evidence for
indirect group reciprocity, but strong evidence for direct group reciprocity. We also confirm that
there is a link with perceived unfairness. Subjects only group-reciprocated when a large reward had
been arbitrarily allocated to one group, and subjects who saw the intergroup allocation as unfair
were more likely to group-reciprocate.
The impact of group membership on human behavior was first studied by social psychologists
(Sumner 1906; Sherif et al. 1961; Tajfel et al. 1971). More recently economists have taken up the
same topic, using laboratory and field experiments. The literature shows some fairly robust results.
People cooperate more with in-group members (de Cremer and van Vugt 1999; Goette et al. 2006,
Guala et al. 2012). Group members give more to each other, punish each other less for misbehavior
and reward each other more for good behavior (Bernhard et al. 2006; Chen and Li 2009; Currarini
and Mengel 2012). Moreover, people place a value on their group membership, and prefer to
interact with others from their own group (Hargreaves-Heap and Zizzo 2009; Currarini and Mengel
2012).
None of these phenomena, by itself, appears sufficient to explain historically observed episodes of
extreme violence against outgroups (Brewer 1999). Indeed, the in-group bias shown in allocating
et al. 1992). Psychologists have therefore developed broader theories of intergroup emotions to
explain how people react to outgroups; these include “vicarious retribution”, a propensity to
retaliate against the group (Lickel et al. 2006). Experiments on vicarious retribution thus far have
examined only verbal attitudes (Stenstrom et al. 2008), or cannot cleanly distinguish
individual-level reciprocity from group reciprocity (Gaertner et al. 2008).
Some economic experiments have examined group-level outcomes of intergroup dynamics
(Bornstein et al. 1992, 2003; Abbink and Herrmann 2009). Group reciprocity may play a similar
explanatory role here to standard reciprocity in public goods games (Fehr et al. 2000), by providing
the individual-level psychological mechanism underlying phenomena such as costly vendettas and
increased effort in intergroup Prisoner’s Dilemmas.
The interpretation of experiments on reciprocity remains debated: do they show “strong
reciprocity”, i.e. reciprocity as a primitive in the utility function, or only “a misapplication... of a
heuristic rule ” derived from settings where intergroup reciprocity may be individually rational
(Guala 2012)? Our experiment is compatible with both interpretations. We simply claim that in
either case, it provides valuable evidence about human behavioral dispositions.
Experiment design
We ran 15 sessions of 16 subjects each. Each session was divided into two parts: a group quiz and a
sequence of 2-player public goods games. In each session, subjects were randomly allocated into
four color-coded groups of four: green, orange, purple, and brown. Each subject’s color group was
shown on screen throughout the experiment. Payments were shown in Experimental Currency Units
(ECU) with 1 ECU = 5 Euro cent.
After the group assignment, groups were given a 10-minute quiz consisting of 20 multiple-choice
each other via online chat. (It was forbidden to communicate personal information; chat records
show that all subjects followed these instructions.) Each group member’s correct answer was
rewarded with 10 ECU for the group. A group’s earnings were divided equally among its members,
and 100 ECU per subject were used as an endowment for the second part of the experiment. To
ensure that each subject had at least 100 ECU, minimum group earnings of 400 ECU were
implemented. This is purely a framing manipulation to increase subjects’ sense that they had
“earned” their ECU.
The group quiz had two functions: building group identity, by giving groups a common task and an
element of common fate; and creating between-group inequality (Chen and Li 2009). To increase
this and to manipulate subjects’ perceptions of the fairness of intergroup allocations, we gave one
group a 100 ECU bonus. In 3 “winner bonus” sessions, the group with the most points was awarded
the bonus. In the remaining 12 “random bonus” sessions, this bonus was instead given to a
randomly selected group. In both cases, the instructions explained how the bonus would be
awarded, and the group receiving the bonus was announced directly after the quiz. We expected
subjects to perceive between-group inequality as less fair when the bonus was awarded randomly.
The quiz was followed by a brief questionnaire. Subjects then played eight repetitions of a two
round, two player public goods game. In each repetition, subjects were re-matched into groups of 4
with members of different colors. They could observe all group members’ color, as well as their
earnings from the quiz. The 4 subjects were then matched into pairs for each of the two rounds.
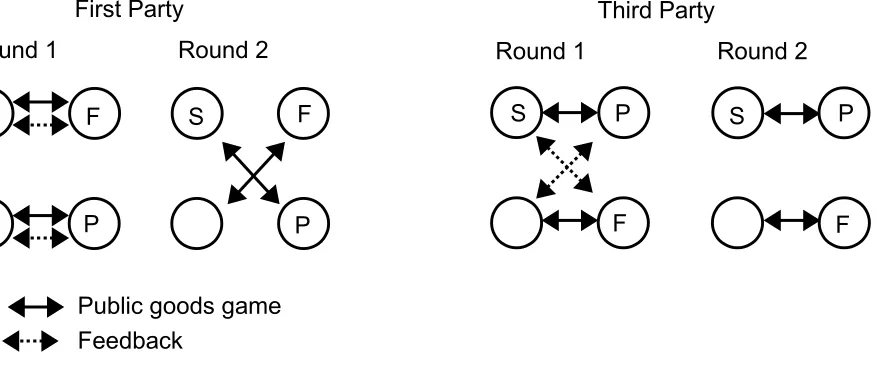
The basic structure of each repetition is always the same. Subjects played a public goods game with
one other subject from the four. They then received feedback about one other subject’s play from
the four, who we label F. Lastly, they played another public goods game with one other subject from
Figure 1: Experiment design. Subject is marked with an S. F denotes the feedback subject, P the second round partner
Different treatments used different matching, illustrated in Figure 1. In “first party” treatments,
subjects were paired “horizontally” in the first round and received feedback on their partner’s play:
i.e., F was the subject’s own first round partner. In the second choice, subjects were paired
“diagonally”. Thus, subjects learnt about how F had played against them in the first round, and
could then react to this by playing differently against P in the second round. These treatments test
for direct or “first party” group reciprocity.
In third party treatments, first choices were made with the horizontal player, but feedback was
given (only) on the behavior of the diagonal player. Then subjects played the horizontal player
again. Thus, subjects learnt about how F had played against another participant in the first round,
and could react to this by playing differently against P in the second round. These treatments test for
“indirect” or “third party” group reciprocity.
Because conflicts are often modelled as prisoners' dilemmas (Hardin 1995; Fearon and Laitin
1999), we chose to implement a standard linear public goods game in each round: the two subjects
shared a fund of 100 ECU, where 50 tokens were taken from each of the two subjects' earnings
Feedback
Public goods game First Party
Round 1 Round 2
Third Party
Round 1 Round 2
S F S F
P P
S P S P
from the quiz. Each could then take up to 50 ECU from the fund. ECU remaining in the fund were
multiplied by 1.5 and shared equally between the two. Withdrawing tokens from the fund is thus
harmful for one’s partner because it reduces his earnings from the quiz. In the worst case (subject
withdraws nothing, partner withdraws 50 tokens), the subject (after rounding) receives only 36
tokens. The partner would in this case earn the maximum possible of 86 tokens. In case neither
subject withdraws anything, both earn 75 tokens. Total earnings from one random repetition were
used for payment.
Cross-cutting treatments varied the color group membership of the four subjects, as Figure 2 shows.
F's action might influence subjects’ play against second round partners from all groups, due to
imitation or generalized reciprocity (Dufwenberg et al. 2001; Nowak and Roch 2007). For clean
identification of reciprocity towards groups, in different group (same group) repetitions, F and P
were from different groups (the same group). In addition, in own same group (own different group)
repetitions, the “vertical” player was from the subject’s own group (another group). In third party
repetitions, this allows us to examine the effect of the group membership of the other participant
helped or harmed by F: do subjects react more strongly when F’s action affects a member of their
own group? To avoid a confound with in-group altruism, subjects never shared group membership
with the feedback player F, or with either of their partners in the public goods game.
After the second round, subjects learned the choices of all their partners in the repetition, and their
total earnings from the repetition. They were then rematched into different groups of 4 for the next
repetition. The rematching ensured that all subjects experienced all 8 treatments:{first party, third
party} × {same group, different group} × {own same group, own different group}. This “within
subjects” design allows more accurate inferences about group reciprocity’s individual-level
After the eight repetitions, subjects answered a questionnaire including demographics, measures of
group identity, reactions to other groups, and questions about the experiment. Lastly payments were
made privately.
Supplementary Treatments
The feedback player F’s choice might influence subjects’ play either by changing preferences
towards their second round partner P, or by changing expectations about P’s play. To investigate
[image:10.595.66.516.82.492.2]this, in repetitions 2 and 7 of sessions 1-10 and 13-15, expectations about P’s choice were elicited.
Figure 2: Color treatments. Subject is marked with an S.
Different group Own same group Different group Own same group Same group
Own same group
Same group
Own different group Different groupOwn different group
S
S
S
S
S
S
S
These were incentivized by a payment based on the difference between the guess and the true
amount taken by the partner (details in appendix table A2).
In sessions 11-12, among each group of four, one player’s second round amount taken was
determined randomly, by a computerized draw from the uniform distribution on {0,...,50}. The
player and his or her second round partner were informed of this in advance. All players were paid
as normal. This allows us to examine the effect of expectations in a different way, by holding S’s
expectations of P’s behavior constant. In order to focus on first party group reciprocity, these
sessions only included first party treatments, with two repetitions of each color treatment.
To test the “contact hypothesis” that prejudice can be reduced by cooperation on a common task, in
sessions 13-15 the public good games were interrupted after 4 repetitions to play an additional 5
minute quiz containing 10 questions. As before, participants could chat with each other to answer
the questions. However, this time, while one color group in each session chatted only within itself,
the other 3 color groups were redistributed into new groups of four, so that they chatted with
members from different color groups. Color group membership was shown in the chat window. The
public goods games were then continued for the 4 final rounds.
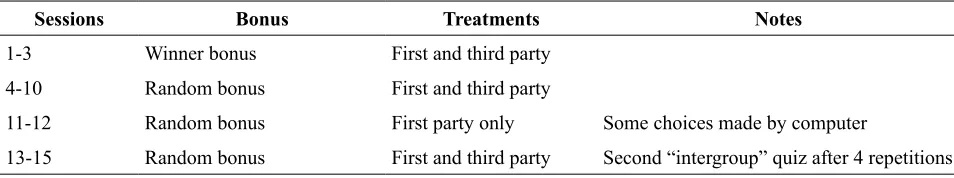
Sessions Bonus Treatments Notes
1-3 Winner bonus First and third party
4-10 Random bonus First and third party
11-12 Random bonus First party only Some choices made by computer
[image:12.595.57.534.82.171.2]13-15 Random bonus First and third party Second “intergroup” quiz after 4 repetitions
Table 1: Experimental sessions
The experiment took place in the computer laboratory of the University of Hamburg, using the
computer software zTree (Fischbacher 2007). Recruiting took place via ORSEE (Greiner 2004).
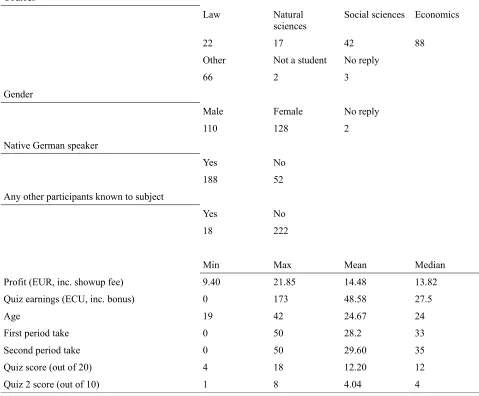
240 subjects participated on four separate days. Table 2 shows participants’ descriptive statistics,
including demographics. Sessions lasted about an hour. Average earnings per session were 14.48
EUR; the maximum session average was 16.45 EUR and the minimum session average was 13.02
Courses
Law Natural
sciences Social sciences Economics
22 17 42 88
Other Not a student No reply
66 2 3
Gender
Male Female No reply
110 128 2
Native German speaker
Yes No
188 52
Any other participants known to subject
Yes No
18 222
Min Max Mean Median
Profit (EUR, inc. showup fee) 9.40 21.85 14.48 13.82
Quiz earnings (ECU, inc. bonus) 0 173 48.58 27.5
Age 19 42 24.67 24
First period take 0 50 28.2 33
Second period take 0 50 29.60 35
Quiz score (out of 20) 4 18 12.20 12
[image:13.595.56.535.101.497.2]Quiz 2 score (out of 10) 1 8 4.04 4
Table 2: Descriptive statistics
Results
To identify group reciprocity, we run regressions of the following form:
Second round take = α + β F take + γ Same group + δ (F take×Same group) + Xθ+ ε. (1)
Here, β gives the partial correlation between F take, the amount taken by the feedback participant F,
different groups. The sum β + δ gives this correlation when F and P are in the Same group. δ is the
extra correlation caused by group membership, i.e., the level of group reciprocity. We expect δ > 0.
X is a vector of possible controls.
Our key results are as follows.
Result 1: Subjects showed first party group reciprocity in random bonus sessions, but not in winner
bonus sessions.
Result 2: Subjects did not group-reciprocate behavior towards third parties.
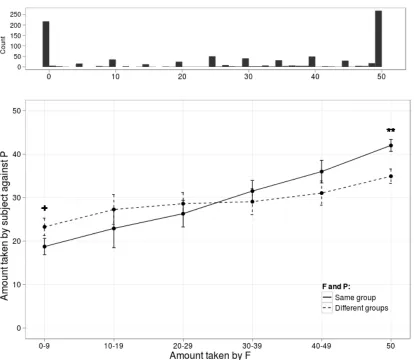
Figure 3 plots F take against Second round take in first party treatments during random bonus
sessions. As expected, the slope of Second round take on F take was about doubled when F and P
Figure 3: Mean observed subjects’ taking against P, by F’s taking, first party treatments, random bonus sessions. Bars show ± 1 s.d. + p < 0.10; ** p < 0.01. Top plot is histogram of amount taken by F.
Subjects’ choices within a session may not be independent. Therefore, to test for significance, we
first calculate values of β and β + δ in (1) separately for each session, and treat them as a single
matched pair of observations. This procedure is analogous to running non-parametric statistics on
session averages: here, instead of a session average, we are using a partial correlation. Within first
party treatments, β + δ was higher than β in 11 out of 12 random bonus sessions, but in no winner
bonus sessions. The null hypothesis is that β and β + δ are distributed with the same mean
(equivalently, the mean δ is 0). A signed-rank test on the matched pairs rejects this over all sessions
found no evidence for group reciprocity in third party treatments: β + δ was higher than β in 7 out
of 10 random bonus sessions and 2 out of 3 winner bonus sessions (p = 0.216, two-sided, over all
sessions).
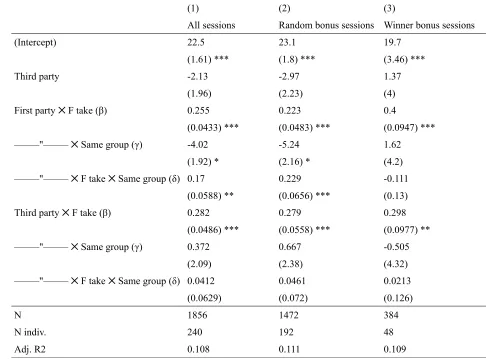
Next we examine individual behavior. Table 3 estimates (1) for both first and third party treatments.
Column 1 pools data from all sessions, columns 2 and 3 use random and winner bonus sessions
respectively. In first party treatments, the δ coefficient on F take×Same group is positive and
highly significant in random bonus sessions (and pooling the data), but not in winner bonus
sessions. In third party treatments, δ is small and insignificant. These results are robust to
alternative specifications.2
(1) (2) (3)
All sessions Random bonus sessions Winner bonus sessions
(Intercept) 22.5 23.1 19.7
(1.61) *** (1.8) *** (3.46) ***
Third party -2.13 -2.97 1.37
(1.96) (2.23) (4)
First party F take (β)✕ 0.255 0.223 0.4
(0.0433) *** (0.0483) *** (0.0947) ***
–––––"––––– Same group (γ)✕ -4.02 -5.24 1.62
(1.92) * (2.16) * (4.2)
–––––"––––– F take Same group (δ)✕ ✕ 0.17 0.229 -0.111
(0.0588) ** (0.0656) *** (0.13)
Third party F take (β)✕ 0.282 0.279 0.298
(0.0486) *** (0.0558) *** (0.0977) **
–––––"––––– Same group (γ)✕ 0.372 0.667 -0.505
(2.09) (2.38) (4.32)
–––––"––––– F take Same group (δ)✕ ✕ 0.0412 0.0461 0.0213
(0.0629) (0.072) (0.126)
N 1856 1472 384
N indiv. 240 192 48
[image:17.595.49.535.87.446.2]Adj. R2 0.108 0.111 0.109
Table 3: Estimates of group reciprocity, first and third party treatments. Dependent variable: amount taken by subjects against P in round 2 of the public goods game. Independent variables are amount taken by F in round 1 (F take), whether F and P were in the Same group, and the
interaction of these variables. Robust standard errors clustered by individual in parentheses. + p < 0.10; * p < 0.05; p < 0.01; *** p < 0.001.
To find correlates of group reciprocity, we focus on first party treatments in random bonus sessions.
First, we want to check our interpretation that the random bonus sessions caused group reciprocity
by making subjects feel that the inter-group distribution of income was unfair. Our post-quiz
questionnaire included a 1-5 Likert scale “Did you feel that the quiz was fair?” Answers were
Result 3: Subjects who perceived the quiz as unfair showed more group reciprocity.
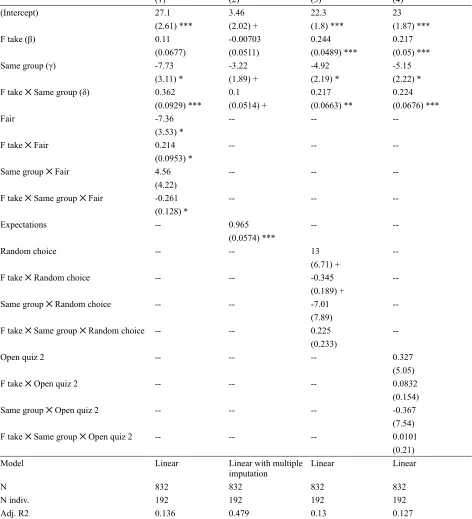
Column 1 of Table 4 interacts equation (1) with a dummy variable Fair, which is 1 if the subject
perceived the quiz as (very fair or) fair and 0 otherwise. The coefficient on F take×Same group×
Fair is negative and significant. Subjects who perceived the quiz as unfair were about
three-and-a-half times more group-reciprocal (0.362 versus 0.362 - 0.251 = 0.101). Including winner bonus
sessions in these regressions gives similar results3; controlling for fairness perceptions reduces but
does not eliminate the difference between sessions.
(1) (2) (3) (4)
(Intercept) 27.1 3.46 22.3 23
(2.61) *** (2.02) + (1.8) *** (1.87) ***
F take (β) 0.11 -0.00703 0.244 0.217
(0.0677) (0.0511) (0.0489) *** (0.05) ***
Same group (γ) -7.73 -3.22 -4.92 -5.15
(3.11) * (1.89) + (2.19) * (2.22) *
F take Same group (δ)✕ 0.362 0.1 0.217 0.224
(0.0929) *** (0.0514) + (0.0663) ** (0.0676) ***
Fair -7.36 -- --
--(3.53) *
F take Fair✕ 0.214 -- --
--(0.0953) *
Same group Fair✕ 4.56 -- --
--(4.22)
F take Same group Fair✕ ✕ -0.261 -- --
--(0.128) *
Expectations -- 0.965 --
--(0.0574) ***
Random choice -- -- 13
--(6.71) +
F take Random choice✕ -- -- -0.345
--(0.189) +
Same group Random choice✕ -- -- -7.01
--(7.89)
F take Same group Random choice✕ ✕ -- -- 0.225
--(0.233)
Open quiz 2 -- -- -- 0.327
(5.05)
F take Open quiz 2✕ -- -- -- 0.0832
(0.154)
Same group Open quiz 2✕ -- -- -- -0.367
(7.54)
F take Same group Open quiz 2✕ ✕ -- -- -- 0.0101
(0.21)
Model Linear Linear with multiple
imputation
Linear Linear
N 832 832 832 832
N indiv. 192 192 192 192
[image:19.595.63.535.68.587.2]Adj. R2 0.136 0.479 0.13 0.127
Result 4: Group reciprocity remained significant after controlling for subjects’ expectations of their
second round partner’s choices, and also when those choices were made randomly by the computer.
The feedback participant F’s actions might change the subject’s expectations about other members
of F’s group, including P. Subjects might then group-reciprocate because of these expectations, e.g.
if they wish to match P’s expected take, rather than because they directly wished to harm F’s group
members. This would be a form of statistical discrimination (Arrow 1971), which may be important
in explaining real-world group reciprocal behavior. However, capturing it in the laboratory is not
very informative, because it is unclear what expectations subjects ought to hold about correlations
of behavior among color group members.4
To see if group reciprocity was explained by expectations, column 2 of table 4 adds Expectations to
the basic regression. To increase efficiency, we multiply impute Expectations for repetitions where
it was not elicited. Expectations is highly significant, and the δ coefficient on F take×Same group
is approximately halved. However, it remains weakly significant.5
Subjects’ stated expectations may be affected by their intended play, for example due to
self-justification (Messé and Sivacek 1979). Therefore, we used a further method to control for
expectations. In sessions 11-12, some subjects’ second round choices were made randomly by a
computerized draw from the uniform distribution on {0,...,50}. Their partners knew this, and both
partners were paid as normal. Subjects’ expectations about P’s play ought to be unaffected by F’s
play in this case.6 Column 3 of Table 4 interacts equation (1) with a dummy variable Random
choice, which is 1 when P’s choice was random. The coefficient on F take × Same group ×
Random choice is actually positive, and δ plus this coefficient remains significantly positive
4 In fact, there were no significant correlations within groups. See the appendix. 5 The significance is robust to alternative specifications. See the appendix.
(p=0.050). We conclude that group reciprocity was not driven solely by expectations.
Result 5: Intergroup cooperation did not reduce group reciprocity.
The “contact hypothesis”, that intergroup contact can reduce prejudice, has a long pedigree within
social psychology (Sherif et al. 1961, Pettigrew 1998). Subsequent research has emphasized that
contact alone may not be enough; subjects may need to cooperate on a common task (Gaertner et al.
1993). We test whether group reciprocity can be decreased by an episode of cooperation between
different groups. In 3 sessions, after 4 repetitions a second quiz took place, in which some subjects
could cooperate with members of other groups. Column 4 of Table 4 interacts equation (1) with a
dummy Open quiz 2,for these subjects in repetitions 5-8. There is no evidence that this prevented
group reciprocity: all interaction terms are small and insignificant. These null results are not
definitive, since a longer interaction between groups might have broken down group reciprocity
more effectively. Nevertheless, they suggest that the tendency to reciprocate actions by outgroup
members is not easy to break down.
Another interesting non-result concerns gender. Some evolutionary theories of group identification
predict that men and women should possess different group psychology; in particular, men should
be more coalition-minded (Sidanius and Pratto 1999). Certainly, men are more directly active in
violent intergroup conflicts (Goldstein 2003). However:
Result 6: Men and women showed equal levels of group reciprocity.
Table 5 shows separate estimations of (1) for men and women. The results are strikingly similar.
The appendix tests the above results in a variety of specifications, and also details some others.
High-earning participants’ actions appear to have caused more group reciprocity, consistent with a
link between inequality and group reciprocity. Subjects with a strong in-group identity may have
been more group-reciprocal.
(1) (2)
Females Males
(Intercept) 24.5 21.5
(2.39) *** (2.7) ***
First party F take✕ 0.221 0.221
(0.0633) *** (0.0735) **
–––––"––––– Same group✕ -6.19 -4.42
(2.72) * (3.43)
–––––"––––– F take Same group✕ ✕ 0.248 0.223
(0.0856) ** (0.1) *
Third party -2.89 -2.8
(2.92) (3.41)
–––––"––––– F take✕ 0.28 0.26
(0.0717) *** (0.0866) **
–––––"––––– Same group✕ -0.201 0.995
(3.04) (3.74)
–––––"––––– F take Same group✕ ✕ 0.0793 0.0467
(0.0932) (0.11)
Model Linear Linear
Controls – –
N 776 696
N indiv. 101 91
[image:22.595.70.536.176.571.2]Adj. R2 0.128 0.0992
Table 5: Estimates of equation (1), random bonus sessions, males and females. Standard errors in parentheses, clustered by individual. + p < 0.10; * p < 0.05; p < 0.01; *** p < 0.001.
Conclusion
2005, 2010; Sen 2007). In this paper we move beyond static considerations of identity and consider
how groups react to each other. Our laboratory experiment allows us to confirm hypotheses from
the field in a controlled setting.
Many intractable conflicts are driven by cycles of intergroup revenge, in which uninvolved
bystanders are harmed for their fellow group members’ supposed actions. Some observers blame
not deep intergroup hatreds but self-interested politicians and hired thugs (Brass 1997; Kaufman
2001; cf. Glaeser 2005). Our results, however, show that humans reciprocate towards groups even
absent these factors; this psychology could provide the demand for conflict which politicians
exploit. We also showed the conditions for the motivation to operate. Uncooperative actions
triggered group reciprocity only in unfair contexts, when a randomly selected group received a large
reward.
It would be of interest to know how group reciprocity might evolve. One possibility is that it
developed as a mechanism for preserving intergroup peace: human ethnic groups mainly live at
peace with their neighbors (Fearon and Laitin 1996), whereas e.g. chimpanzee intergroup relations
appear violent by default (Wilson and Wrangham 2003). In the context of within-group alliances,
primates appear to reciprocate against attackers’ kin (Aureli at al. 1992), which suggests that the
underlying behavioral propensity may be quite ancient. But reciprocity in the field might also be
driven by strategic incentives, with subjects bringing the resulting behavioral heuristic into the
laboratory (Chagnon 1988; Hardin 1995; Fearon and Laitin 1996).
We draw consequences from our research for several fields. First, experiments on ethnic
heterogeneity have used one-shot interactions to reveal intergroup prejudice and discrimination
(Fershtman and Gneezy 2001; Habyarimana et al. 2009). Future work should examine intergroup
dynamics: how group members react to other groups’ behavior (cf. Bornhorst et al. 2009). Second,
example, counter-terrorist strategies which might deter a rational terrorist actor (Arce and Sandler
2005) may risk increasing revenge motivations and thereby terrorist recruitment.
Most importantly, there is a complex behavioral connection between perceived intergroup
unfairness and conflict. Much more needs to be done to understand how this works: what contexts
create breeding grounds for intergroup resentment, and how does this psychology play out in
particular environments? We look forward to more research on this topic. Field experiments have
examined the effect of violent conflict on preferences (Blattman 2009; Cassar et al. 2011; Voors et
al. 2012); further work could explore the behavioral factors behind individuals’ selection into
conflict. Intergroup dynamics may also be expressed in more routine forms of discrimination, as in
Shayo and Zussman’s (2011) finding that both Arab and Jewish judges in Israel favour their
in-group more after terrorist attacks. Group reciprocity could also affect team production and team
competition in firms. For instance, employees may reduce cooperation and “shirk” when they feel
that certain groups receive bonuses not available for other employees. In public economics,
perceptions that certain groups act corruptly or manipulate the tax system to their own advantage
may lead disadvantaged groups to behave non-cooperatively, possibly by evading taxes (cf. Alm
and Torgler 2006). Ultimately, understanding intergroup dynamics could help businesses and
References
Abbink, Klaus, Benedikt Herrmann. 2009. “Pointless Vedettas.”
http://papers.ssrn.com/sol3/papers.cfm?abstract_id=1468452
Akerlof, George A., and Rachel E. Kranton. 2005. “Identity and the Economics of Organizations.” Journal of Economic Perspectives 19 (1): 9–32.
Akerlof, George A., and Rachel E. Kranton. 2010. Identity Economics: How Our Identities Shape Our Work, Wages, and Well-Being. Princeton University Press.
Alm, James, and Benno Torgler. 2006. “Cultural differences and tax morale in the United States and Europe.” Journal of Economic Psychology 27: 224–246
Arce, Daniel G., Todd Sandler. 2005. “Counterterrorism: A Game-Theoretic Analysis.” Journal of Conflict Resolution, 49(2): 183-200.
Arrow, Kenneth J. 1972. “Some mathematical models of race discrimination in the labor market.”
Racial discrimination in economic life, pp.187–203.
Arrow, Kenneth J. 1998. “What Has Economics to Say About Racial Discrimination?” The Journal of Economic Perspectives 12 (2) (April 1): 91–100.
Aureli, Filippo, Roberto Cozzolino, Carla Cordischi, and Stefano Scucchi. 1992. “Kin-Oriented Redirection among Japanese Macaques: An Expression of a Revenge System?” Animal Behaviour,
44(2): 283–291.
Baldwin, Kate, John D. Huber. 2010. “Economic Versus Cultural Differences: Forms of Ethnic Diversity and Public Goods Provision,” American Political Science Revview, 104(4): 644-662.
Bauerlein, Marc. 2001. Negrophobia: A Race Riot in Atlanta, 1906. New York: Encounter Books.
Bernhard, Helen, Urs Fischbacher, and Ernst Fehr. 2006. “Parochial Altruism in Humans.”
Nature, 442(7105): 912-915.
Blattman, Christopher. 2009. “From Violence to Voting: War and Political Participation in Uganda.” American Political Science Review, 103(2): 231–247.
Bornhorst, Fabian, Andrea Ichino, Oliver Kirchkamp, Karl H. Schlag, and Eyal Winter. 2010. “Similarities and Differences When Building Trust: The Role of Cultures.” Experimental
Economics 13 (3): 260–283.
Bornstein, Gary. 1992. “The Free-rider Problem in Intergroup Conflicts over Step-level and Continuous Public Goods.” Journal of Personality and Social Psychology 62 (4): 597.
Personality and Social Psychology Review 7 (2): 129–145.
Brass, Paul R. 1997. Theft of an Idol: Text and Context in the Representation of Collective Violence. Princeton, NJ: Princeton University Press.
Cassar, Alessandra, Pauline Grosjean, and Sam Whitt. 2011. “Lost in Transition? How Civil War Violence Can Impair the Foundations for Market Development – The Case of Tajikistan.” www.cesifo-group.de/link/vsi11_ec_Cassar.pdf .
Cederman, Lars-Erik, Nils B. Weidmann, and Kristian S. Gleditsch. 2011. “Horizontal Inequalities and Ethno-Nationalist Civil War: A Global Comparison.” American Political Science Review, 105(3):478-495.
Chagnon, Napoleon A. 1988. “Life Histories, Blood Revenge, and Warfare in a Tribal Population.”
Science, 239(4843): 985–992.
Chen, Yan and Sherry X. Li. 2009. “Group Identity and Social Preferences.” American Economic Review, 99(1): 431-457.
Currarini, Sergio and Friederike Mengel. 2012. “Identity, Homophily and In-Group Bias.”
FEEM Working Paper 37.
de Cremer, David and Mark van Vugt. 1999. “Leadership in Social Dilemmas: The Effects of Group Identification on Collective Actions to Provide Public Goods.” Journal of Personality and Social Psychology, 76(4): 587-599.
Dufwenberg, Martin, Uri Gneezy, Werner Güth, and Eric Van Damme. 2001. “Direct vs indirect reciprocity: an experiment.” Homo Oeconomicus 18: 19-30.
Ellemers, Naomi, Pauline Kortekaas, and Jaap W. Ouwerkerk. 1999. “Self-Categorisation, Commitment to the Group and Group Self-Esteem as Related but Distinct Aspects of Social Identity.” European Journal of Social Psychology, 29(2-3): 371-389.
Fearon, James D. and David D. Laitin. 1996. “Explaining Interethnic Cooperation.” American Political Science Review, 90(4): 715-735.
Fehr, Ernst and Simon Gächter. 2000. “Cooperation and Punishment in Public Goods Experiments.” American Economic Review, 90(4): 980-994.
Fershtman, Chaim and Uri Gneezy. 2001. “Discrimination in a Segmented Society: An Experimental Approach.” Quarterly Journal of Economics, 116(1): 351–377.
Fischbacher, Urs. 2007. “z-Tree: Zurich Toolbox for Ready-Made Economic Experiments.”
Experimental Econics, 10(2): 171-178.
in a Social Dilemma.” Journal of Conflict Resolution, 32(1): 162-180.
Gaertner, Samuel L., John F. Dovidio, Phyllis A. Anastasio, Betty A. Bachman, and Marcy C. Rust. 1993. “The Common Ingroup Identity Model: Recategorization and the Reduction of Intergroup Bias.” European Review of Social Psychology, 4(1): 1-26.
Gaertner, L., Iuzzini, J., and O’Mara, E. M., 2008. “When rejection by one fosters aggression against many: multiple-victim aggression as a consequence of social rejection and perceived groupness.” Journal of Experimental Social Psychology 44: 958-970.
Glaeser, Edward. L. 2005. “The Political Economy of Hatred.” Quarterly Journal of Economics, 120(1): 45–86.
Goette, Lorenz, David Huffman, and Stephan Meier. 2006. “The Impact of Group Membership on Cooperation and Norm Enforcement: Evidence using Random Assignment to Real Social Groups.” American Economic Review 96(2): 212-216.
Goldstein, Joshua S. 2003. War and Gender: How Gender Shapes the War System and Vice Versa.
Cambridge, MA: Cambridge University Press.
Greiner, Ben. 2004. “The Online Recruitment System ORSEE 2.0 – A Guide for the Organization of Experiments in Economics.” University of Cologne Working Papers Series in Economics, 10.
Guala, Francesco. 2012. “Reciprocity: Weak or strong? What punishment experiments do (and do not) demonstrate.” Behavioral and Brain Sciences, 35(1): 1.
Habyarimana, James P., Macartan Humphreys, Daniel N. Posner, and Jeremy M. Weinstein.
2009. Coethnicity: Diversity and the Dilemmas of Collective Action, New York: Russell Sage Foundation Publications.
Hardin, Russel. 1995. One For All: The Logic of Group Conflict. Princeton, NJ: Princeton University Press.
Hargreaves-Heap, Shaun, and Daniel J. Zizzo. 2009. “The Value of Groups.” American Economic Review, 99(1): 295-323.
Hoff, Karla, Mayuresh Kshetramade, and Ernst Fehr. 2011. “Caste and Punishment: The Legacy of Caste Culture in Norm Enforcement.” The Economic Journal 121 (556): F449–F475.
Horowitz, Donald N. 1985. Ethnic Groups in Conflict. Berkeley: University of California Press.
Horowitz, Donald N. 2001. The Deadly Ethnic Riot. Berkeley: University of California Press.
Keynes, John M. 1922. The Economic Consequences of the Peace. Los Angeles, CA: IndoEuropean.
Lickel, Brian, Norman Miller, Douglas M. Stenstrom, Thomas F. Denson, and Toni Schmader.
2006. “Vicarious Retribution: The Role of Collective Blame in Intergroup Aggression.” Personality and Social Psychology Review, 10(2): 372-703.
Messé, Lawrence A., and John M. Sivacek. 1979. “Predictions of Others’ Responses in a Mixed-Motive Game: Self-Justification or False Consensus?” Journal of Personality and Social Psychology, 37(4): 602-607.
Miguel, Edward, and Mary K. Gugerty. 2005. “Ethnic Diversity, Social Sanctions, and Public Goods in Kenya.” Journal of Public Economics, 89(11-12): 2325-2368.
Mummendey, Amélie, Bernd Simon, Carsten Dietze, Melanie Grünert, Gabi Haeger, Sabine Kessler, Stephan Letgen, and Stefanie Schäferhoff. 1992. “Categorization is Not Enough: Intergroup Discrimination in Negative Outcome Allocations.” Journal of Experimental Social Psychology, 28: 125-144.
Nowak, Martin A., and Karl Sigmund. 2005. “Evolution of Indirect Reciprocity.” Nature,
437(4131): 1291-1298.
Nowak, Martin A., and Sébastien Roch. 2007. “Upstream Reciprocity and the Evolution of Gratitude.” Proceedings of the Royal Society B: Biological Sciences, 274(1610): 605-610.
Pettigrew, Thomas F. 1998. “Intergroup Contact Theory.” Annual Review of Psychology, 49: 65-85.
Rubin, Donald B. 1976. “Inference and Missing Data.” Biometrika, 63(3): 581-592.
Shayo, M., and A. Zussman. 2011. “Judicial Ingroup Bias in the Shadow of Terrorism.” The Quarterly Journal of Economics 126 (3): 1447–1484.
Sherif, Muzafer, O. J. Harvey, B. Jack White, William R. Hood, and Carolyn W. Sherif. 1961.
The Robbers Cave Experiment: Intergroup Conflict and Cooperation. Scranton, PA: Wesleyan University Press.
Sen, Amartya. 2007. Identity and Violence: The Illusion of Destiny. W. W. Norton & Company.
Sidanius, Jim and Felicia Pratto. 1999. Social Dominance: An Intergroup Theory of Social Hierarchy and Oppression. Cambridge, MA: Cambridge University Press.
Tajfel, Henri, M. G. Billig, R. P. Bundy, and Claude Flament. 1971. “Social Categorization and Intergroup Behavior.” European Journal of Social Psychology, 1(2): 149-178.
Tambiah, Stanley J. 1996. Leveling Crowds: Ethnonationalist Conflicts and Collective Violence in South Asia. Berkeley: University of California Press.
Wilson, Michael L. and Richard W. Wrangham. 2003. “Intergroup Relations in Chimpanzees.”
Annual Review of Anthropology, 32: 363–392.
World Bank. 2011. The World Development Report 2011:Conflict, Security, and Development. Washington D.C.: The World Bank.
Voors, Maarten, Eleonora E.M. Nilesen, Philip Verwimp, Erwin H. Bulte, Robert Lensink, and Daan P. Van Soest. 2012. “Violent Conflict and Behavior: A Field Experiment in Burundi.”
American Economic Review, 102(2):941-964.
For online publication: Appendix
1. Experimental procedure details
• Before experiment
• Quiz questions
• Eliciting expectations
• Second quiz
2. Supplementary analysis of main results
• Expectations
• Fairness
• The second quiz and the contact hypothesis 3. Further results
1. Inequality
1. Experimental details
Before experiment
After entering the lab, subjects drew a number assigning them to their seats. In 5 sessions, seats
were located at desks surrounded by blinds, effectively creating a private cubicle. In the remaining
10 sessions, seats were placed in a separate cabin which could be closed with a curtain. At each
seat, subjects found a copy of the instructions and a paper receipt slip to be used for their payment
next to the computer screen. After all subjects took their place, instructions were read out loud. (The
information provided in the instructions covered the structure of the experiment, a complete
description of the games to be played and payment structures. An English translation of the
instructions can be found below.)
Quiz questions
The questions in the quiz were chosen to provoke communication, i.e. we expected not everybody
to individually be able to answer correctly, but possibly so within the group. The average number of
chat entries per group were 81, i.e., roughly, each subject made one chat entry per question. In order
to avoid frustration, simpler questions were also included. On average, 61% of the questions were
1. Which term does not denote a whirlwind? a) Landspout b) Hurricane
c) Typhoon d) Blizzard
11. In which Hitchcock movey can the main character not stand to see the color red?
a) Marnie b) Vertigo
c) North by Northwest d) The Birds 2. In the fairytale of the Brothers Grimm, the sister of
Snow White is...
a) Rapunzel b) Rose Red c) Snow Drop d) Pitch Black
12. Before taking up his position as President of the Federal Republic of Germany, Horst Köhler, was head of the
a) IWF b) WTO
c) World Bank d) European Central Bank 3. What is the official language in Brasil?
a) Spanish b) Portuguese c) English d) French
13. In which region are the remains of the antic city of Pergamon to be found?
a) Cyprus b) Crete c) Turkey d) Italy 4. What is a circular note of the Pope called?
a) Encyclical b) Encyclopedia c) Enzyme d) Encephalitis
14. Which Indian movie was awarded the “Oscar” in 2009 for best movie?
a) Slumdance Billionaire b) Squaredance Millionaire c) Slumdog Millionaire d) Hotdog Billionaire 5. What is the correct term for a direct hook-up of positive
and negative poles of a voltage supply? a) Short b) Direct connection
c) Short cut d) Arc of suspense
15. Which German Basketball star recently won his first title in the american professional league NBA?
a) Dirk Bach [A well-known German Comedian] b) Dirk Nowitzki
c) Dirk Bauermann [Head Coach of German National Team Basketball]
d) Dirk Niebel [German Minister for Foreign Aid] 6. Which religion does not respect guardian angels?
a) Christianity b) Judaism c) Islam d) Buddhism
16. In which city does the UNESCO have its headquarters?
a) London b) New York c) Paris d) Brussels 7. Which oil is used for the production of cosmetics?
a) Palm oil b) Heavy oil c) Penetrating oil d) Waste oil
17. With whom did Sir Edmund Hillary first reach the summit of Mount Everest?
a) Nasreddin Hodsha b) Nursay Pimsorn c) Tensing Norgay d) Anrindranath Singh 8. On which island did Christoph Columbus land first
during his Atlantic journey in 1492? a) Jamaica b) Cuba
c) San Salvador d) Hispaniola
18. Who was never emperor of the Holy Roman Empire of German Nations?
a) Louis the Bavarian b) Henry the Lion c) Otto the Great d) Frederick Barbarossa 9. What is the name of the traditional horse race in the city
of Siena? a) Palio b) Fermo c) Lugo d) Legnano
19. What is the name of a famous sexual therapist? [Known in Germany from the most popular teenage magazine]
a) Dr. Spring b) Dr. Sommer c) Dr. Fall d) Dr. Winter 10. Which term does not denote a Greek style of columns?
a) Dorian b) Corinthian c) Ionian d) Cretan
20. Against which city did Bonn succeed in the elections on where the capital of Germany should be located in 1949?
[image:31.595.61.534.65.648.2]a) West-Berlin b) Frankfurt / Main c) Kassel d) Hannover
Directly after the quiz, subjects answered a brief questionnaire containing three questions. We asked
these early to ensure that behavior in the public goods games did not affect subjects’ answers.
Answers could be given by selecting a point on a 5-point Likert scale. Subjects were asked:
1) How much did you enjoy the quiz? (“Not at all” = 1, “Very much” = 5)
2) How well do you think your group performed in the quiz? (“Very badly” = 1, “Very well” =
5)
3) How fair did you think the quiz was? (“Not at all fair” = 1, “Very fair” = 5)
A final questionnaire ended the experiment. The questionnaire included questions on gender, age,
major subject, native language, whether any of the other subjects were personally acquainted, and
the possibility to comment on the experiment. It also included open questions on what subjects
believed the experiment to be about and a brief explanation of their choices of the course of the
experiment. Mostly, subjects thought the experiment to be about the influence of income on
decision behavior, the correlation of certain behaviors with intelligence, or social dilemmas. Only 3
of the 240 subjects mentioned objectives related to group reciprocity (“treat colors differently”,
“memorize behavior according to color”, “do decisions of un-encountered others affect my
behavior”). To get indicators of ingroup identity and fairness we added three statements which
subjects could agree/disagree with on a 7-point Likert scale:
– I felt committed to my group
– I think the experiment was fair towards all (color) groups
– I enjoyed the experiment
Perceptions of other groups were also elicited by Likert scales. Statements read as follows (each
– Members of the green/orange/purple/brown group worked together well as a team
– Members of the green/orange/purple/brown group behaved fairly towards other groups
Following the questionnaire, subjects were given information on which round was chosen for
payment and their total earnings. Subjects were called up individually by seat number (after the
respective previous subject had left the lab) and signed a receipt slip for the money.
Eliciting expectations
In sessions 1-10 and 13-15, subjects were asked about their expectations on the choice of the
matched partner in order to check whether individuals' choices were influenced by the expectations
on the matched partner's behavior. So as to keep the experiment simple and fast-moving,
expectations were only elicited in repetitions 2 and 7. Expectations were incentivized in that the
difference between the indicated expectation and the true amount withdrawn by the partner
determined the size of an extra bonus to be gained. Table A2 illustrates how the possible boni were
determined.
Difference 0-4 5-9 10-14 15-19 20-24 25-29 30-34 35-39 40-44 45-49 50
Bonus 10 ECU 9 ECU 8 ECU 7 ECU 6 ECU 5 ECU 4 ECU 3 ECU 2 ECU 1 ECU 0 ECU
Table A2: Boni for expectations elicitation
Second quiz
Sessions 13-15 contained a second quiz after the first 4 repetitions of the public goods game, in
which some individuals could cooperate with members of other groups. On average, approximately
126 chat entries were made per session, i.e. 32 per group or 3.2 chat entries per question. The
1. A classic silent movie by Sergey Eisenstein is titled “The Battleship... a) Potemkin b) Rasputin c) Iljushin d) Putin
6. Most Nepalese share the religion of a) Islam
b) Buddhism c) Hinduism d) Christianity
2. Which concordat ended the conflict of investitures in 1122?
a) Concordat of Konstanz b) Concordat of Worms c) Concordat of Mainz d) Concordat of Speyer
7. What is the name of the ancient God of Fire? a) Cronus
b) Helios c) Hephaistos d) Eos
3. What is acrophobia? a) Fear of heights b) Fear of spiders c) Fear of aggression d) Fear of pain
8. Which return did the GDR provide for the Billion D-Mark credit of the FRG?
a) Deinstallation of spring guns on the border b) Release of political prisoners
c) Exit permits for all occupiers of the embassy d) Reduction of the number of strategic missiles 4. Which country does not have a nuclear power plant?
a) Norway b) Switzerland c) Belgium d) Netherlands
5. Who wrote “Nathan the Wise”? a) Goethe
b) Kleist c) Schiller d) Lessing 5. Which German city currently has less than 1 million
inhabitants? a) Cologne b) Munich c) Berlin
d) Frankfurt / Main
6. Who was elected president of the Czech Republic in 2003?
[image:34.595.60.537.83.451.2]a) Vaclav Havel b) Vaclav Klaus c) Wladimir Spidla d) Wladimir Putin
2. Supplementary analyses of main results
We first explore the basic patterns in our data. Figure A1 shows the distribution of amounts taken.
There are many observations of both 0, the minimum possible take, and 50, the maximum, which
means that tobit regressions may be appropriate. Figure A2 shows mean amounts taken over all
sessions, in each of the 8 repetitions. As is typical for a public goods game, amounts taken increased
[image:35.595.86.492.302.567.2]over the course of the experiment.
Figure A2: amount taken, repetitions 1-8
Subjects’ behavior within a single session may not be independent, because subjects may influence
each other, either through their play over the repeated rounds with rematching, or via chat during
the quiz. We use two alternative strategies to deal with this. First, we treat each session as a single
independent observation and run non-parametric tests on session-level statistics. Second, we run
regressions on individual decisions, cluster standard errors by individual, and include covariates in
order to control explicitly for the history of play. An alternative approach would be to cluster
standard errors at the session level. We believe that errors are likely to be most strongly correlated
within individuals, at least when individual-level fixed effects are not included; in any case, the
coefficient on F take ×Same group remains highly significant if we cluster at session level (results
available on request).
At session level, Figures A3 and A4 show the coefficient on F take ×Same group in equation (1),
estimated by simple linear regression without controls for each session, separately for first and third
are significantly different from 0 (equivalently, whether the coefficients on F take are significantly
larger when Same group is 1: thus, the test uses matched pairs of observations from each session for
Same group = 1 and Same group = 0). Table A4 shows two-sided p-values for first and third party
treatments in winner bonus and random bonus sessions. It also shows tests pooling all sessions. In
third party treatments, δ is never significantly different from 0, while in first party treatments δ is
significantly different from 0, whether we pool all sessions or examine random bonus sessions
[image:37.595.58.518.280.574.2]alone.
Figure A4: Per-session estimates of δ, third party treatments
Sessions
Treatments Winner bonus Random bonus All sessions
First party 0.25 0.00928 ** 0.0353 *
Third party 1 0.16 0.216
Table A4 : Wilcoxon-Mann-Whitney tests of δ=0. Two sided p-values are shown. + p < 0.10; * p < 0.05; ** p< 0.01; *** p < 0.001.
Next, we take individual decisions as the unit of observation. We would like to know if we can pool
our different session types for analysis. As a first gauge of this, we examine the δ coefficient on F
type of session. In first party treatments, δ is not significantly different between the different
sub-types of random bonus session (sessions 4-10 vs 11-12: p=0.171; 4-10 vs 13-15: p=0.395, 11-12 vs
13-15: p=0.622), but it is significantly different between the winner bonus sessions and sessions
11-12 (p=0.0146)and sessions 13-15 (p=0.0395), and narrowly misses significance at the 10% level
between the winner bonus sessions and sessions 4-10 (p=0.107). This suggests that we can pool the
random bonus sessions without undue violence to the data. In third party treatments, δ is always
(1) (2) (3) (4)
Sessions 1-3 Sessions 4-10 Sessions 11-12 Sessions 13-15
(Intercept) 19.7 21.9 27.2 22
(3.46) *** (2.45) *** (3.76) *** (3.45) ***
First party F take✕ 0.4 0.25 0.102 0.271
(0.0947) *** (0.0656) *** (0.0972) (0.0994) **
–––––"––––– Same group✕ 1.62 -2.17 -10.9 -7.54
(4.2) (2.92) (4.96) * (4.11) +
–––––"––––– F take Same group✕ ✕ -0.111 0.151 0.381 0.285
(0.13) (0.0879) + (0.146) ** (0.131) *
Third party 1.37 -0.333 – -4.87
(4) (2.78) (3.81)
–––––"––––– F take✕ 0.298 0.244 – 0.35
(0.0977) ** (0.0671) *** (0.104) ***
–––––"––––– Same group✕ -0.505 1.18 – -1.09
(4.32) (2.82) (4.45)
–––––"––––– F take Same group✕ ✕ 0.0213 0.0312 – 0.0865
(0.126) (0.0851) (0.137)
Model Linear Linear Linear Linear
Controls – – – –
N 384 896 192 384
N indiv. 48 112 32 48
[image:40.595.63.539.84.481.2]Adj. R2 0.109 0.0915 0.102 0.169
Table A5: Estimates of equation (1) for each session type. Standard errors in parentheses, clustered by individual. + p < 0.10; * p < 0.05; p < 0.01; *** p < 0.001.
Next, we pool data from all the random bonus sessions, and test equation (1) in various
specifications. Column 1 of Table A6 reports an OLS regression without controls. Column 2 adds in
subject and repetition dummies (in econometric language, individual and time fixed effects). The
subject dummies control for individual-level variation in baseline propensity to take: in effect, this
regression uses the correlation between changes in F take and Same group and changes in
time. Using fixed effects has advantages and disadvantages. Clearly there is much heterogeneity
between individuals, and this might be correlated with the propensity to group-reciprocate; fixed
effects mitigate this worry. On the other hand, using fixed effects throws away the information
contained in differences between individuals, which can be substantial. Column 3 removes the fixed
effects, but adds a vector of controls reflecting the history of play experienced by each individual.
Specifically, we add the amount taken by the subject’s partners in each round of the previous
repetition, as well as the amount taken by the subject’s feedback participant (F) in the previous
repetition. (Further lags proved insignificant.) We also add Last take same group, which is the
amount taken by the subject’s last partner (in any round and repetition) who was in the same group
as the current second-round partner P. The lagged variables in general have the expected sign, but
are not strongly significant. However, the coefficient on Last take same group is large and highly
significant in both first and third party treatments. This suggests to us that even in third party
treatments, subjects were directly group-reciprocating the previous behavior of others towards
them. The identification of group reciprocity is not clean, however, because subjects cannot be sure
that the last partner was a different person from the current P. In later tables, we use the same
history variables, but omit their coefficients for the sake of clarity.
The δ coefficient on F take × Same group remains almost unchanged in all these specifications, and
is highly significant throughout for first party treatments. The final column estimates (1) using a
tobit functional form, censoring the data at 0 and 50. Here the δ coefficient is larger, because the
(1) (2) (3) (4)
(Intercept) 23.1 – 15.1 20.5
(1.8) *** (2.62) *** (3.44) ***
First party F take✕ 0.223 0.0277 0.135 0.459
(0.0483) *** (0.0368) (0.0518) ** (0.103) ***
–––––"––––– Same group✕ -5.24 -4.05 -6.85 -13.2
(2.16) * (1.73) * (2.51) ** (5.12) *
–––––"––––– F take Same group✕ ✕ 0.229 0.187 0.257 0.597
(0.0656) *** (0.051) *** (0.0725) *** (0.152) ***
Third party -2.97 -2.58 -3.04 -7.68
(2.23) (1.87) (3.3) (5.45)
–––––"––––– F take✕ 0.279 0.0859 0.146 0.637
(0.0558) *** (0.0417) * (0.0569) * (0.12) ***
–––––"––––– Same group✕ 0.667 1.19 -1.05 0.843
(2.38) (1.95) (2.71) (5.67)
–––––"––––– F take Same group✕ ✕ 0.0461 0.00627 0.123 0.121
(0.072) (0.0565) (0.0774) (0.165)
First party Lag round 1 take✕ – – 0.139 –
(0.0576) *
–––––"––––– Lag round 2 take✕ – – 0.0406 –
(0.0466)
–––––"––––– Lag F take✕ – – 0.0861 –
(0.056)
–––––"––––– Last take same group✕ – – 0.142 –
(0.0436) **
Third party Lag round 1 take✕ – – 0.0284 –
(0.0552)
–––––"––––– Lag round 2 take✕ – – 0.0771 –
(0.0501)
–––––"––––– Lag F take✕ – – 0.146 –
(0.0516) **
–––––"––––– Last take same group✕ – – 0.201 –
(0.0477) ***
Model Linear Linear Linear Tobit
Controls – Twoway FE History –
N 1472 1472 1072 1472
N indiv. 192 192 192 192
Adj. R2 0.111 0.0279 0.218 –
[image:42.595.63.537.84.653.2]LogLik – – – -3880
We include three further checks of the basic result. First, we split our data up by repetition,
analyzing repetitions 1-4 separately from repetitions 5-8. Some behaviors, such as contributions to
public goods games, change over repetitions in repeated experiments. Similarly, it could be that
group reciprocity is only observed early on, and less so or not at all in later repetitions as subjects
gain experience. If so, group reciprocity would not be an “equilibrium phenomenon”, although
out-of-equilibrium behavior might still be interesting and important. Columns 1-2 of Table A7 estimate
equation (1) separately for early and late repetitions. If anything results are stronger in later
repetitions, although the difference between the (first party) δ coefficients is not significant
(1) (2)
Repetitions 1-4 Repetitions 5-8
(Intercept) 23.1 23.5
(2.43) *** (2.35) ***
First party F take✕ 0.17 0.257
(0.0717) * (0.0638) ***
–––––"––––– Same group✕ -4.6 -6
(3.01) (3.31) +
–––––"––––– F take Same group✕ ✕ 0.174 0.268
(0.0979) + (0.0929) **
Third party -7.3 0.877
(3.19) * (3.09)
–––––"––––– F take✕ 0.384 0.183
(0.081) *** (0.0717) *
–––––"––––– Same group✕ 3.57 0.394
(3.31) (3.76)
–––––"––––– F take Same group✕ ✕ -0.151 0.123
(0.109) (0.102)
Model Linear Linear
Controls – –
N 736 736
N indiv. 192 192
[image:44.595.64.537.58.451.2]Adj. R2 0.0851 0.127
Table A7: Estimates of equation (1), random bonus sessions, early and late repetitions. Standard errors in parentheses, clustered by individual. + p < 0.10; * p < 0.05; p < 0.01; *** p < 0.001.
The second check is to split up decisions by whether the decision-taking subject herself was in the
same group as the other subject on her side (i.e., whether the Own same group dummy was 1 or 0).
In particular, this might make a difference for indirect group reciprocity: subjects may
group-reciprocate against behavior towards somebody else in their group, but not behavior towards
someone not in their group. However, direct group reciprocity could also be affected, for example if
feelings of group identity get stronger when 2 subjects of one group face 2 subjects of another
party treatments, and the difference between δ coefficients is not significant (first party, p=0.347;
(1) (2)
Own same group Own different group
(Intercept) 23.3 22.8
(2.39) *** (2.32) ***
First party F take✕ 0.189 0.26
(0.0665) ** (0.0671) ***
–––––"––––– Same group✕ -6.55 -3.85
(2.95) * (3.05)
–––––"––––– F take Same group✕ ✕ 0.288 0.166
(0.0899) ** (0.0944) +
Third party -3.01 -2.9
(3.04) (3.29)
–––––"––––– F take✕ 0.256 0.303
(0.0771) *** (0.0772) ***
–––––"––––– Same group✕ -1.84 3.26
(3.29) (3.41)
–––––"––––– F take Same group✕ ✕ 0.134 -0.0465
(0.0997) (0.104)
Model Linear Linear
Controls – –
N 736 736
N indiv. 192 192
[image:46.595.63.538.85.478.2]Adj. R2 0.122 0.102
Table A8: Estimates of equation (1), random bonus sessions, Own same group 1 or 0. Standard errors in parentheses, clustered by individual. + p < 0.10; * p < 0.05; p < 0.01;
*** p < 0.001.
Lastly, we replace the linear specification by a set of 6 dummies, 1 each for values of F take
between 0-9, 10-19, 20-29, 30-39, 40-49 and 50. These are then interacted with Same group.The
field literature has many more examples of negative group reciprocity – returning evil for evil –
than positive group reciprocity, so we expected to see larger and more significant interaction terms
at high values of F take. This is broadly confirmed in Table A9, which shows the results, using the
(1) (2) (3) (4)
(Intercept) 23.3 – 15.2 21.4
(1.91) *** (2.69) *** (3.58) ***
F take 10-19 4 -1.24 4.47 7.92
(3.79) (3.15) (4.9) (10.4)
F take 20-29 5.33 -0.15 1.26 9.32
(3.28) (2.65) (4.42) (8.53)
F take 30-39 5.8 0.739 3.65 8.93
(3.53) (2.89) (4.71) (7.95)
F take 40-49 7.78 1.09 3.63 15.4
(3.22) * (2.58) (3.46) (6.86) *
F take 50 11.7 0.805 7.6 24.2
(2.54) *** (2.05) (2.69) ** (5.43) ***
F take 0-9 Same group✕ -4.54 -4.52 -7.72 -11.8
(2.33) + (1.92) * (2.72) ** (5.42) *
F take 10-19 Same group✕ -4.37 -3.05 -1.77 -4.18
(5.02) (4.1) (6.25) (13.5)
F take 20-29 Same group✕ -2.3 1.56 2.58 -4.27
(4.1) (3.28) (5.21) (10.5)
F take 30-39 Same group✕ 2.44 3.12 2.05 5.6
(3.9) (3.21) (4.99) (9.36)
F take 40-49 Same group✕ 4.95 3.77 6.58 7.41
(3.61) (2.93) (3.87) + (8.35)
F take 50 Same group✕ 7.1 5.55 4.82 22.5
(2.26) ** (1.92) ** (2.52) + (5.91) ***
Model Linear Linear Linear Tobit
Controls – Twoway FE History –
N 832 832 592 832
N indiv. 192 192 192 192
Adj. R2 0.128 0.0398 0.229 –
[image:47.595.61.540.96.626.2]LogLik – – – -2170
Table A9: Estimates of equation (1), random bonus sessions, first party treatments, dummies for F take. Standard errors in parentheses, clustered by individual for columns 1-3. + p < 0.10; * p <