http://www.scirp.org/journal/jgis ISSN Online: 2151-1969
ISSN Print: 2151-1950
10-Years Land Use Changes Decrease
Landscape Integrity in a Brazilian
Hydrographic Basin
Luciana S. Estevam
1*, Julia Arieira
2, Peter Zeilhofer
3, Débora F. Calheiros
41Enviromental Sciences, Universidade de Cuiabá (UNIC), Cuiabá, Brazil
2Departamento de Ciências Ambientais, Universidade de Cuiabá (UNIC),Cuiabá, Brazil
3Instituto de Geografia, História e Documentação, Departamento de Geografia, Universidade Federal de Mato Grosso (UFMT), Cuiabá, Brazil
4Instituto de Geografia, História e Documentação, Departamento de Geografia, Universidade Federal de Mato Grosso (UFMT), Cuiabá, Brazil. Embrapa Pantanal, Corumbá, Brazil
Abstract
Changes in land use associated with the suppression of native vegetation can greatly alter the landscape configuration, affecting biodiversity and environ-mental services availability. This study analyzes how changes in land use affect landscape patterns of vegetation remnant over a 10 year period. We quantified spatial landscape patterns throughout a hydrographic basin for the years 2002, 2008, 2010 and 2012, using nine landscape metrics. An indicator of integrity was used to details the transformation processes occurring in the basin that could be used to monitor the impact of landscape changes and its spatial pat-terning. Results showed that over this decade, extension of farming activities reduced the cover of native vegetation by 4.4%, with grassy-woody savanna, wooded savanna and forested savanna impacted especially strongly. Suppres-sion of vegetation across this period reduced the size of fragments and their connectivity. The landscape fragmentation indicator indicated that the frag-mentation pattern varied spatially, with the upland areas along river headwa-ters, being most fragmented. Areas of floodplains vegetation, belonged to the Pantanal Wetland, although in better integrity states, are the most threatened by current pressures of land use change. An intense recovery program for headwaters and aquifer recharge areas, as well as riparian forests, is recom-mended to avoid the future depletion of water production. Besides, we also recommend the maintenance and recovering of the connectivity of the current remaining patches of natural vegetation corridors and elaboration of specific laws that incoporate the consolidated scientific knowladge about wetland ecosystem functioning, like the Pantanal.
How to cite this paper: Estevam, L.S., Arieira, J., Zeilhofer, P. and Calheiros, D.F. (2017) 10-Years Land Use Changes De-crease Landscape Integrity in a Brazilian Hydrographic Basin. Journal of Geographic Information System, 9, 221-243.
https://doi.org/10.4236/jgis.2017.92014
Received: February 22, 2017 Accepted: April 27, 2017 Published: April 30, 2017
Copyright © 2017 by authors and Scientific Research Publishing Inc. This work is licensed under the Creative Commons Attribution International License (CC BY 4.0).
Keywords
Connectivity, GIS, Metrics, Catchment Area, Fragmentation, Remnant Vegetation
1. Introduction
Changes in land use associated with the suppression of native vegetation are of great concern to human populations because of its consequences for biodiversity loss, climate change, carbon sequestration, food provision, and other ecosystem services, such as maintaining the quality and availability water [1]. Recently, the speed at which these changes occurred, associated with technological develop-ments and economic interests, is leading the world to an unsustainable trajectory [2].
Among the biggest changes associated with the removal of vegetation cover is the fragmentation of native vegetation [3] [4]. The fragmentation process is represented by the increase in the number of fragments or remnant patches in a landscape [5]. Furthemore, the loss of native vegetation can affect the spatial structure of the landscape in various ways. Loss of the same amount of remain-ing area, for example, can result in an increased number of fragments, as well as in no changes in the landscape configuration. One large remaining contiguous patch can become numerous small and isolated fragments [6]. The direction of these changes is not easy to predict because it depends on several factors that act integrally, including the biophysical heterogeneity of the environment and the socio-economic and political influences on the human activities transforming the landscape [7][8].
The impacts of habitat fragmentation on biodiversity conservation and man-agement have been widely discussed [3][6][9][10]. Fragmentation can result in the formation of landscapes with little diversity in terms of habitat and species [3]. A new landscape mosaic composed of remnants of native vegetation, sur-rounded by disturbed areas, impacts and changes the dispersal and movement of species across that landscape. Endemic species are more likely to be impacted, because of their smaller capacity for dispersion and their habitat specialization [9]. Fragmentation reduces the connectivity of the landscape and, therefore, the ability of species to travel between habitat patches, resulting in changes in spe-cies distribution patterns [11][12], and an increase in the possibility of local ex-tinctions [13]. Species extinction can have a strong impact on the integrity of ecosystems, since component species regulate the availability of environmental resources, control population densities through inter-specific interactions, and are integrated into a range of environmental services, such as water cycling, soil formation, nutrient and energy fixation, and climate maintenance [14].
change. Together, these can be used to plan land use management that can be conducted to ensure the availability of ecosytem services over the long term. Geographic information systems and analysis of spatial patterns provide an ana-lytical approach to investigate change in spatio-termporal patterns of land use and cover, assisting in the detection of changes in such factors and determining the distribution and extent of modified areas [15][16][17]. A large number of indices have been developed to quantify the spatial heterogeneity of landscape in categorized maps [7][18] [19]. These indices fall into two general types, which together affect how ecological processes are recorded and how this translates in-to perceived changes in landscape patterns. They are: 1) indices which evaluate the composition of a map without reference to such spatial attributes such as shape and size of a fragment; and 2) indices which assess the spatial configura-tion of system properties, and require spatial informaconfigura-tion, such as levels of patch isolation and connectivity, for their calculation [7].
The use of landscape indices or metrics to characterize changes in ecosystem services, landscape functions and integrity caused by logging, agriculture and urbanization has been increasing at the last decade [2]. These are key attributes indicating the integrity of a system, related to the degree of influence of human activities and the system capability to maintain natural communities [20]. In large scales, monitoring rates of vegetation suppression have revealed the speed in which remaining natural habitats are loss. This information indicates the clearing extent across bioregions, but lack to provide an indication of the con-sequences of habitat loss to landscape configuration, in special, connectivity, which may play deep effects on conservation of biodiversity [9][21]. Detecting and monitoring the impact of human activities on landscape status may be done by integrating a set of complementary landscape indices, rather than describing them separately [22].
The aim of the study was to analyze the spatial and temporal changes in land use and cover and fragmentation of remaining native vegetation from 2002 to 2012 in a Brazilian hydrographic basin and to provide an indicator of landscape integrity (ILI) that can be used to monitor the landscape status over time and space. In this study we ask: 1) what was the suppression rate of native vegetation over a 10-yearperiod; 2) what were the main changes in the landscapes pattern over 10 years, and 3) how these changes affected landscape integrity.
2. Study Area
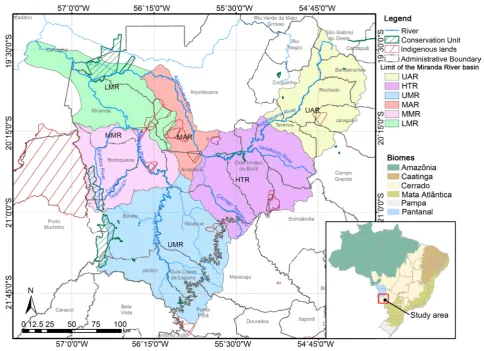
This study was conducted in the hydrographic basin of the Miranda-Aquidauana Rivers (hereafter called Miranda basin), located in the midwest region of the Mato Grosso do Sul, Brazil (Figure 1). The basin has a drainage area of 43,787 km2. The study site lies between the coordinates 19˚20'21.5"S and 22˚1"28.4'S
and 57˚27'56.1"W, 54˚25"40.3'W, an area of some 44,740.50 km2. The Miranda
Figure 1. Location and subdivisions of the Miranda River hydrographic Basin.
River Negro watershed, to the west by the Nabileque River watershed, and to the south and southeast by the ApaRiver watershed.
A short stretch to the northwest has borders with the Taquari River wa-tershed. The principal rivers that contribute to the drainage basin are the Aqui-dauana, Miranda, Salobra, Formoso, Nioaque and Santo Antonio [23].
The basin is located within the Tropical Zone, with influence of two climates: tropical climate with a dry season (Aw), also known as savanna climate, and semi-humid tropical climate or tropical monsoon (Am), both characterized by a marked alternation of rainy and dry seasons. Temperature ranges between 16˚C and 28˚C, with an annual average of 22˚C. The annual rainfall varies from about 1650 mm in the headwaters to 1000 mm in the western Pantanal floodplains. The annual evaporation is about 1140 mm [23].
deforasta-tion. In the valleys of Aquidauana and Miranda rivers, there are dark red alic Latosols and Regosols, respectively. Typic Natrustalf predominates in the pre-Pan- tanal lowlands [23].
The vegetation belongs to the Cerrado phytogeographic domain. Most of the upland areas are covered with deciduous and semi-deciduous Cerrado. Forest formations under fluvial influence (e.g. cambarazal, carandazal) followed by grassy-woody savanna dominate in the Pantanal [24] [25]. Because of its high biodiversity and elevated threat level, the Cerrado biome is a hotspot for biodi-versity conservation, having a high risk of being increasingly reduced to smaller vegetation fragments [26] [27]. The agricultural expansion is favoured by the disconect between environmental legislation and land policy and is the principal responsible for deforastation of its native vegetation formations [27], modifying the structure, composition and functioning of Cerrado ecosystems [28].
The basin includes seven sustainable use protected areas, three fully-protected conservation units (e.g. Serra da Bodoquena National Park) and eight areas of indigenous land, which together amount to approximately 4% of the total area (Figure 1). Because it is an area of high ecological value, 51% of the basin was decreed as a conservation priority area by the Ministry of the Environment through the Decree number 5092 of 21 May 2004, and through the Ordinance number 126 of 27 May 2004.
The 23 municipalities in the basin have different socioeconomic profiles [23]. On the plateaus predominates agriculture, while on the lowlands, e.g. the Pan-tanal, livestock are dominant. The main activities threatening conservation of the region’s fauna and flora are mining, and the extraction of charcoal and tim-ber, which have increased very quickly in the state. These activities are closely linked to cattle-raising, because the vegetation removal that starts the process is the result of partnerships between cattle ranchers, interested in increasing their area under exotic pasturage, and the owners of charcoal and lumber concerns, who require wood to their enterprises [29]. Irrigated rice cultivation, soya-bean/crop consortium and planted eucalyptus forest are also current manage-ment activities that threats ecosystem integrity.
3. Methodology
3.1. Watershed Delimitation
Watersheds are appropriate spatial units for the evaluation of impacts caused by human activity, especially when these are related to land use and may pose risks to maintainence of sutainable water resource availability in quality and quantity [30].
and Miranda (state of Mato Grosso do Sul) rivers for Water Quality Mainten-ance”.
Headwaters areas were represented by 3 watersheds: the Upper Aquidauana-River (UAR); the Headwaters of Varadouro-Taquaruçu Aquidauana-River (HTR); and the Upper Miranda River (UMR). Mid basin units were represented by the interme-diate reaches of the Aquidauana (Middle Aquidauana River-MAR) and the Mi-randa (Middle MiMi-randa River-MMR); whereas the lowest portions of the basin was represented by the Lower Miranda River (LMR) that crosses the Pantanal floodplain.
3.2. Land Use and Cover
Data on the spatial distribution of land use and cover (LUC) were provided in shape file by the Socio-Environmental Institute of the Upper Paraguay River Ba-sin (BAP)-SOS Pantanal. The LUC map for the year 2002 in a 1:50.000 scale was generated based on visual interpretation of Landsat TM satellite imagery and other ancillary data set provided by the Brazilian Program of Conservation and Sustainable Use of Biological Diversity (PROBIO), coordinated by the Ministry of Environment [31]. The monitoring for the years of 2008, 2010 and 2012 [32] followed the same technical procedures and were based on the LUC map of 2002 [31]. Only for the year of 2012, the LUC map was generated based on Re-source-Sat-1 LISS III, which have similar spatial and spectral characteristics [32]. Long-term land use change studies frequently do not allow quantitative field va-lidation, principal of historical landscape stages [33]. The methodology adopted in the works of interpretation of the images of satellite allowed corrections in the period from 2002 to 2012, giving the mapping greater reliability regarding de-tected changes. In areas where Landsat/Resource-Sat interpretations were doubt-ful, class identification and extensive qualitative validation were conducted by regional experts using high-resolution satellite data such as QuickBird and World View available within Google Earth and CBERS HRC imagery [31]. De-tailed LUC were grouped into 14 classes, seven for anthropogenic areas, six for remaining areas of native vegetation and one representing water bodies (Figure 2). Anthropogenic areas refer to the suppression of native vegetation by: urban influence, anthropogenic change, natural change/management, degraded by mining, grazing, agriculture and plantation forestry. The remnants of native ve-getation are classified according to phytogeographical aspects and veve-getation characterized by the dominant life form (i.e. herbaceous, shrub or tree) [32]. The six classes for native vegetation are: forest formations, forest savanna (cerradão), woody savanna (cerradosensustricto), grassy-woody savanna (campo), steppe savanna (Chaco) and the vegetation with riverine influence.
3.3. Quantifying Spatial Patterns
Figure 2. Land use classification of the Miranda River hydrographic Basin in 2012. Inset, topographic map of the Miranda basin. Source: SOS Pantanal (2014).
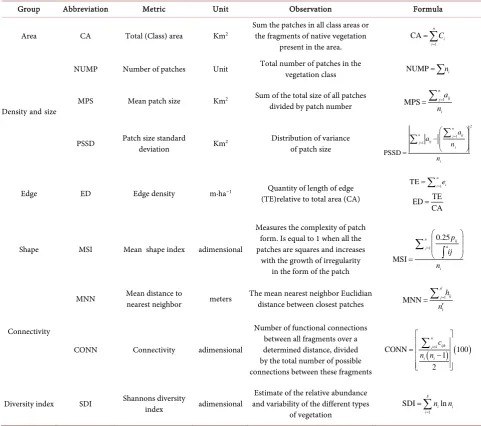
patch mosaic composition and configuration, i.e., area, density, size, edge, shape, connectivity and diversity [15] facilitating monitoring human impacts on the natural landscape [18][19]. The indices used in this study are described in Table 1. They are based on the concept of patches, that is, landscape elements that dif-fer in structure and composition from its matrix or surroundings [15]. In this study, patches are considered the remaining fragments of the 6 classes of native vegetation surrounded by areas of human use, such as exotic grasslands and agriculture. The year 2012 was the reference, considered as the current spatial situation of the landscape.
Table 1. Landscape patterns metrics used to describe aspects of the composition and configuration of the Miranda River Hydro-graphic Basin. Source: [34].
Group Abbreviation Metric Unit Observation Formula
Area CA Total (Class) area Km2 Sum the patches in all class areas or the fragments of native vegetation
present in the area. 1
CA = =
∑
n ii
C
Densityandsize
NUMP Number of patches Unit Total number of patches in the vegetation class NUMP=
∑
niMPS Mean patch size Km2 Sum of the total size of all patches
divided by patch number MPS=
∑
=1n ij j i a n
PSSD Patch size standard deviation Km2 Distribution of variance
of patch size
2 1 1 PSSD = = − =
∑
∑
n ij j ij n j j i a a n nEdge ED Edge density m·ha−1 Quantity of length of edge
(TE)relative to total area (CA)
1 TE=
∑
=i n i e TE ED CA =
Shape MSI Mean shape index adimensional
Measures the complexity of patch form. Is equal to 1 when all the patches are squares and increases
with the growth of irregularity in the form of the patch
1 0.25 MSI = =
∑
∫
ij a j i n p ij n ConnectivityMNN Mean distance to nearest neighbor meters The mean nearest neighbor Euclidian distance between closest patches 1 1 MNN = ′ = ′
∑
n ij jh nCONN Connectivity adimensional
Number of functional connections between all fragments over a determined distance, divided by the total number of possible connections between these fragments
( ) ( )1
CON 0 2 N 0 1 ≠ − =
∑
n ijk j k i i c n nDiversity index SDI Shannons diversity index adimensional and variability of the different types Estimate of the relative abundance
of vegetation 1
SDI ln
= =
∑
S i ii
n n
Table 2. Socioenvironmental characteristics of the 6 watersheds of the Miranda River hydrographic Basin.
Upper Aquidauana Rive
Headwaters of Taquaruçu
River
Upper
Miranda River Aquidauana River Middle Miranda River Middle Miranda River Lower
Bioma Cerrado Cerrado Cerrado Cerrado/Pantanal Cerrado Pantanal
Mean altitude, m 440 294 344 231 380 109
Watershed area, km2 6582.18 9293.41 11,547.73 2886.46 5976.58 6804.35
Area occupied by
remnant vegetation, % 39 37 31 60 46 76
Area occupied by
alluvial forests, % 6 1 8 1 12 10
Dominant
vegetation type Steppe-savanna Forest savanna Alluvial forest Steppe savanna
Deciduous and semideciduous
forest
Vegetation with riverine influence
Dominanthuman-activity Agriculture Agriculture Agriculture Human activity Ranching Ranching
fragments of native vegetation within a distance of 1000 meters of one another, through both the inter-dispersion of patch types [38] (e.g. mixture of different patch classes), and patch dispersion (i.e. spatial distribution of patch classes) [39]. High CONN values indicate landscapes with patches that are either nu-merous, or large and close together, whereas low values indicate landscapes with small and/or isolated units [18]. The distance of 1000 meters between fragments used in the current study was based on species with intermediate capability for movement, such as the following bird species: Amazon aestiva (Blue-fronted Amazon), Psarocoliusdecumanus (Crested Oropendola) and Campylorhamphu-strochilirostris (Red-billed Scythebill) [40]. The metric distance from the nearest neighbor (MNN), unlike CONN, analyzes by how much a fragment is isolated from another in terms of Euclidian distance. From the landscape ecology pers-pective, it refers to the inaccessibility of a habitat fragment for organisms mi-grating from other patches [41] and is measured by the nearest edge-to-edge distance [42]. The Shannon Diversity Index (SDI) was calculated to assess the physiognomic variability of the remaining natural vegetation in the analyzed polygons, i.e., the whole basin and in each watershed. The value zero is present only when the landscape contains a single class, increasing as the number of classes increases and the proportion of each class within the landscape becomes more equitable [38].
ArcGIS 10.2 software, with the extention Patch Analyst [43], except for the connectivity index, which was calculated using FRAGSTAT 4.2 [34].
3.4. Indicator of Landscape Integrity
pre-viously transformed to values ranging between zero (0) and one (1). The equa-tion sign used (addiequa-tion or subtracequa-tion) was based on the relaequa-tionship of the n metrics, negative or positive, within the landscape fragmentation processes, as based on the literature [3][27][45].
( )
ILI=
∑
Mn (1)4. Results
4.1. Loss of Native Vegetation Fragments in the Miranda Basin
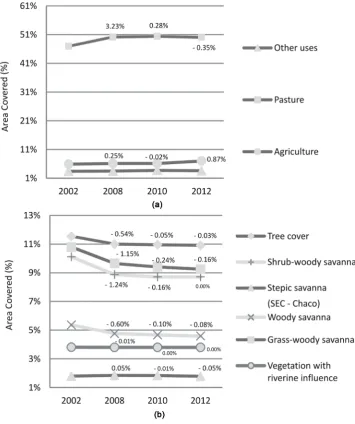
More than half of the Miranda basin is deforested, with loss of its native vegeta-tion of more than 1880 square kilometers in the period of 10 years, correspond-ing to a reduction of 4.4% of the total area.Exotic pasture was the most proeminent landuse, and also the activity which most increased between 2002 and 2010 (Figure 3). In 2002, 47% of the landscape was composed of pasture (20,215.04 km2), by 2010 this was 50.57% (21,723.34
km2). Figure 3(a) shows that between 2010 to 2012 pasture cover decreased by
153 km2. This was the period during which agriculture showed the strongest
growth (1.1% of its original area, reaching 2,993,399 km2 in 2012). The remain-
ing vegetation with largest coverage in the basin are the forest formations with 4701 km2, followed by grassy-woody savanna (3984.311 km2) and woody
savan-na (3752. 84 km2). Vegetation types in the Miranda basin maintained the same
order of dominance over the years, although their loss rates varied. The biggest losses occurred for the grassy-woody savannas, with a decrease of 1.55% since 2002 (Figure 3(b)). Woody and forest savannas were reduced by 1.4% and 0.8%, respectively. These losses mainly occurred from 2002 to 2008, a period that coincides with an increase in exotic pastures (Figure 3(a) and Figure 3(b)). For instance, the annual loss rate for tree cover was 0.09% from 2002 to 2008; drop-ping to 0.03% from 2008 to 2010 and to 0.02% from 2010 to 2012. Cover of steppe savanna and vegetation with fluvial influences were not reduced.
4.2. 10-Years Changes in Lanscape Integrity
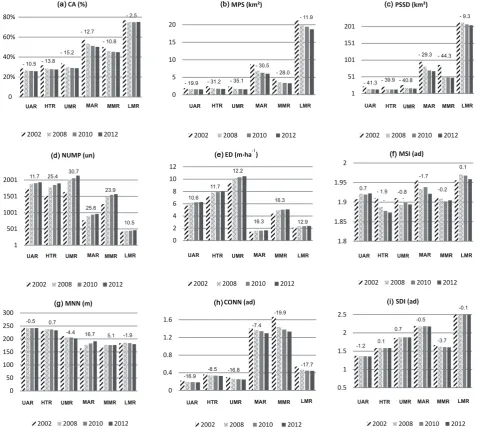
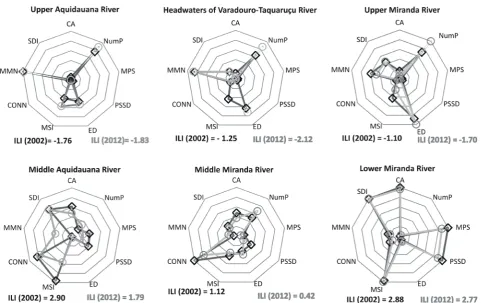
The current progress of vegetation fragmentation in the basin was analysed us-ing a synthetic index (Indicador of Landscape Integrity-ILI) obtained from the nine assessed landscape metrics (Figure 4), which provides an empiric indicator of the state of landscape integrity (Equation (2)).
ILI
=
CA SDI CONN MSI MPS MNN ED Nump PSSD
+
+
+
+
−
−
−
−
(2)The indicator varied from −2.12, indicating the lowest landscape integrity state, to 2.88, indicating highest landscape integrity related to fragmentation processes and native vegetation loss.
Figure 3. (a) Changes in the proportion of fragments of native vegetation in the Miranda River Hydrographic Basin between 2002 and 2012, and (b) changes in human use. Positive and negative variation values indicate gains and loss in land cover over time.
29%, respectively) (Figure 4(a)), small pacht size (1.54 to 1.67 km2) (Figure
4(b)) and a large number of fragments (1530, 2137 and 1101, respectively) (Figure 4(d)) within the basin. Besides, these watersheds had the highest value for fragments edge density (Figure 4(e)) and the most isolated fragments, apart each other by 206 m (UMR) to 242 m (UAR) (Figure 4(g)).
Figure 4. Changes in the landscape configuration and composition in the Miranda River Hydrographic Basin between 2002 and 2012 evaluated using 9 metrics, as follows: (a) Patch Area; (b) Mean Patch Size; (c) Patch Size Standard Deviation; (d) Number of Patches; (e) Edge Density; (f) Mean Patch Shape; (g) Mean Nearest Neighbor Distance; (h) Patch Connectivity Index; (i) Shannon Diversity Index. Losses and gains are shown as percentage change these values over the 10 years. Negative variation values indicate loss.
high habitat diversity and low isolation between its remaining fragments, which gave it the highest landscape integrity (2.77) (Figure 5). This watershed, al-though highly-vegetated, showed low connectivity (Figure 4(h)) due to the low number of small size fragments.
Figure 5. Temporal changes in landscape integrity in the 6 watersheds in the Miranda basin. Indicador of Landscape Integrity (ILI) was obtained from nine landscape metrics, which provides an empiric indicator of the state of landscape integrity. The me-trics were transformed into values ranging between 0 and 1. CA: proportion of remaining vegetation; NUMP: number of frag-ments, MPS: mean patch size, PSSD: standard deviation of patch shape, ED: edge density MSI: mean shape index, CONN: connec-tivity, MNN: distance from the nearest neighbor, SDI: Shannon diversity. ILI varies from −2.12, indicating the lowest landscape integrity state, to 2.88, indicating highest landscape integrity related to fragmentation processes and native vegetation loss.
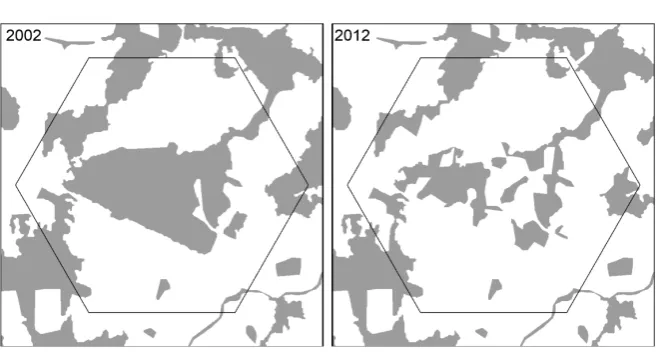
land use convertion changing patch shapes to more regular forms and increasing isolation of the remaining fragments. The Headwaters of Varadouro-Taquaruçu (HTR) was in better integrity state in 2002 (ILI = −1.25) than its neighborhood watershed Upper Aquidauana River (UAR) (ILI = −1.76) (Figure 5), indicating the rapid degration processes happened in HTR associated with reduction of the total occupied remnant area and fragmentation. Number of fragments and patch size were the landscape parameters that have changed the most over time. In the Upper Miranda River (UMR), the number of fragments changed from 1635 fragments in 2002 to 2137 in 2012, an increase of 30.70% (Figure 4(d)). The fragmentation process that caused the fragment isolation, often decreased over-all connectivity. Figure 6 demonstrates how this process occurred in a 25 km2
Figure 6. Exemple of loss of connectivity in the Miranda River hydrographic Basin.
5. Discussion
Human activities, driven by a variety of socio-economic, technological, cultural and political factors [7][46] [47] have driven changes in landscape patterns in Brazilian biomes threatening its cultural and ecological integrity [27] [48][49]. In the current study, we investigated the process of fragmentation and loss of savanna and forest formations within the Miranda Basin between 2002 and 2012. We did this using landscape metrics and integrated index which allowed the spatial and temporal evaluation of ecological integrity of the watersheds land-scape.
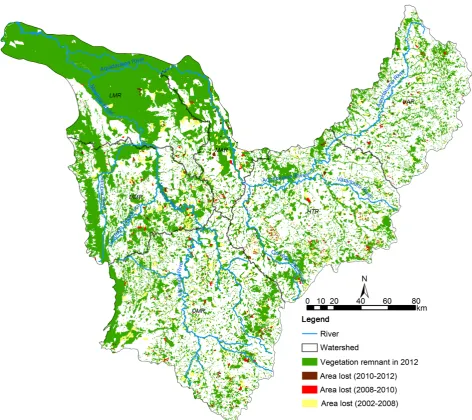
In the Miranda basin 4.4% of the native vegetation was removed between 2002 and 2012. The most extensive changes to the spatial patterns of remaining vege-tation were seen between 2002 and 2008 (Figure 7), a period of great increase in livestock occupation. The loss of native vegetation in the Cerrado over the last 20 years is attributed to the expansion of agrobusiness, mining and urban growth [48][50]. Natural vegetation removal was recorded more intense in the Miranda basin in 1972, likely because of federal and state government programs to en-courage the expansion of the agricultural frontier [51]. Decreases in deforesta-tion rates over time observed in Miranda basin are probably a result of the re-duction of remaining natural vegetation in the region over the last years. The grazing lands that dominated most of the basin in the last decades, more recently (2010-2012) are being converted to agriculture areas, especially in the basin uplands, due to better prices of these commodities.
Figure 7. Loss of native vegetation in the Miranda River hydrographic Basin during 2002, 2008, 2010 and 2012.
biological invasions [53] [54], reduce diversity of available ecological niches, change the microclimate of habitats [17] and cause local species extinction due to the interruption of gene flow between local populations [3][5]. Accordingly, it is important to understand the spatial context of the fragments, because land-scape changes modify the surrounding environment of the remaining patches as the fragmentation process proceeds [49].
farming are more fragmented and have a reduced amount of remaining savanna and forest. In such a situation of advanced deforestation, the isolation of the re-maining vegetation exerts strong pressure on regional biodiversity [3] [55]. In contrast, the watersheds Lower Miranda and Middle Aquidauana Rivers, part of the Pantanal wetland, show greater landscape integrity, coupled with the highest proportion of remaining vegetation, the presence of large fragments (>50 km2)
and lower isolation between fragments (180 m and 191 m, respectively). Wa-tershed Middle Miranda River has the third highest integrity level within the whole Miranda Basin. It is located among the Serra da Bodoquena and the tran-sition from the Maracajú-Campo Grande Plateau to the Pantanal floodplains [56]. The steep slopes of the landscape morphology and the presence of the Serra da Bodoquena National Park should have guaranteed higher preservation levels of native vegetation. However, the presence of fertile soils on basaltic formation of Serra de Maracajú, is triggering a current conversion pressure of dry forests found in this region, which has already resulted in a decrease of the connectivity between remaining fragments. Mostly present along and at escarpment ramps, these forests, even though protected by law, continue to be eliminated due to the expansion of livestock, agricultural activities, and logging for civil and industrial use (e.g. charcoal production) [57].
The good state of landscape integrity observed in the Lower Miranda River (LMR) might have resulted from several factors: 1) about 72% of its area are in the Pantanal Wetland and under the influence of an annual flood pulse, which physically limits the expansion of crop farming and, favoures extensive cattle ranching on native grasslands; 2) in this watershed there are two strictly pro-tected conservation areas, the Pantanal of River Negro State Park and the Fa-zenda Santa Sofia Private Natural Heritage Reserve, which together occupy about 7% of the area; and 3) 84% of its area is considered a priority area for con-servation by the Ministry of Environment, due to the occurrence of endangered species such as Cock-tailed Tyrant (Alectrurus tricolor), Black-and-white Monjita (Heteroxolmisdominicana), Chestnut seedeater (Sporophilacinnamomea), Re-triculated or Fire Freshwater Stingray (Potamotrygon falkneri), Janguar ( Pan-theraonca) and Puma (Puma concolor) [58]. Protected areas are an integral component of biodiversity conservation policy, and have become a center-piece of global efforts to reduce carbon emissions from tropical deforestation (Schar-lemann et al., 2010) and to contribute to climate change mitigation [59].
The Middle Aquidauna River (MAR) watershed is also largely (67%) located within the Pantanal Wetland. However, despite representing one of the areas with the highest levels of landscape integrity, the increasing number of frag-ments and reduced patch sizes are the results of growing mining activities, which indice a greater vulnerability to deforestation and vegetation degradation.
con-nectivity. The loss of connectivity can affect the mobility of groups that are spe-cialists in the forest habitats of the region [60], such as bird species that rely on riparian forest corredors to move between distant habitats in favorable phases of the year or during mating seasons [61][62]. In general, isolation acts negatively on species richness by reducing immigration rate. Species that manage to survive in isolated fragments tend to become dominant [63] and thus habitat diversity decreases by a decrease of richness and biological evenness. Since these forests generally occupy protected areas in the basin, such as river banks, any reduction implies in heavy losses for the regional biodiversity.
Savanna vegetation suffered the highest areal reduction in the last 10 years within the basin, in special, the native grasslands. Between 2002 and 2012 the reduction was 1.55% with substitution of natural grasslands mostly by exotic pasture. Similarly, Rocha et al. [64], analyzing deforestation in the Cerradobi-ome between 2002 and 2009, found a reduction rate for native grasslands of 3.63%. The conversion of native grasslands to planted ones, usually formed by grasses of African origin (e.g. Brachiaria spp.), is considered the major forms of vegetation change in the Cerrado. Causing an immediate reduction of local spe-cies diversity, it increases the risk of invasion by alien spespe-cies and burning [65]. These impacts on wetland habitats deserve special attention, because it directly affects the quantity and quality of water available in the watershed [25]. The conservation of these wetlands can help ensure water security of the country against negative climate change scenarious, as well as meeting national and in-ternational agreements (Convention Ramsar, Iran, 1971) to protect Brazilian wetlands [66].
In Brazil over the last 40 years, environmental policy had made great advances (Law N˚. 4771 of 15/9/1965) with the creation of many conservation units and delimitation of protected areas on private property. However, the recent loosen-ing of legislation was a strongly retrograde step (e.g. Brazil’s New Forest Code 2012), reducing protected habitats, such as riparian forests, forests on slope greater than 45˚ and in legal reserves [67]. It shows that the expansion of agri-cultural frontiers still commands the future of Brazil’s natural landscapes. Con-servation strategies for native vegetation remnants must have broad prospects, given that ecosystems and their environmental services are not isolated in land-scapes altered by anthropogenic uses and operate at the large-scale, facilitating connectivity between natural and anthropogenic ecosystems [68].
the protection of biodiversity in Brazil [70]. Those present in the Miranda basin require intensive supervision so that the representativeness of the remaining ve-getation of the Brazilian biomes also is guaranteed on private property.
6. Conclusions
The removal of native vegetation in the Miranda basin over the studied 10 years period (2002-2012) was 4.4%. The deforestation during this time mainly resulted from the expansion of livestock and agriculture activities. Although agriculture within the study area currently occurs to a lesser extent, it has the potential to grow via the conversion of exotic pastures and advance in lowland areas that currently still retain substantial native vegetation cover.
The loss of native vegetation occurred mainly in grassy-woody savanna, and in semideciduous and deciduous forests, resulting in strong impacts on land-scape connectivity between the plains and the plateau.
The main consequences of vegetation suppression on landscape patterns were increase in number and isolation of fragments and higher vulnerability of the remnants to external pressures, such as fire and invasions. Headwater areas had become more fragmented, while fragmentation is lower in the lowlands. How-ever, although native vegetation is better preserved in the lowlands, those exhi-bited a higher vegetation loss during the observation period, warning to the need of creating legal instruments that guarantee the wise use of natural and maneged spaces.
The conservation of the remaining native vegetation should be ensured by maintaining the connectivity of vegetation mosaics, both within protected areas and outside them. Legal instruments such as resolutions, normative instructions, and mainly state and municipal laws and decrees, as well as the participation of the farm owners creating privete reserves should help the conservation of these areas in order to regulate the sustainable use of the landscape. It is imperative that government, owners and society in general understand that the limit of sus-tainability of the Miranda hydrographic basin has already been exceeded in most of its area, undermining their resilience and biodiversity conservation.
We recommend an intense recovery program for headwaters and aquifer re-charge areas, as well as riparian forests, especially in the watersheds Upper Aquidauana River, Headwaters of Varadouro-Taquaruçu Rivers and Upper Mi-randa River to avoid the future compromising of water production. Besides, we also recommend the maintenance and recovering of the connectivity of the cur-rent remaining patches of natural vegetation corridors (Figure 5) and that the watersheds Middle Aquidauana River and Lower Miranda River should keept conserved by a program of zero deforestation and through specific laws that in-coporate the consolidated scientific knowladge about wetland ecosystem func-tioning, like the Pantanal [71].
Acknowledgements
Indicators for the Tietê/Jacaré (SP) and Miranda (MS) rivers for Water Quality Maintenance”, and was funded by MCT/FINEP/CT-HIDRO. We are very grate-ful to Eduardo R. Rosa and Marcos Rosa from ArcPlan. We also thanks to CNPq for providing the student grant to the master student Luciana Estevam.
References
[1] Grêt-Regamey, A., Brunner, S.H., Altwegg, J. and Bebi, P. (2013) Facing Uncertain-ty in Ecosystem Services-Based Resource Management. Journal of Environmental Management, 127, S145-S154.
[2] Uuemaa, E., Mander, Ü. and Marja, R. (2013) Trends in the Use of Landscape Spa-tial Metrics as Landscape Indicators: A Review. Ecological Indicators, 28, 100-106. [3] Fahrig, L. (2003) Effects of Habitat Fragmentation on Biodiversity. Annual Review
of Ecology, Evolution, and Systematics, 34, 487-515.
https://doi.org/10.1146/annurev.ecolsys.34.011802.132419
[4] Krauss, J., Bommarco, R., Guardiola, M., Heikkinen, R.K., Helm, A., Kuussaari, M., Lindborg, R., Öckinger, E., Pärtel, M., Pino, J., Pöyry, J., Raatikainen, K.M., Sang, A., Stefanescu, C., Teder, T., Zobel, M. and Steffan-Dewenter, I. (2010) Habitat Fragmentation Causes Immediate and Time-Delayed Biodiversity Loss at Different Trophic Levels. Ecological Letters, 13, 597-605.
https://doi.org/10.1111/j.1461-0248.2010.01457.x
[5] Forman, R.T.T. (1995) Land Mosaics: The Ecology of Landscapes and Regions. Cambridge University Press, Cambridge, 632 p.
[6] Metzger, J.P. (2003) Como Restaurar a Conectividade de Paisagens Fragmentadas? In: Kageyama, P., Oliveira, R.E., Moraes, L.F.D. and Gandara, F.B., Eds.,
Restauração Ecológica de Ecossistemas Naturais, Fundação de Estudos e Pesquisa Agrícolas e Florestais—FEPAF, Botucatu, 49-76.
[7] Gustafson, E.J. (1998) Pattern : What Is the State of the Art? Ecosystems, 1, 143-156.
https://doi.org/10.1007/s100219900011
[8] Nagendra, H., Munroe, D.K. and Southworth, J. (2004) From Pattern to Process: Landscape Fragmentation and the Analysis of Land Use/Land Cover Change. Agriculture, Ecosystems & Environment, 101, 111-115.
[9] Fahrig, L. and Merriam, G. (1994) Conservation of Fragmented Populations. Con-servation Biology, 8, 50-59. https://doi.org/10.1046/j.1523-1739.1994.08010050.x
[10] Ferraz, S.F.B. and Vettorazzi, C.A. (2003) Identification of Suitable Areas for Forest Recovery Based on Principles of Landscape Ecology. Revista Árvore, 27, 575-583. [11] Gardner, R.H. and O’Neill, R.V. (1990) Pattern, Process, and Predictability: The Use
of Neutral Models for Landscape Analysis. In: Turner, M.G. and Gardner, R.H., Eds., Quantitative Methods in Landscape Ecology. The Analysis and Interpretation of Landscape Heterogeneity, Springer, New York, 289-307.
[12] Pringle, C. (2003) What Is Hydrologic Connectivity and Why Is It Ecologically Im-portant? Hydrological Processes, 17, 2685-2689.https://doi.org/10.1002/hyp.5145
[13] Bascompte, J. and Solé, R.V. (1996) Habitat Fragmentation and Extinction Thre-sholds in Spatially Explicit Models. Journal of Animal Ecology, 65, 465-473.
https://doi.org/10.2307/5781
[14] Dickman, C., Pimm, S. and Cardillo, M. (2007) The Pathology of Biodiversity Loss: The Practice of Conservation. In: Macdonald, D.W. and Service, K., Eds., Key Top-ics in Conservation Biology, Blackwell Publishing Ltd., Oxford, 1-16.
New York.
[16] Macleod, R.D. and Congalton, R.G. (1998) Quantitative Comparison of Change- Detection Algorithms for Monitoring Eelgrass from Remotely Sensed Data. Photo-grammetric Engineering and Remote Sensing, 64, 207-216.
[17] Turner, M.G. (1990) Spatial and Temporal Analysis of Landscape Patterns. Land-scape Ecology, 4, 21-30.https://doi.org/10.1007/BF02573948
[18] O’Neill, R.V., Krummel, J.R., Gardner, R.H., Sugihara, G., Jackson, B., DeAngelis, D.L., Milne, B.T., Turner, M.G., Zygmunt, B., Christensen, S.W., Dale, V.H. and Graham, R.L. (1988) Indices of Landscape Pattern. Landscape Ecology, 1, 153-162.
https://doi.org/10.1007/BF00162741
[19] Turner, M.G. and Rusher, C.L. (1988) Changes in Landscape Patterns in Georgia, USA. Landscape Ecology, 1, 241-251.https://doi.org/10.1007/BF00157696
[20] Parrish, J.D., Braun, D.P. and Unnasch, R.S. (2003) Are We Conserving What We Say We Are? Measuring Ecological Integrity within Protected Areas. BioScience, 53, 851-860. https://doi.org/10.1641/0006-3568(2003)053[0851:AWCWWS]2.0.CO;2
[21] Baguette, M., Blanchet, S., Legrand, D., Stevens, V.M. and Turlure, C. (2013) Indi-vidual Dispersal, Landscape Connectivity and Ecological Networks. Biological Re-views, 88, 310-326.https://doi.org/10.1111/brv.12000
[22] Routledge, P. (2003) Convergence Space: Process Geographies of Grassroots Globa-lization Networks. Transactions of the Institute of British Geographers, 28, 333-349.
https://doi.org/10.1111/1475-5661.00096
[23] Mendes, C.A.B., Grehs, S.A., Pereira, M.C.B., Barreto, S. R., Becker, M., Lange, M.B.R. and Dias, F.A. (2004) Bacia Hidrográfica do Rio Miranda. Estado da Arte. UCDB. Campo Grande, Mato Grosso do Sul, Brazil.
[24] Silva, J.A.A., Nobre, A.D., Manzatto, C.V, Joly, C.A., Rodrigues, R.R., Skorupa, L.A., Nobre, C.A., Ahrens, S., May, P.H., Sá, T.D.A., Caunha, M.C. and Rech Filho, E.L. (2011) O Código Florestal e a Ciência: Contribuições para o Diálogo. SBPC-ABC, São Paulo.
[25] Pott, A., Pott, V.J., Moreira, S.N. and Ferreira, F.A. (2014) Macrófitas Aquáticas do Pantanal e de Outras Áreas Úmidas em Mato Grosso do Sul. Heringeriana, 6, 72-75. [26] Mittermeier, R.A., Hoffmann, F.M., Pilgrim, J., Brooks, T., Gil, P.R., Mittermeier, C. and Lamoreux, J. (2005) Hotspots Revisitados-As Regiões Biologicamente Mais Ri-cas e Ameaçadas do Planeta. Mata Atlântica e Cerrado. Conservação Internacional, Brasil.
[27] Carvalho, F.M.V, Marco, P. and Ferreira, L.G. (2009) The Cerrado Into-Pieces: Ha-bitat Fragmentation as a Function of Landscape Use in the Savannas of Central Bra-zil. Biological Conservation, 142, 1392-1403.
[28] Southworth, J., Munroe, D. and Nagendra, H. (2004) Land Cover Change and Landscape Fragmentation—Comparing the Utility of Continuous and Discrete Analyses for a Western Honduras Region. Agriculture, Ecosystems & Environment, 101,185-205.
[29] Silva, E.A. (2011) O Processo Produtivo do Carvão Vegetal: Um Estudo em Mato Grosso do Sul. PhD Dissertation, Universidade Estadual Paulista “Júlio de Mesquita Filho”, São Paulo.
[30] Fernandes, M.R. and Silva, J.C. (1994) Programa estadual de manejo de sub-bacias hidrográficas: Fundamentos e estratégias. Belo Horizonte. EMATER-MG.
Alto Paraguai—Porção Brasileira—Período de análise: 2002 a 2008. Brasília. [32] Conservação Internacional—CI, Ecologia e Ação—ECOA, Fundacíon AVINA,
Instituto SOS Pantanal and WWF-Brasil (2015) Relatório Técnico Metodológico. Monitoramento das Alterações da Cobertura Vegetal e Uso do Solo na Bacia do Alto Paraguai—Porção Brasileira—Período de Análise: 2012 a 2014. Instituto SOS Pantanal, WWF-Brasil, Brasília.
[33] Giri, C., Zhu, Z., Tieszen, L.L., Singh, A., Gillette, S. and Kelmelis, J.A. (2008) Man-grove Forest Distributions and Dynamics (1975-2005) of the Tsunami Affected Re-gion of Asia. Journal of Biogeography, 35, 519-528.
https://doi.org/10.1111/j.1365-2699.2007.01806.x
[34] McGarigal, K., Cushman, S.A., Neel, M.C. and Ene, E. (2002) FRAGSTATS: Spatial Pattern Analysis Program for Categorical Maps. Computer Software.
http://www.umass.edu/landeco/research/fragstats/fragstats.html
[35] McGarigal, K. and Marks, B.J. (1995) FragStart Spatial Pattern Analysis Program for Quantifying Landscape Structure. General Technical Report PNW, US Department of Agriculture, Forest Service, Pacific Northwest Research Station, Portland. [36] Antwi, E.K., Krawczynski, R. and Wiegleb, G. (2008) Detecting the Effect of
Dis-turbance on Habitat Diversity and Land Cover Change in a Post-Mining Area Using GIS. Landscape and Urban Planning, 87, 22-32.
[37] Baker, W.L. and Cai, Y. (1992) The r.le Programs for Multiscale Analysis of Land-scape Structure Using the GRASS. Geographical Information System, 7, 291-302. [38] Cassimiro de Lemos, R.C. and Melo-de-Pinna, G.F. (2011) Morpho-Anatomical
Variations during Stem Development in Some Epiphytic Cactaceae. Journal of the Torrey Botanical Society, 138, 16. https://doi.org/10.3159/10-RA-054.1
[39] Fischer, J. and Lindenmayer, D.B. (2007) Landscape Modification and Habitat Fragmentation: A Synthesis. Global Ecology and Biogeography, 16, 265-280.
https://doi.org/10.1111/j.1466-8238.2007.00287.x
[40] Yabe, R.D.S., José, E. and Marini, M.A. (2010) Movements of Birds among Natural Vegetation Patches in The Pantanal, Brazil. Bird Conservation International, 20, 400-409. https://doi.org/10.1017/S0959270910000067
[41] Bender, D.J., Tischendorf, L. and Fahrig, L. (2003) Using Patch Isolation Metrics to Predict Animal Movement in Binary Landscapes. Landscape Ecology, 18, 17-39.
https://doi.org/10.1023/A:1022937226820
[42] Ersoy, E., Jorgensen, A. and Warren, P.H. (2016) Measuring the Spatial Structure of Urban Land Uses. The Case of Sheffield, UK. Journal of Environmental Protection and Ecology, 16, 393-401.
[43] Rempel, R.S., Kaukinen, D. and Carr, A.P. (2012) Patch Analyst and Patch Grid. Ontario Ministry of Natural Resources, Centre for Northern Forest Ecosystem Re-search, Thunder Bay. http://www.cnfer.on.ca/SEP/patchanalyst/
[44] Pfister, J.L. (2004) Using Landscape Metrics to Create an Index of Forest Fragmen-tation for the State of Maryland. MSc Project, Faculty of Towson University, Tow-son.
[45] Riitters, K.H., O’Neill, R.V, Hunsaker, C.T., Wickham, J.D., Yankee, D.H., Tim-mins, S.P., Jones, K.B., Jackson, B.L. and Neil, R.V.O. (1995) A Factor Analysis of Landscape Pattern and Structure Metrics. Landscape Ecology, 10, 23-39.
https://doi.org/10.1007/BF00158551
[46] Lambin, E.F. and Geist, H.J. (2001) Global Land-Use and Land-Cover Change: What Have We Learned So Far. Global Change Newsletter, 46, 27-30.
Well-Being in Changing Landscapes. Landscape Ecology, 28, 999-1023.
https://doi.org/10.1007/s10980-013-9894-9
[48] Klink, C.A and Moreira, A.G. (2002) Past and Current Human Occupation, and Land Use. In: Oliveira, P.S. and Marquis, R.J., Eds., The Cerrados of Brazil: Ecology and Natural History of a Neotropical Savanna, Columbia University Press, New York, 69-88. https://doi.org/10.7312/oliv12042-004
[49] Bennett, A.F. and Saunders, D.A. (2011) Habitat Fragmentation and Landscape Change. In: Sodhi, N.S. and Ehrlich, P.R., Eds., Conservation Biology for All, Ox-ford University Press, OxOx-ford, 88-106.
[50] Brannstrom, C., Jepson, W., Filippi, A.M., Redo, D., Xu, Z. and Ganesh, S. (2008) Land Change in the Brazilian Savanna (Cerrado), 1986-2002 : Comparative Analysis and Implications for Land-Use Policy. Land Use Policy, 25, 579-595.
[51] Ferraz, R.G.B. (2006) Antropização da Bacia Hidrográfica do Rio Miranda: Alterações climáticas, Recursos Naturais e Desenvolvimento. MSc Project, Univer-sidade Católica Dom Bosco, Campo Grande.
[52] Cruz, C., Madureira, H. and Marques, J. (2013) Análise Espacial e Estudo da Fragmentação da Paisagem da Aboboreira. Revista de Geografia e Ordenamento do Território, 4, 57-82. https://doi.org/10.17127/got/2013.4.003
[53] Flory, S.L. and Clay, K. (2009) Effects of Roads and Forest Successional Age on Ex-perimental Plant Invasions. Biological Conservation, 142, 2531-2537.
[54] Jørgensen, R.H. and Kollmann, J. (2009) Invasion of Coastal Dunes by the Alien Shrub Rosa Rugosa Is Associated with Roads, Tracks and Houses. Flora: Morphol-ogy, Distribution, Functional Ecology of Plants, 204, 289-297.
[55] Farina, A. (1998) Principles and Methods in Landscape Ecology. Chapman & Hall, London.
[56] Cordeiro, L.M., Borghezan, R. and Trajano, E. (2014) Subterranean Biodiversity in the Serra da Bodoquena Karst Area, Paraguay River Basin, Mato Grosso do Sul, Southwestern Brazil. Biota Neotropica, 14, 1-28.
https://doi.org/10.1590/1676-06032014011414
[57] Baptista-Maria, V.R., Rodrigues, R.R., Damasceno Junior, G., Maria, F.S. de and Souza, V.C. (2009) Composição Florística de Florestas Estacionais Ribeirinhas no Estado de Mato Grosso do Sul. Acta Botanica Brasilica, 23, 535-548.
https://doi.org/10.1590/S0102-33062009000200025
[58] MMA (Ministério do Meio Ambiente) (2015) Áreas Prioritárias para Conservação da Biodiversidade no Cerrado e Pantanal. WWF-Brasil, Brasília.
[59] Nepstad, D., Schwartzman, S., Bamberger, B., Santilli, M., Ray, D., Schlesinger, P., Lefebvre, P., Alencar, A., Prinz, E., Fiske, G. and Rolla, A. (2006) Inhibition of Amazon Deforestation and Fire by Parks and Indigenous Lands. Conservation Bi-ology, 20, 65-73.https://doi.org/10.1111/j.1523-1739.2006.00351.x
[60] Saunders, D.A., Hobbs, R.J. and Margules, C.R. (1991) Biological Consequences of Ecosystem Fragementation: A Review. Conservation Biology, 5, 18-32.
https://doi.org/10.1111/j.1523-1739.1991.tb00384.x
[61] Machtans, C.S., Villard, M.A. and Hannon, S.J. (1996) Use of Riparian Buffer Strips as Movement Corridors by Forest Birds. Conservation Biology, 10, 1366-1379.
https://doi.org/10.1046/j.1523-1739.1996.10051366.x
[62] Gillies, C.S. and St. Clair, C.C. (2008) Riparian Corridors Enhance Movement of a Forest Specialist Bird in Fragmented Tropical Forest. Proceedings of the National Academy of Sciences of the United States of America, 105, 19774-19779.
[63] Lindborg, R. and Eriksson, O. (2004) Historical Landscape Connectivity Affects Present Plant Species Diversity. Ecology, 85, 1840-1845.
https://doi.org/10.1890/04-0367
[64] Rocha, G.F., Ferreira, L.G., Ferreira, N.C. and Ferreira, M.E. (2011) Detecção de Desmatamentos no Bioma Cerrado entre 2002 e 2009: Padrões, Tendéncias e Impactos. Revista Brasileira de Cartografia, 63, 341-349.
[65] Klink, C.A. and Machado, R.B. (2005) A Conservação do Cerrado Brasileiro. Mega-diversidade, 1, 147-155.
[66] Junk, W.J., Piedade, M.T.F., Lourival, R., Wittmann, F., Kandus, P., Lacerda, L.D., Bozelli, R.L., Esteves, F.A., Nunes da Cunha, C., Maltchik, L., Schöngart, J., Schaef-fer-Novelli, Y. and Agostinho, A.A. (2014) Brazilian Wetlands: Their Definition, Delineation, and Classification for Research, Sustainable Management, and Protec-tion. Aquatic Conservation: Marine and Freshwater Ecosystems, 24, 5-22.
https://doi.org/10.1002/aqc.2386
[67] Torres Ribeiro, K. and Freitas, L. (2010) Impactos Potenciais das Alterações no Código Florestal sobre a Vegetação de Campos Rupestres e Campos de Altitude. Bi-ota Neotropica, 10, 239-246.https://doi.org/10.1590/s1676-06032010000400029
[68] Greiber, T. (2011) Governance of Ecosystem Services: Lessons Learned from Ca-meroon, China, Costa Rica and Ecuador. IUCN, Gland.
[69] Sagoff, M. (1996) On the Value of Endangered and other Species. Environmental Management, 20, 897-911. https://doi.org/10.1007/BF01205970
[70] Marques, E.M. and Ranieri, V.E.L. (2012) Determinantes da Decisão de Manter Áreas Protegidas em Terras Privadas: O Caso das Reservas Legais do Estado de São Paulo. Ambiente & Sociedade, 15, 131-145.
https://doi.org/10.1590/S1414-753X2012000100009
[71] Nunes da Cunha, C., Girard, P., Nunes, G.M., Arieira, J., Penha, J. and Junk, W.J. (2016) Pantanal: A Identidade de uma Grande Área Úmida. In: Peixoto, A.L., Pujol Luz, J.R. and Brito, M.A., Eds., Conhecendo a Biodiversidade, MCTI, CNPq, PPBio, Brasilia, 85-100.
Submit or recommend next manuscript to SCIRP and we will provide best service for you:
Accepting pre-submission inquiries through Email, Facebook, LinkedIn, Twitter, etc. A wide selection of journals (inclusive of 9 subjects, more than 200 journals)
Providing 24-hour high-quality service User-friendly online submission system Fair and swift peer-review system
Efficient typesetting and proofreading procedure
Display of the result of downloads and visits, as well as the number of cited articles Maximum dissemination of your research work