Discussion Papers in
Management
Profiling, Developing, and Assessing Effective Strategies for
Managing Learning and Behaviour
Dennis Roberts
Chartered Psychologist
and
C. Mar Molinero
School of Management
University of Southampton, UK
Number M02-4
January 2002
PROFILING, DEVELOPING, AND ASSESSING EFFECTIVE STRATEGIES FOR MANAGING LEARNING AND BEHAVIOUR
by
Dennis Roberts Chartered Psychologist
and
Cecilio Mar Molinero School of Management University of Southampton, UK
ABSTRACT
A structured observational protocol aimed at recording and profiling interaction strategies between teachers and pupils is developed in this paper. The principles on which the protocol is based are described. It was piloted at a junior school following an OFSTED inspection with the aim of collecting systematic data on teacher-pupil interaction. This was needed in order to assess the effectiveness of behaviour management strategies. The success of the project lead to the protocol being used by educational psychologists at other schools. Out-reach teachers at a special school for pupils with emotional and behavioural difficulties were trained in the use the protocol to support teachers managing pupils in mainstream schools. The assessment of the approach was made with the help of multidimensional scaling and associated multivariate statistical techniques.
INTRODUCTION
Background perspective
Communication is described in the Oxford Concise Dictionary as the act of imparting news or information; Fowler and Fowler (1969). This is communication in a very narrow sense unless there is far more in “the act” than appears at first sight. Communication takes place at many levels. Chomsky (1996), Argyle (1967),
Birdwhistell (1970) and Goffman (1956) have demonstrated the subtleties involved in language, interpersonal behaviour, and interaction. Chomsky (1996) takes examples of every day phrases and applies a linguistic analysis to show that our knowledge and interpretation of these phrases is much more complex than we had imagined. He assumes that the semantics involved must be unlearned, possibly inaccessible to consciousness, and dependent upon what Hume described as knowledge derived “by the original hand of nature” or through genetic endowment. Chomsky proposed innate generative language processes to account for the paradox that language involves "the infinite use of finite means" (attributed to Wilhelm von Humboldt ). Argyle (1967) studied communication from the perspective of a social psychologist, and developed techniques for studying interpersonal behaviour. He examined goals and motivation in social interaction, and verbal and non-verbal behaviours, or "social techniques and social skills" used in social encounters, whether deliberate or
pauses, stress, pitch and speed. Non-verbal communication was seen to have three main roles or functions:
• to transmit inter-personal attitudes and emotions by facial expression, posture, gesture, etc.;
• to support verbal communication (by completing the meaning of utterances with vocal and gestural signals; by controlling synchronizing with gaze, head-nods, and grunts; by obtaining feedback, e.g. from facial expression, eyebrow and mouth movements; and by signalling attentiveness, e.g. with proximity, orientation, eye contact, head-nods, and congruent posture - more recently described as mirroring); and
• to replace speech, e.g. when speech is impossible due to environmental or individual factors.
Goffman's sociological analysis of interaction makes a distinction between the narrow sense of communication, in terms of conveying information, and a wider range of action as a presentation or a performance (i.e." the two kinds of communication -expressions given and -expressions given off, " 1956, p.16). Goffman examines the techniques used by individuals in different contexts to present and maintain
impressions, and the issues involved in managing impressions by the participants or characters involved. This dramaturgical view of interaction as a set of performances serves to emphasise the importance of role and symbolism. Cassirer (1944, pp.26-27), also commented upon symbolism as a defining characteristic: " Hence, instead of defining man as an animal rationale, we should define him as an animal symbolicum.
That symbolic thought and symbolic behaviour are amongst the most characteristic features of human life, and that the whole progress of human culture is based on these conditions, is undeniable ".
illustrate how the mother gave conflicting non-verbal messages to her baby, putting the child in what Bateson called the double-bind, where neither message can be followed without conflicting with the other.
The above discussion illustrates the complexity of interaction at all levels of analysis. Communication serves many purposes and functions, whether verbal and/or non-verbal, aimed at conveying information, attitudes and emotions, symbolic meaning, etc. We can assume that we are not always consciously aware of the complex strategies we use when we communicate, nor of the perceptions and meanings constructed by others. To understand the relationship between teachers and their pupils, and to appreciate the strategies that teachers use to effectively manage behaviour and learning, we need to explore these aspects of communication in the classroom. These principles were very much behind the design of the project that is reported below.
Current perspective
Psychologists are frequently asked to provide advice on behaviour management issues. For educational psychologists this may involve a classroom observation followed perhaps by a consultation with teaching staff and parents or carers. The focus of the observation is often upon the pupil's behaviour, rather than the teacher's classroom management skills. But what the teacher does is, of course, vital as far as promoting effective learning is concerned. Yet the teacher's contribution to this
unwanted or challenging behaviours that had led to the referral, the teacher might be forgiven for choosing not to use well proven strategies, so that their visitor can see the full range of behaviours causing concern. There may also be constraints due to time, or perhaps availability of resources.
Many checklists and forms have been designed to record and monitor pupil
behaviour. However, there seem to be comparatively fewer instruments designed to record and evaluate the nature of teacher-pupil interaction- Merrett and Wheldall (1986), Flanders (1974)- and particularly of teachers' use of strategies to promote learning and manage behaviour effectively.
Some sense has to be made from the classroom observations that are undertaken, in order to be able to provide reliable, substantive and constructive feedback and advice. Argyle (1967, pp.215-225) describes some of the professional skills and techniques used in different contexts, from the job interview, to selling, public speaking,
supervision, teaching, psychotherapy and counselling, and child-rearing. According to Argyle (1967, p.215), teaching’s primary goals are the development of knowledge, understanding and skills; subsidiary goals being " to increase the motivation and interest of pupils, and to maintain order and discipline". As a point of some historic and paradoxical interest, Argyle refers to educational psychology as being mainly concerned with the techniques that are effective for conveying information,
THE PRESENT STUDY- PROJECT WORK AT A MAINSTREAM SCHOOL AND WITH OUT-REACH TEACHERS
Rationale for the project
Following their OFSTED inspection, the governors and senior management team at a junior school developed an action plan to address the key issues identified in the inspection report. One such key issue required the school to "develop a consistent and positive approach to managing behaviour in all classes and around the school ". The report identified serious weaknesses in the management of behaviour in a small but significant number of unsatisfactory lessons observed. It reported that "in some cases, the teacher did not know how to manage the disruptive children, and silly behaviour went unchecked. In others, children were disciplined through the inappropriate use of sarcasm and overbearing control ". The school had been in the process of reviewing its behaviour management policy, and had been seeking ways to establish more positive approaches by encouraging good behaviour and by rewarding and
recognising children who worked hard. The school requested the involvement of the Psychology Service to support them in this process, by engaging their services for project work starting in the Autumn term, 1998, and again in the Spring term, 2000.
Project aims and methods
The main aims of the first project were to develop teacher awareness of pupil
necessary to consider how to conduct structured classroom observations that focussed on useful information which could be quantified and presented in a reliable,
constructive and non-judgemental fashion. Video was recognised as a powerful resource for providing feedback on behaviour and performance- Roberts (1997)- and there are established methods to analyse video interaction- Trevarthen, (1979), Biemans, (1990)-, but its use was soon rejected on account of the time, cost and analysis involved. The use of video was considered too invasive, and raised issues of confidentiality. Instead, it was decided that a structured form would be designed for recording observations, as this appeared to be an economic, efficient and effective use of resources.
The first phase of the work took place from November 1998 to June 1999. After a planning meeting with school's senior management team, the structured observation protocol was developed. Classroom observations took place using the protocol, and feedback was given.
A follow-up project was aimed at developing work at school on the observation, recording and implementation of effective behaviour management strategies.
Project work with out-reach teachers
A further project was set up with out-reach teaching staff based at a junior special school for children with emotional and behavioural difficulties. This project aimed at incorporating the use of the protocol into the working practice of the out-reach team; at providing support through training to assure reliability of data collection; and at developing data analysis methodologies. The results of this project were used for training across primary schools. The protocol is also being used to guide positive and constructive feedback in consultations with teachers, and to collect data for
monitoring the outcomes of interventions.
INTERACTION PROFILING PROTOCOL (IPP)
The protocol was designed to record the following :
• the number of management strategies directed at the learning task and behaviour,
• the range of the management strategies used,
• the ratio of positive to negative strategies,
• the relative use of verbal and non-verbal strategies.
The IPP enables a skilled observer to record a broad range of management strategies, to distinguish and record whether the strategies are directed at the learning task or at behaviour, to record verbal as well as non-verbal strategies, and to record positive and preventative strategies, compared with negative and reactive strategies. These
pertinent, provide qualitative and quantitative information about interaction. This can be used to guide, monitor and evaluate progress in developing effective strategies for managing learning and behaviour. The materials developed and featured in the IPP included:
• notes on observational recording,
• a summary of environmental factors that impact upon learning ,
• a strategy list and record forms for making structured observations,
• illustrations showing individual and grouped data in profile and summary form,
• guidelines and recommendations on how to use the protocol,
• a full explanation of the strategies included in the observation form.
THE DATA
Forms were analysed and counts were taken on a series of variables that measured the number of times a particular teacher had identified a given activity. The variables were as follows:
GT Total number of strategies used TASK Number of task directed strategies BEH Number of behaviour oriented strategies VERB Number of verbal strategies
NV Number of non-verbal strategies
Data on all the variables was collected for a group of teachers. There are three sets of observations for most teachers. The first set corresponds to the observations taken by the educational psychologist on the first phase of the project before teachers received training in behaviour management strategies using the IPP. These observations are recorded in the data set with a short name for the relevant teacher, followed by a number 3; for example, ro3 refers to the results of the observation made on Rosemary in 1999. The second set contains the observations taken by the educational
psychologist after training had taken place. These observations are recorded by the same surname but without a number. In this way, comparison between ro3 and ro gives an indication of how much impact has the training received by Rosemary had on her classroom practice. This is a valid comparison since the same person has assessed Rosemary both before and after the training and the same observational instrument has been used in both cases. The third set contains the observations taken by another assessor trained in the operation of the IPP. Most of the times this was the
headteacher, although special school outreach teachers were also involved. Data taken on individuals is referred to with the same short name of the individual followed by number 2. Thus, ro and ro2 refer to two observations on Rosemary, one taken by the Educational Psychologist, and the other one taken by another individual trained in the operation of the IPP. Comparisons between the second and the third set of
observations makes it possible to explore consistency in the application of the IPP.
The total data set includes 12 variables and 32 observations on teachers. It is thus a matrix of thirty-two rows and twelve columns.
PROJECT FINDINGS - DESCRIPTIVE SUMMARY.
Some features of the data became apparent without engaging in any formal mathematical modelling. These are described here.
After the first set of observations, in the spring term 1999, findings showed that a high proportion of teachers' management strategies were directed at behaviour rather than the learning task - i.e. 38% directed at behaviour and 62% directed at task. Although teachers' strategies for managing the learning task and behaviour were significantly positive and constructive, in the case of behaviour strategies there was a much higher frequency of reminders (often accompanied by a change in tone of voice or delivery) and a much lower frequency in the use of praise and rewards. There were few
• Introduction of a mentoring system to involve peer consultation, paired work, joint teaching, and observation of teaching.
• Re-evaluation of the quality and delivery of reward systems, including pupil involvement in shaping rewards.
• Staff training, both whole school as well as individualised for particular teachers.
It was at this stage that the recommendation to apply the IPP after a reasonable lapse of time was made. This was accepted and the second set of observations was taken in the spring term 2000.
During the second visit, the headteacher was trained in using the protocol as a monitoring and improvement measure. Part of the training involved joint classroom observations with the educational psychologist. These are the observations included in the data set.
rise in the frequency of positive strategies directed at task (e.g., encourages response, gives praise or reward, gives compliment, uses verbal and non-verbal humour). There were also significant reductions in the use of negative strategies directed at behaviour (i.e. gives caution, warning, sanction, reminder). In fact, no cautions, warnings or sanctions were recorded in the second set of observations.
The data was also analysed using a scaling model. This is described below.
THE MODEL
Data modelling was performed using Multidimensional Scaling (MDS) and related multivariate statistical techniques. The modelling approach aims at representing in a graphical form the similarities between the teachers in their use of strategies, and the strategies that they use.
The question of in how many dimensions is the map to be built needs to be addressed. There are close connections between MDS and Principal Components Analysis
(PCA); Chatfield and Collins (1980). An assessment of the dimensionality of the map can be made by engaging first in a PCA exercise.
The results of the PCA served to guide MDS modelling. This resulted in a series of maps, or configurations, which were interpreted by means of Property Fitting techniques, or Pro-Fit for short. All these steps will be described in detail in what follows.
Principal Components Analysis
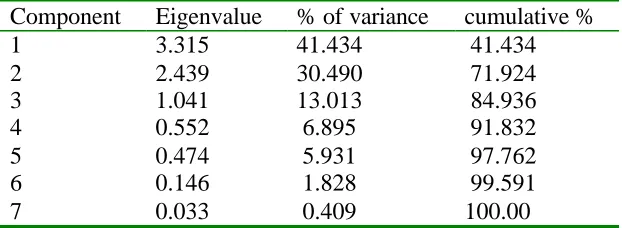
The data matrix was analysed using PCA. Variables that were obtained by adding other variables, such as the total number of positive activities observed, were excluded from this part of the analysis. Only three principal components had associated eigenvalues greater than 0.8, which was used as critical value following Jolliffe’s (1972) recommendation. The first principal component accounted for 41% of the variability in the data, the second one for a further 30% and the third one for 13%. The total variance accounted for by the first three principal components was just under 85%. The results can be seen in Table 1.
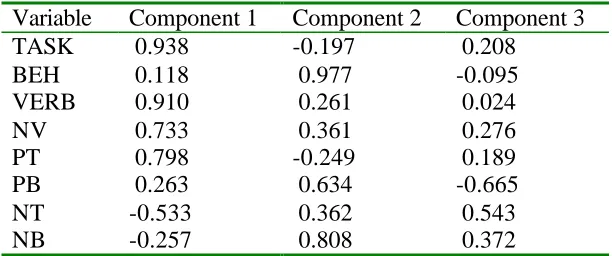
The component matrix for PCA is shown in Table 2. The variables that loaded high on the first principal component were: TASK, VERB, NV, PT, and NT. This component could be interpreted as an index of activities other than those related to behaviour. The variables that loaded high on the second component were BEH, PB, and NB. The second component can be interpreted as a measure of the use of
behaviour oriented strategies. The third component is difficult to interpret. It appears to be a contrast between activities negatively oriented to task, NT, and activities positively oriented to behaviour, PB.
The results of PCA suggest that the IPP serves to collect data on non-behaviour oriented strategies, and on behaviour oriented strategies. Thus, it is fulfilling well its objectives of informing about both aspects of the role of teachers. The complete results are given in Table 2.
TABLE 2 ABOUT HERE
Multidimensional Scaling
The results of PCA and factor analysis suggest that a MDS representation in three dimensions is appropriate, and that the configuration will contain data on total activity, behaviour activity, and negative activities. Following these preliminary analyses, it was decided to represent the data on a four dimensional space, the fourth dimension being treated as random variation.
Dissimilarities between observed teachers were calculated as follows. First, variables were standardised to mean zero and variance one. Second, dissimilarities were computed as Euclidean distances between standardised variables. Proceeding in this way is equivalent to using correlations as measures of dissimilarity; Coxon (1982). These dissimilarities were entered into the MDS algorithm ALSCAL, implemented in the computer package SPSS.
The results were very good. Stress 1, a measure of fit, took the value 0.003, which is described as “excellent” in Kruskal’s (1964) verbal classification. This is equivalent to a R2 value of 0.995 if the more traditional coefficient of determination is used to measure goodness of fit.
sub-spaces. Two projections are given here. The projection of the configuration on Dimension 1 and Dimension 2 is shown in Figure 1. The projection of the
configuration on Dimension 2 and Dimension 3 is shown in Figure 2.
FIGURES 1 AND 2 ABOUT HERE
Figures 1 and 2 graphically convey important information, but before we discuss this aspect, it is appropriate to engage in their interpretation. This is done with the help of Property Fitting techniques.
Property Fitting
dependent variable in the regression-, the coordinates of the teacher in the configuration being the explanatory variables. A regression was run for every strategy and regression coefficients were calculated. These were standardised to unit length, so that the length of the projection reflects the importance of the strategy in the particular plot. Only the first three standardised directional cosines, γ1 γ2γ3 , were
plotted, and these are reproduced in Table 3. This table also shows significance levels, and measures of goodness of fit. The vectors have been superimposed on Figure 1 and Figure 2.
TABLE 3 ABOUT HERE
Vectors GTOT, VERB, TP, TASK, NV, and PT point towards the positive side of Dimension 1 in Figure 1, indicating that this dimension is associated with the total number of strategies used, the total number of positive strategies, the number of task oriented strategies, the number of verbal strategies, the number of non-verbal
strategies, and the number of positive strategies. This dimension appears to be related to the activity of communicating knowledge and to the teaching function.
• a high percentage of strategies directed at the learning task rather than at behaviour,
• a large number of strategies used (high frequency),
• a broad range of strategies employed, including verbal and non-verbal strategies (flexibility),
• strategies used skilfully and in combination (fluency),
• a high frequency of positive and preventative strategies,
• no evidence of negative or reactive strategies.
The third dimension appears to capture orientation to task, as the vectors that most approach the third axes are TASK and NT, as can be seen in Figure 2.
Assessing the teachers
Property vectors are the mariner’s compass that makes it possible to put teachers’ skills into context. Take, for example, Gale, on the right hand side of Figure 1. Her position on the map at the extreme end of vectors VERB, TP, TASK, and PT indicates that she used more positive activities, both verbal and task oriented, that many other teachers when observed in 2000. Her central position with respect to Dimension 2 suggests that she is average on the use of behaviour oriented activities, both positive and negative. She was not observed in 1999, hence nothing can be said about the way in which training affected her teaching.
Six teachers were observed by the education psychologist during the 1999 visit and the 2000 visit. It is possible to use Figures 1 and 2 to assess the impact of the training received. The six teachers are Susan (Su), Rosemary (Ro), Vicky (Vky), Linda (Lda), Josie (Jo), and Mandy (Ma). Movements along Dimension 1 reflect an increased use of strategies oriented to the teaching function, both task oriented and verbal oriented, and an increased use of positive strategies. Except for Su, whose position on
Movements along the second dimension indicate changed reliance on behaviour oriented strategies, and on negative strategies. It can be seen that five teachers observed on two opportunities have moved down along this dimension. The position on the third dimension of the only teacher who did not move down, Ro, remained almost unchanged; but this is precisely the teacher that underwent the largest change along the first dimension.
The study of movements along the third dimension, which can be observed in Figure 2, does not lead to any general conclusion. Some teachers have moved towards the positive side of this dimension, indicating less reliance on negative strategies, and some teachers have moved towards the negative side of this dimension, indicating more reliance on negative strategies. Clearly, less use of negative strategies is, in principle, to be desired, but one should not conclude that the results are inconclusive, since movements towards the positive end of the third dimension are larger than movements towards the negative side. Two teachers, Vky and Lda, have moved dramatically towards using more positive behaviour oriented strategies and less negative strategies.
class. Any teacher who fits this description would appear on the plot near a teacher who makes relatively little use of strategies on account of being less competent at the job she/he is doing.
CONCLUSIONS
The structured observation protocol provides relatively quick access to a rich source of information about the strategies that teachers actually use to manage learning and behaviour in class. It has been used for consultative and training purposes with individual teachers and entire school staff at infant, junior and secondary school levels. Preliminary findings suggest that it is robust, capable of yielding reliable results. The protocol is being used by out-reach teachers at the beginning and end of casework interventions in primary schools, as a means for collecting data and, above all, to guide positive and constructive consultations with teachers. The analysis of the changes at a classroom level, in the use of a range of classroom management
different types of strategy at different developmental stages. Ongoing work is planned to use and refine the Interaction Profiling Protocol, and to assess its reliability and efficacy.
The school was inspected again by OFSTED in September 2000. The inspectors’ report commented as follows
REFERENCES
Argyle, M. (1967) The Psychology of Interpersonal Behaviour. Penguin Books, Harmondsworth, UK.
Argyle, M., Salter, V., Nicholson, H., Williams, M., Burgess, P.(1970) "The communication of inferior and superior attitudes by verbal and non-verbal signals". Brit. J. Soc. Clin. Psychol., 9, 221-31.
Biemans, H. (1990) "Video Home Training : Theory, Method and Organisation of SPIN" in KOOL et al. International Seminar for International Institutions.
Netherlands Ministry of Welfare, Health and Culture, Ryswijk.
Birdwhistell, R.L. (1970) Kinesics and Context - Essays on Body-Motion Communication.Penguin Press, Harmondsworth.
Cassirer, E.(1944) An Essay on Man. Yale University Press, New Haven.
Chatfield, C and Collins, A.J. (1980) Introduction to Multivariate Analysis. Chapman and Hall. London, UK.
Chomsky, N. (1996) Powers and Prospects. Pluto Press, London.
Coxon, A.P.M. (1982) The user’s guide to Multidimensional Scaling. Heinemann Educational Books. London, UK.
Flanders, N. A. (1974) "Basic Teaching Skills Derived From a Model of Speaking and Listening." Journal of Teacher Education, 24 (1) 24-37.
Fowler, H.W. and Fowler, F.G. (1969) The Concise Oxford Dictionary of Current English.Oxford University Press, London.
Jollifffe, I.T. (1972) Discarding variables in a principal components analysis. Applied Statistics, 21, 160-173.
Kruskal, J.B. (1964) Multidimensional Scaling by optimising goodness of fit to a non-metric hypothesis. Psychonon-metrica, 29, 1-27.
Kruskal, J.B. and Wish, M. (1978) Multidimensional Scaling. Sage University Paper series on Quantitative Applications in the Social Sciences, number 07-011. Sage Publications. Newbury Park, CA
Goffman, E. (1956) The Presentation of Self in Everyday Life. Penguin Books. Harmondsworth., UK.
Merrett, F. and Wheldall, K. (1986) "Observing Pupils and Teachers In Classrooms (OPTIC): a behavioural observation schedule for use in schools." Positive Products, Birmingham.
Roberts, D. (1997) "Developmental Groupwork: Encouraging skills in self-expression for pupils with emotional and behavioural difficulties." Educational Psychology In Practice, 13(2)122-129.
Schiffman, S.S., Reynolds, M.L. and Young, F.W. (1981) Introduction to multidimensional Scaling. Academic Press. London. UK.
Component Eigenvalue % of variance cumulative % 1
2 3 4 5 6 7
3.315 2.439 1.041 0.552 0.474 0.146 0.033
41.434 30.490 13.013 6.895 5.931 1.828 0.409
[image:29.596.85.396.86.200.2]41.434 71.924 84.936 91.832 97.762 99.591 100.00
Variable Component 1 Component 2 Component 3 TASK
BEH VERB NV PT PB NT NB
0.938 0.118 0.910 0.733 0.798 0.263 -0.533 -0.257
-0.197 0.977 0.261 0.361 -0.249 0.634 0.362 0.808
[image:30.596.84.390.101.229.2]0.208 -0.095 0.024 0.276 0.189 -0.665 0.543 0.372
Standardised Directional cosines F Adj R2
γ1 γ 2 γ 3
GTOT 0.89 0.38 -0.24 382.6 0.980 (36.6)** (13.2)** (-5.5)**
TASK 0.90 -0.22 -0.37 180.6 0.959 (25.7)** (-5.3)** (-5.8)**
BEH 0.11 0.98 0.16 264.7 0.971 (4.1)** (32.0)** (3.4)**
VERB 0.83 0.29 -0.03 106.2 0.931 (19.6)** (5.9)** (-0.3)
NV 0.52 0.29 -0.38 70.9 0.900 (12.8)** (6.0)** (-5.1)**
PT 0.67 -0.22 -0.25 37.7 0.826 (10.9)** (-3.0)** (-2.2)*
PB 0.16 0.50 0.78 492.2 0.989 (15.6)** (14.4)** (14.5)**
NT -0.31 0.29 -0.65 501.6 0.989 (-7.2)** (5.8)** (-8.3)**
NB -0.20 0.79 -0.56 364.8 0.985 (-3.2)** (10.9)** (-4.9)**
TP 0.68 0.00 0.11 419.2 0.987 (13.7)** (0.05) (1.2)
TN -0.22 0.77 -0.60 571.4 0.990 (-4.2)** (12.5)** (-6.3)**
[image:31.596.126.515.102.440.2]** Significant at the 0.01 level * Significant at the 0.05 level
DIM 1 4 3 2 1 0 -1 -2 -3 -4 4 3 2 1 0 -1 -2 -3 -4 3trev 3chris 3ma 3ro 3vky 3su
3lda 3jo 2gale
2mich 2stikcle
2deb
2ma 2drew 2ro
2an 2vky 2su 2lda 2jo gale mich stickler deb ma ro drew an vky su lda jo
DIM 2 TN
Figure 1. MDS configuration. Projection on Dimension 1 and Dimension 2. DIM 1 4 3 2 1 0 -1 -2 -3 -4 4 3 2 1 0 -1 -2 -3 -4 3trev 3chris 3ma 3ro 3vky 3su
3lda 3jo 2gale
2mich 2stikcle
2deb
2ma 2drew 2ro
2an 2vky 2su 2lda 2jo gale mich stickler deb ma ro drew an vky su lda jo
DIM 2 TN