ORIGINAL RESEARCH
SPINE
A Better Characterization of Spinal Cord Damage in Multiple
Sclerosis: A Diffusional Kurtosis Imaging Study
E. Raz, M. Bester, E.E. Sigmund, A. Tabesh, J.S. Babb, H. Jaggi, J. Helpern, R.J. Mitnick, and M. Inglese
ABSTRACT
BACKGROUND AND PURPOSE: The spinal cord is a site of predilection for MS lesions. While diffusion tensor imaging is useful for the study of anisotropic systems such as WM tracts, it is of more limited utility in tissues with more isotropic microstructures (on the length scales studied with diffusion MR imaging) such as gray matter. In contrast, diffusional kurtosis imaging, which measures both Gaussian and non-Gaussian properties of water diffusion, provides more biomarkers of both anisotropic and isotropic structural changes. The aim of this study was to investigate the cervical spinal cord of patients with MS and to characterize lesional and normal-appearing gray matter and WM damage by using diffusional kurtosis imaging.
MATERIALS AND METHODS: Nineteen patients (13 women, mean age⫽41.1⫾10.7 years) and 16 controls (7 women, mean age⫽35.6⫾ 11.2-years) underwent MR imaging of the cervical spinal cord on a 3T scanner (T2 TSE, T1 magnetization-prepared rapid acquisition of gradient echo, diffusional kurtosis imaging, T2 fast low-angle shot). Fractional anisotropy, mean diffusivity, and mean kurtosis were measured on the whole cord and in normal-appearing gray matter and WM.
RESULTS: Spinal cord T2-hyperintense lesions were identified in 18 patients. Whole spinal cord fractional anisotropy and mean kurtosis (P⫽ .0009,P⫽.003), WM fractional anisotropy (P⫽.01), and gray matter mean kurtosis (P⫽.006) were significantly decreased, and whole spinal cord mean diffusivity (P⫽.009) was increased in patients compared with controls. Mean spinal cord area was significantly lower in patients (P⫽.04).
CONCLUSIONS: Diffusional kurtosis imaging of the spinal cord can provide a more comprehensive characterization of lesions and normal-appearing WM and gray matter damage in patients with MS. Diffusional kurtosis imaging can provide additional and complemen-tary information to DTI on spinal cord pathology.
ABBREVIATIONS:DKI⫽diffusional kurtosis imaging; EDSS⫽Expanded Disability Status Scale; GM⫽gray matter; MK⫽mean kurtosis; SC⫽spinal cord
M
ultiple sclerosis is a chronic inflammatory/demyelinating and neurodegenerative disease of the central nervous sys-tem and the most common cause of nontraumatic disability inyoung adults.1The spinal cord is a site of predilection for MS
lesions,2and SC damage contributes to the onset of neurologic
deficits and the development of clinical disability.3At
postmor-tem examination, 86% of patients with MS have spinal cord le-sions,2and MR imaging cord abnormalities are detected in up to
89% of patients with established disease.4However, previous MR
imaging studies of patients with MS found a poor correlation between the number and volume of T2-hyperintense SC le-sions and disability,5very likely due to the presence of
addi-tional microscopic abnormalities in the so-called normal-ap-pearing white matter, not detectable by conventional MR imaging techniques.6,7
Several pathologic studies of MS spinal cord samples have shown that not only SC WM but also GM is affected by demyeli-nation and neuronal loss.8-11Despite these reports and unlike
findings reported in the brain, only a few in vivo MR imaging studies to date have investigated the presence and extent of spinal cord GM damage in patients with MS.12-14
Received November 21, 2012; accepted after revision December 24.
From the Department of Radiology (E.R., M.B., E.E.S., A.T., J.S.B., H.J., R.J.M., M.I.), New York University School of Medicine, New York, New York; Department of Neurology and Psychiatry (E.R.), Sapienza University, Rome, Italy; Department of Neuroradiology (M.B.), Eppendorf-Hamburg University, Hamburg, Germany; Department of Neurology, Radiology and Neuroscience (M.I.), Mount Sinai School of Medicine, New York, New York; and Departments of Radiology and Radiological Science (A.T., J.H.) and Neurosci-ences (J.H.), Medical University of South Carolina, Charleston, South Carolina. E. Raz and M. Bester contributed equally to the article.
This work was supported in part by the National Institutes of Health (NIH, grant R01NS051623).
Paper previously presented at: 19th Annual Meeting of the International Society for Magnetic Resonance in Medicine, June 4 –9, 2011; Seattle, Washington.
Please address correspondence to Matilde Inglese, MD, Department of Neurology, Mount Sinai School of Medicine, One Gustave L. Levy Place, Box 1137. New York, NY 10029; e-mail: [email protected]
Indicates open access to non-subscribers at www.ajnr.org
DTI is a clinically important MR imaging method used to measure the micron scale displacement of water molecules in the brain and can provide information about tissue structural integ-rity at a microscopic level.15Recent DTI studies of the spinal cord
in patients with MS indeed showed a significant decrease in frac-tional anisotropy, a measure of WM fiber integrity and direction-ality, compared with healthy controls in both lesions and normal-appearing tissue.16-24The DTI model, however, is based on the
assumption that the displacement probability function of diffus-ing water molecules follows a Gaussian distribution, which is only the first approximation to the true behavior in complex tissue. Therefore, while the anisotropic sensitivity of DTI is useful for the study of highly organized systems such as WM tracts, it provides fewer useful biomarkers in tissues such as GM. This is because for the length scales studied with diffusion MR imaging (ie, a few microns), the microstructure of GM is characterized as isotropic. Conversely, non-Gaussian diffusion may be more sensitive to subtle pathologic changes in GM because diffusional non-Gaussi-anity is a direct consequence of diffusion barriers and compart-ments, regardless of the presence of microstructural anisotropy.25
Among the MR imaging techniques that have been developed to assess non-Gaussian diffusion in spinal cord tissue,13,15
diffu-sional kurtosis imaging25 represents the minimal extension of
DTI that, in acquisition times compatible with clinical applica-tion, enables the quantification of non-Gaussian diffusion through the estimation of the diffusional kurtosis. A DKI-derived metric, the mean kurtosis, provides a measure of the deviation of the diffusion probability distribution from a Gaussian form.25,26
MK has been shown to be sensitive to structural changes in both anisotropic tissue, such as WM, and isotropic tissue such as GM and therefore may provide information on tissue microarchitec-ture complementary to that given by fractional anisotropy and mean diffusivity.25Using a moderately expanded
diffusion-sam-pling scheme, MK can be obtained simultaneously with conven-tional DTI,27,28and it has already been used to study the brain in
normal aging,27Alzheimer disease,29 traumatic brain injury,30
brain tumors,31stroke,32and the spinal cord in patients with
cer-vical myelopathy.33
The aims of our study were the following: 1) to investigate global and regional (WM and GM) microstructural abnormalities in the cervical spinal cord of patients with MS compared with healthy controls by using MK, mean diffusivity, and fractional anisotropy; 2) to determine whether cervical cord MK provides additional information about the underlying structural abnor-malities compared with mean diffusivity and fractional anisot-ropy; 3) to assess the relationship between cervical spinal cord DKI-derived parameters and measures of cord area and volume; and 4) to determine the clinical impact of global and regional cervical spinal cord DKI-derived metrics.
MATERIALS AND METHODS
Patients
The study was approved by the institutional review board of New York University and complies with the Health Insurance Porta-bility and AccountaPorta-bility Act. Written informed consent was ob-tained from all participants. For this prospective study, we re-cruited 21 consecutive patients with clinically definite MS34who
were referred from the New York University MS Center to our
department for cervical spinal cord MR imaging between August 2009 and March 2010 and who met the following inclusion crite-ria: 1) had a diagnosis of relapsing-remitting MS, 2) were between 18 and 60 years of age, and 3) had an absence of clinical relapse and/or steroid treatment in the 3 months before MR imaging. The exclusion criteria were the presence of other relevant diseases and contraindications to performing MR imaging. Two patients were excluded because of claustrophobia.
All subjects underwent a neurologic evaluation. The following demographic and clinical variables were collected for each pa-tient: age, disease duration from diagnosis, disease duration from symptom onset, and level of disability assessed by the EDSS. The 19 patients had a mean age of 41.1⫾10.7 years. There were 13 women (mean age⫽40.1⫾10.7 years) and 6 men (mean age⫽ 43.1⫾11.5 years).
Sixteen healthy controls (mean age⫽35.6⫾11.2 years, 9 men and 7 women) with no known brain abnormalities and no neu-rologic symptoms were recruited as controls and given the same MR imaging examination as described above.
MR Imaging Acquisition
MR imaging was performed by using a 3T scanner (Tim Trio; Siemens, Erlangen, Germany) with a 4-channel neck phased array coil, and the following imaging protocol was used in all subjects during a single MR imaging session:
1) A sagittal T2-weighted TSE sequence with 15 contiguous sections (TR⫽3500 ms, TE⫽113 ms, FOV⫽240 mm, matrix⫽ 512 ⫻512, section thickness⫽ 3 mm, in-plane resolution⫽ 0.46⫻0.46 mm2).
2) Sagittal T1-weighted 3D MPRAGE on 24 contiguous sec-tions (TR⫽2300 ms, TE⫽2.98 ms, TI⫽900 ms, FOV⫽240 mm, matrix⫽230⫻256, isotropic voxel size⫽1⫻1⫻1 mm3).
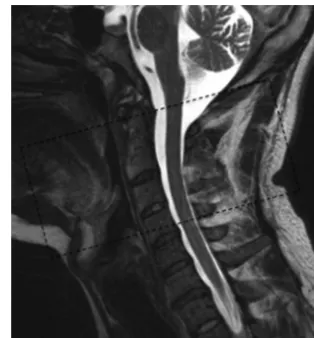
3) An axial DKI sequence, centered on the spinal intervertebral disk between C2 and C3 (a slab position is visible in Fig 1), by using a twice-refocused spin-echo diffusion sequence with an echo-planar imaging readout35with 30 different
diffusion-en-coding directions by using an optimized sampling strategy36,37
[image:2.594.338.495.46.215.2]TE⫽110 ms, FOV⫽160 mm, matrix⫽128⫻128, section thickness⫽3 mm, number of averages⫽2, in-plane resolution⫽ 1.25⫻1.25 mm2, acquisition time⫽15 minutes 7 seconds).
4) An axial T2-weighted fast low-angle shot MR imaging se-quence, centered on the spinal intervertebral disk between C2 and C3, with 24 contiguous sections (TR⫽500 ms, TE⫽7.38 ms, FOV⫽176 mm, matrix⫽192⫻320, section thickness⫽3 mm, in-plane resolution⫽0.68⫻0.68 mm2).
5) Only in the 19 patients, an additional sagittal T2 STIR se-quence with 13 contiguous sections was acquired (TR⫽4500 ms, TE⫽53 ms, TI⫽200 ms, FOV⫽240 mm, matrix⫽480⫻480, section thickness⫽3 mm, in-plane resolution⫽0.37⫻0.37 mm2).
Postprocessing
Image data processing and evaluation were performed by an MR imaging expert and a neuroradiologist. T2-weighted and STIR im-ages were used to identify and count the lesions in the spinal cord.
DKI/DTI Analysis
Diffusion and kurtosis tensors were calculated by using in-house software (Diffusion and Kurtosis Estimator) in Matlab, Version 7.0 (MathWorks, Natick, Massachusetts); maps of derived pa-rameters, fractional anisotropy, mean diffusivity, and MK, were generated after first coregistering all diffusion-weighted images with a 2D rigid-body algorithm.38After we derived apparent
dif-fusion and kurtosis along each applied gradient direction via a quadratic fit to the logarithm of the signal intensity, the analysis algorithm, described in detail in Tabesh et al,38used a linearly
constrained linear least-squares formulation to solve for both the diffusion and kurtosis tensors at each voxel. Using region-of-in-terest analysis, we measured mean fractional anisotropy, mean diffusivity, and MK values of the entire cross-sectional cord area between C1 and C4 (5 contiguous sections for each level), gener-ating 20 values for each of the DTI metrics in each subject (alto-gether 380 SC sections for 19 patients). Of 380 sections, 165 in-cluded T2 visible lesions, whereas the remaining 215 were classified as normal-appearing spine tissue.
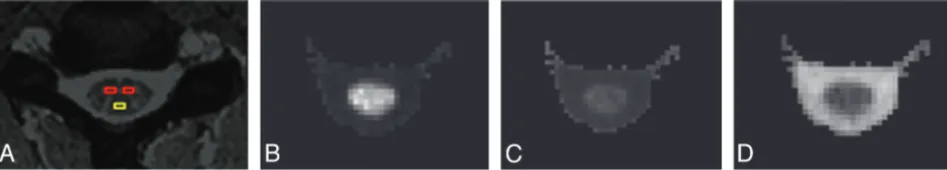
The lesions were outlined on the T2-weighted images by using Medical Image Processing, Analysis, and Visualization (http:// mipav.cit.nih.gov). Then, the outlined regions of interest were automatically transferred onto the corresponding DKI/DTI maps, and the mean lesional fractional anisotropy, mean diffusiv-ity, and MK values were measured. In addition, mean fractional anisotropy, mean diffusivity, and MK values of normal-appearing
GM and WM were measured by using rectangular ROIs (size: 2 voxels, 3.1 mm2) placed on the T2 images in the left and right
ventral horns and in the dorsal columns over 2 contiguous sec-tions at the C2 level, as described in Freund et al (Fig 2).39The
regions of interest were then opened on the registered DKI/DTI maps, and the mean values for GM/WM were calculated by aver-aging the results obtained in all ROIs (4 ROIs for GM, 2 ROIs for WM). This regional analysis was performed on patients (14 of 19) who did not show any lesions at the C2 level.
Cervical Spinal Cord Area and Volume Measurement
Cervical cord area and volume were measured on T1 MPRAGE images. For each subject, five 3-mm-thick axial sections perpen-dicular to the spinal cord were reconstructed, centering on the C2–3 intervertebral disk, and an established semiautomated tech-nique was used to measure the cross-sectional cord area.40The
volume of the cervical cord section between C2 and C4 was eval-uated by using BrainMask software (http://www.nitrc.org/ projects/brainmask)41by using 3D edge-detection algorithms,
al-lowing volume selection with 3 simultaneous reference planes. Because the software is suboptimal for the evaluation of a curved object, the volume between C2 and C4 was selected as represen-tative of the entire cervical cord volume.
Statistical Analysis
Statistical analysis was performed by using SAS (SAS Institute, Cary, North Carolina). The DKI/DTI values were represented for each subject as an average over the values recorded for each spine location. As a result, each subject contributed 1 value of each of MK, mean diffusivity, and fractional anisotropy for the total SC (including lesions) and over the normal-appearing SC. Addition-ally, in patients with MS without visible lesions at the C2 level and in healthy controls, fractional anisotropy, mean diffusivity, and MK were measured in normal-appearing spinal cord tissue (GM and WM). Analysis of covariance was used to compare patients and con-trols in terms of the total and regional values of MK, mean diffusivity, and fractional anisotropy, adjusting for age, sex, and disease dura-tion, and to compare the 2 groups of patients stratified according to the EDSS score (group 1: EDSS scoreⱕ2.5, female/male ratio⫽9:2, mean age⫽39.0⫾8.9 years, mean disease duration⫽8.5⫾6.0 years; group 2: EDSS scoreⱖ3.0, female/male ratio⫽4:4, mean age⫽44.0⫾12.0 years, mean disease duration⫽5.7⫾3.0 years) adjusting for age, sex, disease duration, number of lesions, and cord area.
[image:3.594.58.532.48.133.2]The error variance was allowed to differ across subject groups to remove the unnecessary assumption-of-variance homogeneity. A paired-samplettest was used to compare WM and GM at the lesion level with corresponding normal-appearing tissue in terms of each DKI measure.
Pearson correlations were used to characterize the association of the DKI measures from the whole cervical spine and from the GM and WM, separately, with spinal cord volume and area and EDSS. AllPvalues are reported as 2-sided significance levels with-out adjustment for multiple comparisons and were considered statistically significant whenP⬍.05.
RESULTS
Nineteen patients had a median EDSS score of 2.5 (range⫽1– 6.5). Mean disease duration from the diagnosis was 7.3⫾5.2 years, while mean disease duration from symptom onset was 10.1⫾7.8 years. Fifty-nine T2 hyperintense lesions were identified in 18 of 19 pa-tients, with a median of 3 lesions per patient (range⫽0 – 8).
Cross-sectional mean MK and frac-tional anisotropy (both unitless) and mean diffusivity (⫻10⫺3mm2/s) values
in patients and controls for the whole cervical spinal cord examined are re-ported in Fig 3. Compared with con-trols, fractional anisotropy and MK were significantly decreased (respectively,
P⫽.0009 andP⫽.003) and mean dif-fusivity was increased (P ⫽ .009) in patients.
In patients with MS, when mean dif-fusivity, MK, and fractional anisotropy values of sections with lesions were com-pared with the values in sections of nor-mal-appearing spine tissue, the 3 pa-rameters differed significantly (Table 1): fractional anisotropy and MK were lower and mean diffusivity was higher in lesions than in normal-appearing spine tissue (allP⬍.0001).
Mean MK, fractional anisotropy, and mean diffusivity values of GM and WM ROIs were compared at the C2–3 level in healthy subjects and patients with MS without visible lesions at that level (n⫽14); the results are reported in Table 2. In patients, normal-appearing WM fractional anisotropy and normal-normal-appearing GM MK values were significantly decreased compared with those in healthy controls while mean diffusivity, GM fractional anisot-ropy, and WM MK were not significantly different across the 2 groups of subjects.
MK and mean diffusivity values were significantly inversely correlated to each other in the whole SC, in lesions, and in normal WM (r⫽ ⫺0.76,P⫽.0006;r⫽ ⫺0.2,P⫽.01; andr⫽ ⫺0.69,P⫽
.001, respectively) but not in the gray matter (P⫽.9).
The mean cervical cord cross-sectional area measured at C2–3 was 0.93⫾0.06 cm2in the patient group, significantly lower than
that in the control group (0.94⫾0.08 cm2,P⫽.04). Mean C2– 4
volume of the cervical spinal cord was 2.70⫾0.34 cm3in patients
[image:4.594.61.528.46.214.2]and 2.96⫾0.36 cm3in controls (P⫽.7). Table 1: The mean of DKI/DTI measures of the whole spinal cord over sections with lesions
(nⴝ145) and over sections of normal-appearing spine tissue (nⴝ215) in patients with MSa
Measurec Lesions NAST PValueb
FA 0.42⫾0.02 0.52⫾0.04 ⬍.0001
MD 1.17⫾0.08 0.92⫾0.05 ⬍.0001
MK 0.91⫾0.03 1.08⫾0.08 ⬍.0001
Note:—NAST indicates normal-appearing spine tissue; FA, fractional anisotropy; MD, mean diffusivity. aOnly data from subjects with lesions (n⫽18) were included in the computations.
b
Pvalues are from ANCOVA, comparing lesions to normal-appearing spine tissue in terms of the indicated DKI measure adjusted for age, sex, and disease duration.
c
FA and MK are unitless. MD is measured in⫻10⫺3 mm2
/s.
Table 2: The mean of DKI measures at the C2–3 level in patients with MS and controls
Measure Location Controls Patients with MS PValuea
FA GM 0.81⫾0.11 0.70⫾0.19 .4
WM 0.63⫾0.07 0.52⫾0.07 .01
MD GM 0.56⫾0.08 0.72⫾0.21 .1
WM 0.86⫾0.14 0.99⫾0.13 .06
MK GM 1.16⫾0.13 1.11⫾0.09 .006
WM 1.15⫾0.17 1.08⫾0.12 .08
Note:—FA indicates fractional anisotropy; MD, mean diffusivity.
aPvalues are from ANCOVA, comparing patients with normal-appearing spine tissue at the C2–3 level (n⫽14) with controls in terms of WM and GM DKI measures adjusted for age, sex, and disease duration.
[image:4.594.54.376.279.325.2] [image:4.594.53.377.396.472.2]Finally, we did not find any significant correlation of SC, MK, fractional anisotropy, and mean diffusivity values with either spine volume or spine area, except for the WM MK and cervical spine volume (r⫽0.58 andP⫽.0089).
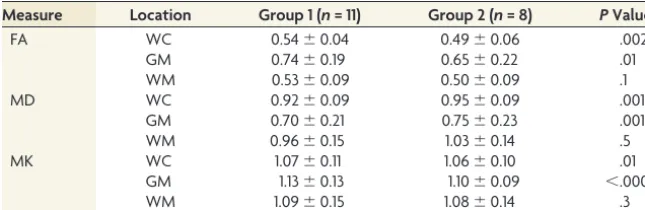
Likewise, no significant correlations were found among any MK, fractional anisotropy, and mean diffusivity values and EDSS. However, when the patients were stratified into 2 groups on the basis of the median EDSS score, more disabled patients (group 2) showed significantly lower fractional anisotropy and MK and higher mean diffusivity of the total cervical SC after correcting for age, sex, disease duration, and number of lesions. Most interest-ing, the locally sampled GM region showed lower MK and frac-tional anisotropy and higher mean diffusivity in the more dis-abled class, while the locally sampled WM did not show significant differences between the EDSS groups. Total and re-gional SC MK, fractional anisotropy, and mean diffusivity values from the 2 groups of patients are compiled in Table 3.
DISCUSSION
The spinal cord is frequently involved in MS, and it is a clinically eloquent site of damage with a relevant contribution to the accu-mulation of irreversible physical disability.42 There is growing
evidence indicating that MS tissue damage in both the brain and SC is not limited to WM but also involves the GM.13Our DKI
study in patients with MS showed extensive cervical spinal cord damage and particularly more severely at the lesional level than in normal-appearing tissue. This is in agreement with previous DTI studies that found decreased fractional anisotropy values and in-creased mean diffusivity values in the cervical SC of patients with MS in comparison with healthy controls.16,20The pathologic
sub-strate underlying the changes in DTI metrics is represented by demyelination and axonal loss occurring in spinal cord T2-visible lesions and in normal-appearing tissue.43,44Both demyelination
and axonal loss lead to an increase of the extracellular volume,8
which is reflected by reduced fractional anisotropy and increased mean diffusivity. In addition, intracellular abnormalities that de-termine the formation of new barriers, such as cell debris, inflam-matory changes, and gliosis, restrict water isotropically and can cause reductions in fractional anisotropy.8
More recently, several pathologic studies8-11,45demonstrated
that extensive demyelination and neuronal loss occur in the SC GM. Although neuronal loss appears to be predominantly related to local GM plaques, interneuron atrophy occurs in both myelin-ated and demyelinmyelin-ated areas.46In line with these findings, our
study showed a significant decrease of MK in the SC normal-appearing GM of patients compared with controls. Al-though we can only speculate about the pathologic nature of the GM MK change, it is likely to reflect both the presence of GM lesions below the reso-lution of conventional T2-weighted scans and the degeneration of GM neu-rons secondary to axonal transactions in the WM. Although we did not find a sig-nificant association between SC lesion count and GM MK (r⫽0.3,P⫽.1), there was a trend toward a significant positive association between the decrease of WM MK and that of GM MK (r⫽0.44,P⫽.06), suggesting a possible interplay between injury in WM and GM.
While in WM, fractional anisotropy was sensitive to disease-related tissue damage and there was a trend toward significance for mean diffusivity and MK, in GM, only MK was significantly different between patients and controls, suggesting that it could be a more sensitive metric for evaluating the GM than mean dif-fusivity and fractional anisotropy. While standard DTI metrics can characterize the diffusion of water molecules in 3D space, they are not able to provide more specific information about its mi-croenvironment. For example, mean diffusivity can indicate that the average water diffusion distance is small, but it cannot differ-entiate whether the small diffusion distance is due to a more vis-cous environment or the presence of more barriers, such as cell membranes.25A decrease in MK more clearly represents a
reduc-tion in diffusional heterogeneity; in the case of spinal cord tissue, this is very likely associated with degenerative changes and neu-ronal shrinkage.25,26,29,47Hence, MK is a more natural indicator
of tissue microstructural properties because diffusional non-Gaussianity is a direct consequence of the presence of barriers and compartments.
The lack of correlation between average mean diffusivity and MK in the GM of our patients and the poor correlation between the 2 metrics in lesional SC further supports the notion that MK of the GM can provide information about the underlying tissue mi-croarchitecture that is different and complementary to that ob-tained with conventional DTI.
We did not find a significant correlation between any of the DKI-derived metrics in the global and regional cervical SC and the EDSS score. This result may be influenced by the small sample size and the narrow range of EDSS scores for most patients. However, when the patients were stratified on the basis of the median EDSS score into 2 groups with high and low disability, more disabled patients showed significant differences in total SC and GM DKI metrics compared with less disabled patients. This finding sug-gests that the severity of SC GM damage might have a role in the development of irreversible disability and is consistent with the results of previous MR imaging studies of SC GM by using mag-netization-transfer imaging.12,14
[image:5.594.53.376.56.161.2]This study has some limitations. The number of patients en-rolled allowed us to investigate the potential of a new MR imaging technique such as DKI, but it is relatively low, and our results will
Table 3: The mean of DKI measures for the 2 groups, based on the median EDSS scorea
Measure Location Group 1 (n= 11) Group 2 (n= 8) PValueb
FA WC 0.54⫾0.04 0.49⫾0.06 .002
GM 0.74⫾0.19 0.65⫾0.22 .01
WM 0.53⫾0.09 0.50⫾0.09 .1
MD WC 0.92⫾0.09 0.95⫾0.09 .001
GM 0.70⫾0.21 0.75⫾0.23 .001
WM 0.96⫾0.15 1.03⫾0.14 .5
MK WC 1.07⫾0.11 1.06⫾0.10 .01
GM 1.13⫾0.13 1.10⫾0.09 ⬍.0001
WM 1.09⫾0.15 1.08⫾0.14 .3
Note:—FA indicates fractional anisotropy; MD, mean diffusivity; WC, whole cord. a
Group 1: EDSS scoreⱕ2.5; group 2: EDSS scoreⱖ3.0. b
need to be confirmed in a larger sample including patients with different disease courses.
The small size of the SC and the moderate resolution of DWI sequences make it difficult to avoid partial volume effects espe-cially in relation to GM and WM assessment; however, the group level changes in the DKI metrics are robust and consistent with expectations. We acknowledge that even though patients and controls were not exactly sex-matched, all our statistical analyses were corrected for age and sex, thus limiting the possibility of lack of sex-matching being a confounding factor. In addition, al-though we found a moderate correlation between WM injury and cord volume as already reported in the literature,9we found no
association between any of the GM DKI metrics and cord volume or area, suggesting that the difference between patients and con-trols is not entirely attributable to partial volume effects. Further-more, because the spatial resolution of our DKI images did not allow a more detailed identification of the ventral and lateral white matter columns, we limited our laminar assessment to the dorsal columns and the central GM region. Finally, a better inter-pretation of MK changes in the GM of the MS spinal cord will be available when the pathologic substrates are identified by post-mortem high-resolution MR imaging and/or quantitative histo-pathologic studies.
CONCLUSIONS
DKI of the cervical spinal cord in patients with MS can be useful for a better characterization of lesions and normal-appearing white and gray matter damage, with acquisition times compatible with clinical applications. With DKI, MK can be obtained simul-taneously with conventional DTI-derived parameters; because its structural sensitivity is not limited to spatially oriented tissue structures, it can provide additional information complementary to that provided by DTI. Although our SC DKI findings are pre-liminary, our study supports the results of previous studies on DTI of the SC and suggests that gray matter damage may play a key role in accrual of disability in MS.
ACKNOWLEDGMENTS
E.R. thanks Centro Interuniversitario di Formazione Internazi-onale (H2CU) from Sapienza University of Rome for its support.
Disclosures: Eric E. Sigmund—RELATED:Support for Travel to Meetings for the Study or Other Purposes: American Society of Spine Radiology,Comments: invited to give educational lecture on ultra-high-field spinal cord MRI, with travel expenses compensated at the Annual Symposium of the American Society of Spine Radiology, February 16 –19, 2012. Matilde Inglese—RELATED: Grant:National Institutes of Health (NIH).* *Money paid to the institution.
REFERENCES
1. Noseworthy JH, Lucchinetti CF, Rodriguez M, et al.Multiple sclero-sis.N Engl J Med2000;343:938 –52
2. Ikuta F, Zimmerman HM.Distribution of plaques in seventy au-topsy cases of multiple sclerosis in the United States.Neurology
1976;26:26 –28
3. Bjartmar C, Wujek JR, Trapp BD.Axonal loss in the pathology of MS: consequences for understanding the progressive phase of the disease.J Neurol Sci2003;206:165–71
4. Rocca MA, Mastronardo G, Horsfield MA, et al.Comparison of three MR sequences for the detection of cervical cord lesions in patients with multiple sclerosis.AJNR Am J Neuroradiol1999;20:1710 –16
5. Kidd D, Thorpe JW, Thompson AJ, et al.Spinal cord MRI using multi-array coils and fast spin echo. II. Findings in multiple sclero-sis.Neurology1993;43:2632–37
6. Barkhof F.The clinico-radiological paradox in multiple sclerosis revisited.Curr Opin Neurol2002;15:239 – 45
7. Filippi M, Campi A, Colombo B, et al.A spinal cord MRI study of benign and secondary progressive multiple sclerosis. J Neurol
1996;243:502– 05
8. Nijeholt GJ, Bergers E, Kamphorst W, et al.Post-mortem high-res-olution MRI of the spinal cord in multiple sclerosis: a correlative study with conventional MRI, histopathology and clinical pheno-type.Brain2001;124:154 – 66
9. Gilmore CP, DeLuca GC, Bo¨ L, et al.Spinal cord atrophy in multiple sclerosis caused by white matter volume loss. Arch Neurol
2005;62:1859 – 62
10. Gilmore CP, Bo¨ L, Owens T, et al.Spinal cord gray matter demyeli-nation in multiple sclerosis—a novel pattern of residual plaque morphology.Brain Pathol2006;16:202– 08
11. Gilmore CP, Geurts JJ, Evangelou N, et al.Spinal cord grey matter lesions in multiple sclerosis detected by post-mortem high field MR imaging.Mult Scler2009;15:180 – 88
12. Agosta F, Absinta M, Sormani MP, et al.In vivo assessment of cervi-cal cord damage in MS patients: a longitudinal diffusion tensor MRI study.Brain2007;130:2211–19
13. Farrell JA, Smith SA, Gordon-Lipkin EM, et al.High b-value q-space diffusion-weighted MRI of the human cervical spinal cord in vivo: feasibility and application to multiple sclerosis.Magn Reson Med
2008;59:1079 – 89
14. Zackowski KM, Smith SA, Reich DS, et al.Sensorimotor dysfunc-tion in multiple sclerosis and column-specific magnetizadysfunc-tion transfer-imaging abnormalities in the spinal cord. Brain
2009;132:1200 – 09
15. Inglese M, Bester M.Diffusion imaging in multiple sclerosis: re-search and clinical implications.NMR Biomed2010;23:865–72 16. Agosta F, Benedetti B, Rocca MA, et al.Quantification of cervical
cord pathology in primary progressive MS using diffusion tensor MRI.Neurology2005;64:631–35
17. Benedetti B, Valsasina P, Judica E, et al.Grading cervical cord dam-age in neuromyelitis optica and MS by diffusion tensor MRI. Neu-rology2006;67:161– 63
18. Ciccarelli O, Wheeler-Kingshott CA, McLean MA, et al.Spinal cord spectroscopy and diffusion-based tractography to assess acute dis-ability in multiple sclerosis.Brain2007;130:2220 –31
19. Clark CA, Werring DJ, Miller DH.Diffusion imaging of the spinal cord in vivo: estimation of the principal diffusivities and applica-tion to multiple sclerosis.Magn Reson Med2000;43:133–38 20. Hesseltine SM, Law M, Babb J, et al.Diffusion tensor imaging in
multiple sclerosis: assessment of regional differences in the axial plane within normal-appearing cervical spinal cord.AJNR Am J Neuroradiol2006;27:1189 –93
21. Ohgiya Y, Oka M, Hiwatashi A, et al.Diffusion tensor MR imaging of the cervical spinal cord in patients with multiple sclerosis.Eur Ra-diol2007;17:2499 –504
22. Reich DS, Smith SA, Zackowski KM, et al.Multiparametric magnetic resonance imaging analysis of the corticospinal tract in multiple sclerosis.Neuroimage2007;38:271–79
23. Valsasina P, Rocca MA, Agosta F, et al.Mean diffusivity and frac-tional anisotropy histogram analysis of the cervical cord in MS pa-tients.Neuroimage2005;26:822–28
24. van Hecke W, Nagels G, Emonds G, et al.A diffusion tensor imaging group study of the spinal cord in multiple sclerosis patients with and without T2 spinal cord lesions. J Magn Reson Imaging
2009;30:25–34
25. Jensen JH, Helpern JA.MRI quantification of non-Gaussian water diffusion by kurtosis analysis.NMR Biomed2010;23:698 –710 26. Wu EX, Cheung MM.MR diffusion kurtosis imaging for neural
27. Falangola MF, Jensen JH, Babb JS, et al.Age-related non-Gaussian diffusion patterns in the prefrontal brain.J Magn Reson Imaging
2008;28:1345–50
28. Hui ES, Cheung MM, Qi L, et al.Towards better MR characteriza-tion of neural tissues using direccharacteriza-tional diffusion kurtosis analysis.
Neuroimage2008;42:122–34
29. Lu H, Jensen JH, Ramani A, et al.Three-dimensional characteriza-tion of non-gaussian water diffusion in humans using diffusion kurtosis imaging.NMR Biomed2006;19:236 – 47
30. Grossman EJ, Ge Y, Jensen JH, et al.Thalamus and cognitive impair-ment in mild traumatic brain injury: a diffusional kurtosis imaging study.J Neurotrauma2012;29:2318 –27
31. Raab P, Hattingen E, Franz K, et al.Cerebral gliomas: diffusional kurtosis imaging analysis of microstructural differences.Radiology
2010;254:876 – 81
32. Jensen JH, Falangola MF, Hu C, et al.Preliminary observations of increased diffusional kurtosis in human brain following recent ce-rebral infarction.NMR Biomed2011;24:452–57
33. Hori M, Fukunaga I, Masutani Y, et al.New diffusion metrics for spondylotic myelopathy at an early clinical stage. Eur Radiol
2012;22:1797– 802
34. Polman CH, Reingold SC, Edan G, et al.Diagnostic criteria for mul-tiple sclerosis: 2005 revisions to the “McDonald Criteria.”Ann Neu-rol2005;58:840 – 46
35. Reese TG, Heid O, Weisskoff RM, et al.Reduction of eddy-current-induced distortion in diffusion MRI using a twice-refocused spin echo.Magn Reson Med2003;49:177– 82
36. Jones DK, Horsfield MA, Simmons A.Optimal strategies for mea-suring diffusion in anisotropic systems by magnetic resonance im-aging.Magn Reson Med1999;42:515–25
37. Skare S, Li T, Nordell B, et al.Noise considerations in the deter-mination of diffusion tensor anisotropy.Magn Reson Imaging
2000;18:659 – 69
38. Tabesh A, Jensen JH, Ardekani BA, et al.Estimation of tensors and
tensor-derived measures in diffusional kurtosis imaging. Magn Reson Med2011;65:823–36
39. Freund P, Wheeler-Kingshott C, Jackson J, et al.Recovery after spi-nal cord relapse in multiple sclerosis is predicted by radial diffusiv-ity.Mult Scler2010;16:1193–202
40. Losseff NA, Webb SL, O’Riordan JI, et al.Spinal cord atrophy and disability in multiple sclerosis: a new reproducible and sensitive MRI method with potential to monitor disease progression.Brain
1996;119(pt 3):701– 08
41. Mikheev A, Nevsky G, Govindan S, et al.Fully automatic segmenta-tion of the brain from T1-weighted MRI using Bridge Burner algo-rithm.J Magn Reson Imaging2008;27:1235– 41
42. Rashid W, Davies GR, Chard DT, et al.Increasing cord atrophy in early relapsing-remitting multiple sclerosis: a 3 year study.J Neurol Neurosurg Psychiatr2006;77:51–55
43. DeLuca GC, Ebers GC, Esiri MM.Axonal loss in multiple sclerosis: a pathological survey of the corticospinal and sensory tracts.Brain
2004;127:1009 –18
44. Mottershead JP, Schmierer K, Clemence M, et al.High field MRI correlates of myelin content and axonal density in multiple sclerosis: a post-mortem study of the spinal cord. J Neurol
2003;250:1293–301
45. Bot JC, Blezer EL, Kamphorst W, et al.The spinal cord in multiple sclerosis: relationship of high-spatial-resolution quantitative MR imaging findings to histopathologic results. Radiology
2004;233:531– 40
46. Gilmore CP, Donaldson I, Bo¨ L, et al.Regional variations in the extent and pattern of grey matter demyelination in multiple sclerosis: a comparison between the cerebral cortex, cerebellar cor-tex, deep grey matter nuclei and the spinal cord.J Neurol Neurosurg Psychiatr2009;80:182– 87