ORIGINAL RESEARCH
ADULT BRAIN
Cerebral Damage after Carbon Monoxide Poisoning:
A Longitudinal Diffusional Kurtosis Imaging Study
Y. Zhang, T. Wang, J. Lei, S. Guo, S. Wang, Y. Gu, S. Wang, Y. Dou, and X. Zhuang
ABSTRACT
BACKGROUND AND PURPOSE:Previous DTI cross-sectional studies have showed the cerebral damage feature was different in the three clinical stages after carbon monoxide poisoning. Diffusional kurtosis imaging (DKI) is an advanced diffusion imaging model and considered to better provide microstructural contrast in comparison with DTI parameters. The primary aim of this study was to assess microstructural changes in gray and white matter with diffusional kurtosis imaging in the acute, delayed neuropsychiatric, and chronic phases after acute carbon monoxide (CO) poisoning. The secondary aim was to relate diffusional kurtosis imaging measures to neuropsychiatric outcomes of acute carbon monoxide poisoning.
MATERIALS AND METHODS:In all, 17 patients with acute carbon monoxide poisoning and 30 sex- and age-matched healthy volun-teers were enrolled in the study. Patients were scanned within 1 week, 3–8 weeks, and 6 months after acute carbon monoxide poi-soning. Diffusional kurtosis imaging metrics including mean kurtosis, mean diffusivity, fractional anisotropy, and kurtosis fractional anisotropy were measured in 11 ROIs and then further correlated with neuropsychiatric scores.
RESULTS:In WM, mean kurtosis tended to increase from the acute-to-delayed neuropsychiatric phases and then decrease in the chronic phase, while in GM mean kurtosis showed a constant decline. Contrary to mean kurtosis, mean diffusivityfirst decreased then tended to increase in WM, while in GM, from the acute to chronic phases, mean diffusivity showed a constant increase. In both WM and GM, the fractional anisotropy and kurtosis fractional anisotropy values progressively declined with time. Kurtosis fractional anisot-ropy showed the best diagnostic efficiency with an area under the curve of 0.812 (P= . 000). Along with neuropsychiatric scores, kurtosis fractional anisotropy of the centrum semiovale and Digit Span Backward were most relevant (r = 0.476,P= . 000).
CONCLUSIONS:Longitudinally, microstructural changes were inconsistent in WM and GM with time after acute carbon monoxide poi-soning. Diffusional kurtosis imaging metrics provided important complementary information to quantify the damage to cognitive impairment.
ABBREVIATIONS:CS¼centrum semiovale; DKI¼diffusional kurtosis imaging; DNS¼delayed neuropsychiatric; FA¼fractional anisotropy; GP¼globus pallidus; KFA¼kurtosis fractional anisotropy; MD¼mean diffusivity; MK¼mean kurtosis; CC¼corpus callosum
C
arbon monoxide (CO) poisoning often results in serious cer-ebral damage. On the basis of clinical behavior, surviving patients usually present with 3 clinical phases: the acute, delayed neuropsychiatric (DNS), and chronic. In the acute phase, a patient with a definite history of acute CO poisoning presents with acute and transient clinical symptoms. The DNS phaserepresents recurrent neuropsychiatric symptoms after the appa-rent resolution of acute symptoms (a lucid interval from 2 to 40 days; mean duration, 22 days). Furthermore, patients in the chronic phase present symptoms from the acute to chronic phases (even after 1 year).1
Necrosis in the globus pallidus (GP) and demyelination in the white matter have been described as the principal pathologic findings of brain damage with CO poisoning in previous reports.1,2For the past few years, diffusion-weighted imaging and Received April 25, 2019; accepted after revision July 25.
From the Department of Radiology (Y.Z., J.L., S.G., Shuaiwen Wang, Y.D., X.Z.), The First Hospital of Lan Zhou University, Intelligent Imaging Medical Engineering Research Center of Gansu Province, Accurate Image Collaborative Innovation International Science and Technology Cooperation Base of Gansu Province, Lanzhou, China; Department of Neurology (T.W., Y.G.), The First Hospital of Lan Zhou University, Lan Zhou, China; and MR Scientific Marketing (Shaoyu Wang), Siemens Healthineers, Xi’an, China.
Y. Zhang and T. Wang contributed equally to this work.
This study was supported by grants from the Research Project of Gansu Provincial Administration of Traditional Chinese Medicine (No.GZK-2018-47).
Please address correspondence to Yanli Zhang, MD, Department of Radiology, The First Hospital of Lan Zhou University, Lan Zhou, China, 730000; e-mail:
Indicates open access to non-subscribers at www.ajnr.org
Indicates article with supplemental on-line table.
diffusion tensor imaging have been popular methods of assessing the above changes. The results indicated that the apparent diffu-sion coefficient and fractional anisotropy (FA) values were highly correlated with neuropsychiatric scores.3-7
Diffusional kurtosis imaging (DKI) is a straightforward exten-sion of the DTI model and is considered to better provide micro-structural contrast in comparison with DTI parameters.8,9DKI
has been experimentally demonstrated to be suitable in both WM and gray matter.10The kurtosis reveals the degree of diffusion restriction and tissue microstructural complexity.11 Evidence from previous research supports elevated kurtosis indicating increased cellular microstructural density, such as with cytotoxic edema or the growth of tumor cells. In contrast, decreasing kurto-sis in normal aging and degenerative diseases often suggests mye-lin destruction or cell loss.12 Previous research has already depicted brain damage by DKI, but this was a cross-sectional study and observed only WM damage.13Due to the longitudinal nature of this study, we were able to observe the dynamic charac-terization of damage. In addition, this study is comprehensive because we chose both the WM and GM as the ROIs.
Among the parameters we chose, mean kurtosis (MK) was the average of the diffusion kurtosis along all diffusion direc-tions, and higher MK indicated increased microstructural com-plexity. Mean diffusivity (MD) was viewed as a measurement of isotropic diffusion in the context of free movement of water, and a lower MD value indicated cytotoxic edema, while a higher value represented angiogenic edema. FA reflected water diffu-sion anisotropy along the 3 principal directions; kurtosis frac-tional anisotropy (KFA) was mathematically analogous to FA but reflected the anisotropy of the kurtosis tensor.14Decline in FA and KFA indicated injured WM fiber integrity.
Our hypothesis was that the evolution of MD, MK, FA, and KFA in the ROIs might be dynamic in the 3 clinical periods; thus, the main purpose of this study was to determine whether DKI metrics could be sensitive enough to dynamically detect microstructural injuries of WM and GM after acute CO poison-ing and whether this was useful in evaluatpoison-ing cognitive and ex-ecutive outcomes.
MATERIALS AND METHODS
Patient EnrollmentThe Department of Neurology of the First Hospital of Lanzhou University recruited patients with CO exposure from October 2015 to September 2018. Patients were selected using the following criteria: a clear history of recent CO exposure and DNS occurrence at follow-up. The exclusion criteria were as follows: age younger than 20 years or older than 70 years and a history of brain disor-ders, including traumatic brain injury, neuropsychiatric disorder, an operation, irradiation, stroke, infection, neoplasm, and demyeli-nating disease. After initial screening, 17 patients were enrolled in this study. The Ethics Committee of The First Hospital of Lanzhou University approved the study program (LDYYLL2018-114).
Baseline scans and cognitive evaluations were performed within 7 days after acute CO poisoning; follow-up scans were per-formed within 7 days after DNS occurrence and after 6 months of acute CO poisoning.
Thirty sex- and age-matched healthy subjects were enrolled as controls. All of them had normal MR imaging findings and basic blood test results.
Cognitive Testing
Neuropsychological tests were administered by Tianhong Wang (associate chief physician in neurology) before MR imaging on the same day. The Mini-Mental State Examination was used to assess general intellectual function.15 Executive function assessments included Digit Forward Span and Digit Backward Span. To evaluate verbal fluency, we asked subjects to name as many items as possible from semantic categories (animals and vegetables). The Barthel Index was used to measure biologic and psychosocial functions.16
MR Imaging Protocols
All subjects were scanned on a 3T MR imaging system (Magneton Skyra; Siemens, Erlangen, Germany). The sequences and parameters were as follows:
T1-weighted imaging: TR = 1670 ms, TE = 11 ms, FOV = 240240 mm, 320224 matrix, and slice thickness = 2.5 mm. DWI: single-shot echo-planar sequence—TR = 4500 ms, TE = 102 ms, FOV = 240240 mm, matrix = 192192, and slice thickness = 2.5 mm. A b-value of 1000 s/mm2 was chosen.
DKI: spin-echo EPI diffusion sequence with a total of 30 dif-ferent diffusion-encoding directions. On the basis of previous studies, the b-value in WM should be higher than that in GM, where 25003000 s/mm2was found to be ideal in WM.17,18 Therefore, the b-values of 0, 1000, and 3000 s/mm2were used in this scan.
Axial images were acquired using the following parameters: TR = 6000 ms, TE = 96 ms, FOV = 240240 mm, matrix = 192 192, and section thickness = 2.5 mm.
The baseline and followed-up scans were performed by the same technician (Xin Zhuang), and the same positioning baseline and parameters. Images were corrected for motion and eddy cur-rents using the eddy-correct tool of the FMRIB Software Library (FSL; https://fsl.fmrib.ox.ac.uk/fsl/fslwiki/). DKI postprocessing was performed using the free software Diffusion Kurtosis Estimator (http://www.nitrc.org/projects/dke), which generated parametric maps including FA, MD, MK, and KFA. ROI delinea-tion and measurement were performed on the software MRIcron (https://www.nitrc.org/projects/mricron/).
MD, MK, FA, and KFA Data Analysis
As the vulnerable damage regions and important functional areas,2,19,20the GP, caudate nucleus, thalamus, centrum semi-ovale (CS), corpus callosum (CC), frontal lobe, occipital lobe, temporal lobe, and parietal lobe were chosen as our ROIs. Every ROI was represented by a sphere with a diameter of 3 mm to lessen partial volume effects, and they were manually placed on T1WI (Fig 1)13-21and transferred onto the corresponding para-metric map. After ensuring the same scan section, we applied the initially defined ROIs to the follow-up maps. Except for the CC genu, body, and splenium, other ROIs were placed bilaterally, and the mean value was extracted.
Statistical Analyses
The statistical analysis was performed using the Statistical Package for Social Sciences software package (Version 22 for Windows; IBM, Armonk, New York). The Friedman test and post hoc pair-wise comparisons were used to assess neuropsychi-atric scores and DKI parameters of the 3 clinical periods. In post hoc pair-wise comparisons,Pvalues adjusted by the Bonferroni correction (the originalPvalues multiplied by 3) were compared, with the usual nominal threshold of .05. Two independent-sam-plesttests or Mann-WhitneyUtests were used to compare the differences between patients and controls. The area under the curve of each DKI parameter in different regions was calculated by receiver operating characteristics. Spearman correlation analy-sis was used to explore the relationship between the cognitive score and the DKI-derived parameter.Pvalues<.05 were con-sidered significant for the tests.
RESULTS
[image:3.585.56.532.49.172.2]Demographic and Neuropsychiatric Data
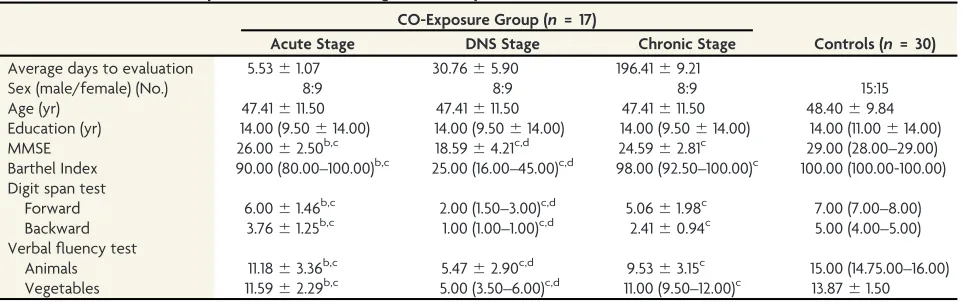
Table 1summarizes the clinical data of the 2 groups. The CO-ex-posure group had significantly lower neuropsychiatric scores than the control group (P < .05). These scores decreased from the acute-to-DNS phases and then increased at the chronic phase (P < .05).
Comparisons of DKI-Derived Parameters
The change in DKI metrics is shown in the On-line Table andFig 2. Compared with the control value, the FA and KFA values of all ROIs showed a decreasing trend in the CO-exposure group. In the CS, corpus callosum body, and corpus callosum splenium, a significant increase in MK and a decrease in MD emerged in the DNS phase. In the GP, however, the highest MK and lowest MD values appeared in the acute phase (P <.05).
Among the CO-exposure group, MK in WM showed a trend of increasing from the acute to DNS phases and then decreased at the chronic phase. Contrary to MK, MD first decreased from baseline to the DNS phase and then increased in the chronic phase.
In the GM, from the acute to chronic phase, MK progressively decreased, while MD continually increased. However, in both the WM and GM, the values of FA and KFA showed a trend toward progressive reduction with time.
Comparison of Positive Imaging Characteristics in the 3 Clinical Phases
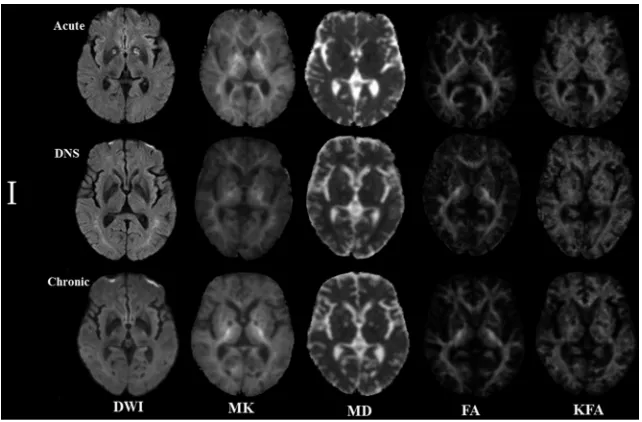
Figures 3 and 4 represent evolving lesions in the GP and CS, respectively, depicted in the 5 imaging maps in patients 1 and 2 with acute CO poisoning, arranged in the acute, DNS, and chronic phases.
FIG 1.Location of the ROIs.A, Centrum semiovale.B, Genu, body, and splenium of the corpus callosum.C, Frontal and parietal lobes.D, Globus
[image:3.585.52.533.228.379.2]pallidus, caudate nucleus, thalamus, and occipital lobe.E, Temporal lobe.
Table 1: Clinical variables of patients in different stages of CO exposurea
CO-Exposure Group (n= 17)
Controls (n= 30)
Acute Stage DNS Stage Chronic Stage
Average days to evaluation 5.5361.07 30.7665.90 196.4169.21
Sex (male/female) (No.) 8:9 8:9 8:9 15:15
Age (yr) 47.41611.50 47.41611.50 47.41611.50 48.4069.84
Education (yr) 14.00 (9.50614.00) 14.00 (9.50614.00) 14.00 (9.50614.00) 14.00 (11.00614.00)
MMSE 26.0062.50b,c 18.5964.21c,d 24.5962.81c 29.00 (28.00–29.00)
Barthel Index 90.00 (80.00–100.00)b,c 25.00 (16.00–45.00)c,d 98.00 (92.50–100.00)c 100.00 (100.00-100.00) Digit span test
Forward 6.0061.46b,c 2.00 (1.50–3.00)c,d 5.0661.98c 7.00 (7.00–8.00)
Backward 3.7661.25b,c 1.00 (1.00–1.00)c,d 2.4160.94c 5.00 (4.00–5.00)
Verbalfluency test
Animals 11.1863.36b,c 5.4762.90c,d 9.5363.15c 15.00 (14.75.00–16.00)
Vegetables 11.5962.29b,c 5.00 (3.50–6.00)c,d 11.00 (9.50–12.00)c 13.8761.50
Note:—MMSE indicates Mini-Mental State Examination.
aData are expressed as mean6SD and median (25th to 75th quartiles). bP<.05 (acute versus DNS).
In patient 1, symmetric hyperintense lesions in the GP on DWI and MK maps in the acute phase were hypointense lesions on other maps. In the DNS phase, the lesions decreased to isoin-tense lesions on DWI, while they were hypoinisoin-tense lesions on MK and hyperintense lesions on MD maps; in the chronic phase, the intensity of lesions was lower than in the DNS phase on MK
maps but higher on MD maps. In both the DNS and chronic phases, the lesions on the FA and KFA maps had lower in-tensity than those in the acute phase. Notably, in the DNS phase, new hyper-intensity lesions emerged in the WM.
In patient 2, slightly hyperintense lesions appeared in the CS in the acute phase on the DWI and MK maps but were isointense lesions on other maps. In the DNS phase, they were higher on the DWI and MK maps and were hypo-intense lesions on the MD, FA, and KFA maps. In the chronic phase, the intensity significantly decreased on the MK map but increased on the MD map, yet the lesions were still hypointense on the FA and KFA maps.
Diagnostic Performance of DKI-Derived Parameters
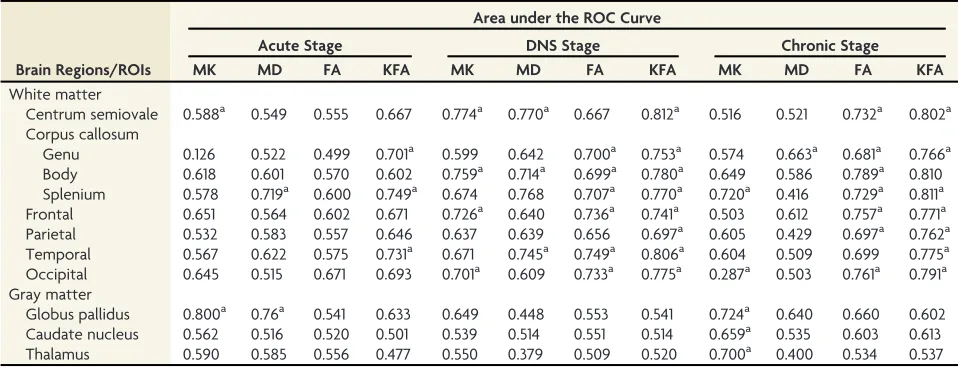
In the WM region, KFA had a higher area under the curve than the other measures, among which KFA in the CS had the best performance to differentiate patients in the DNS phase from controls with an area under the curve of 0.812 (P = . 000)(Table 2). Unlike WM, in the GM region, MK had better differentiation performance than other measures.
FIG 2.Boxplots of diffusional kurtosis imaging in ROIs in the acute phase (red bar), DNS phase (green bar), and chronic phase (blue bar)
with CO intoxication. ThehashtagindicatesP <.05 (acute versus DNS);ampersand,P<.05 (acute versus chronic); andasterisk,P < .05 (DNS versus chronic).
FIG 3. Patient 1: A 54-year-old man. The lesion evolution in the globus pallidus in the acute
(5 days), delayed neuropsychiatric (39 days), and chronic (192 days) phases.
[image:4.585.54.531.50.353.2] [image:4.585.54.375.406.617.2]KFA Value Predicted Cognitive Performance
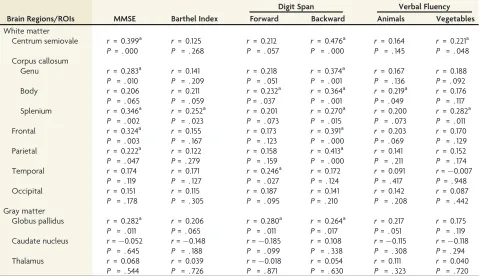
The correlations between KFA in the selected ROIs and neuro-psychiatric scores are shown inTable 3. The results show that reduction in KFA in the CS, corpus callosum genu, corpus cal-losum splenium, frontal lobe, parietal lobe, and GP was signifi-cantly associated with a decline in the Mini-Mental State Examination scores (P < .05). A decline in the Digit Span Backward score was associated with a KFA decrease in the CS, corpus callosum genu, corpus callosum body, corpus callosum splenium, frontal lobe, parietal lobe, and GP (P<.05). However, the Barthel Index, Digit Span Forward, and verbal fluency scores had a slight correlation with all regions.
DISCUSSION
Dynamic Changes in the MK and MD
Physiopathologic changes induced by hypoxic-ischemic damage with CO poisoning included mainly intracellular tortuosity and viscosity changes, which were subsequent to the breakdown of
cytoskeletal structures and swelling of the mitochondria, and aug-mented the complexity or heterogeneity of the microenviron-ment, eventually leading to an increase in MK. Meanwhile, the cytotoxic edema reduced the extracellular volume and restriction in water motion, which gave rise to a decrease in MD. Our results showed that the change in MK was always contrary to that in MD, both in WM and GM. Accompanied by cell necrosis, lique-faction, apoptosis, and atrophy, the complexity of the tissue appeared to significantly decrease and the vasogenic edema increased. The former resulted in a decrease in MK,22and the lat-ter resulted in the increase in MD.
Notably, our results show that increasing MK and decreasing MD appeared earlier in GM than in WM. This finding might be attributed to the increased vulnerability to hypoxia of GM because neurons in GM have high blood demand. In addition, it also indicates that obvious damage in WM occurred in the DNS phase. As we observed, all patients had typical bilateral hyperin-tensity of WM on DWI in the DNS phase, while in the acute phase, only 5 patients had multiple focal lesions in the WM. These find-ings were consistent with previous research showing that hyperintense areas in WM on T2-weighted imaging were more widespread after the appearance of the DNS phase than before it.23,24
[image:5.585.55.377.274.472.2]In a previous report, the kurtosis values in the WM region were lower in patients than in controls.13 However, our results showed that MK was higher in the acute and DNS stages in the CO-exposure group than in the control group; this finding indicates the increased microstruc-tural complexity in the early stages of poisoning. In fact, an increase of MK also occurred in acute stroke research. Jensen et al25 found
Table 2: Diagnostic performance of DKI parameters in differentiating patients with CO exposure from controls
Brain Regions/ROIs
Area under the ROC Curve
Acute Stage DNS Stage Chronic Stage
MK MD FA KFA MK MD FA KFA MK MD FA KFA
White matter
Centrum semiovale 0.588a 0.549 0.555 0.667 0.774a 0.770a 0.667 0.812a 0.516 0.521 0.732a 0.802a Corpus callosum
Genu 0.126 0.522 0.499 0.701a 0.599 0.642 0.700a 0.753a 0.574 0.663a 0.681a 0.766a Body 0.618 0.601 0.570 0.602 0.759a 0.714a 0.699a 0.780a 0.649 0.586 0.789a 0.810 Splenium 0.578 0.719a 0.600 0.749a 0.674 0.768 0.707a 0.770a 0.720a 0.416 0.729a 0.811a Frontal 0.651 0.564 0.602 0.671 0.726a 0.640 0.736a 0.741a 0.503 0.612 0.757a 0.771a Parietal 0.532 0.583 0.557 0.646 0.637 0.639 0.656 0.697a 0.605 0.429 0.697a 0.762a Temporal 0.567 0.622 0.575 0.731a 0.671 0.745a 0.749a 0.806a 0.604 0.509 0.699 0.775a Occipital 0.645 0.515 0.671 0.693 0.701a 0.609 0.733a 0.775a 0.287a 0.503 0.761a 0.791a Gray matter
Globus pallidus 0.800a 0.76a 0.541 0.633 0.649 0.448 0.553 0.541 0.724a 0.640 0.660 0.602 Caudate nucleus 0.562 0.516 0.520 0.501 0.539 0.514 0.551 0.514 0.659a 0.535 0.603 0.613
Thalamus 0.590 0.585 0.556 0.477 0.550 0.379 0.509 0.520 0.700a 0.400 0.534 0.537
Note:—ROC indicates receiver operating characteristic. a<.05 indicates significance.
FIG 4.Patient 2: A 42-year-old woman. The lesion evolution in the centrum semiovale in the
[image:5.585.53.532.527.711.2]substantially increased diffusional kurtosis within the cerebral ischemic lesions of 3 subjects with stroke 13-26 hours following the onset of symptoms by application of the DKI MR imaging method. In CO poisoning, these similar results might be explained by secondary ischemic injury caused by hypoxia in the early stage.
By comparing the diagnostic efficiency, we found that MK had a higher sensitivity than MD for monitoring GM damage. This was consistent with previous findings with regard to stroke, Alzheimer disease, Parkinson disease, and neoplastic lesions.26-31Compared with other deep GM structures such as the caudate nucleus and thalamus, the GP showed the greatest sensitivity, therefore revealing selective damage to the GP.
Progressive Decrease in FA and KFA
Our results show that FA and KFA of WM progressively decreased with time, which was a finding reported in a previous study: Lo et al6reported that a significantly lower mean FA value was found in patients in the DNS phase compared with the con-trol group both before and 3 months after hyperbaric oxygen therapy. Chang et al32reported on 17 patients with CO poisoning who underwent DTI assessment 4–6 months after hyperbaric ox-ygen therapy, and they found that the extensive WM areas with FA decreased. The breakdown of myelin and nerve fiber rarefac-tion may be an important component of the pathologic process.14 In addition, we found that the decreases in FA and KFA were more obvious in the DNS and chronic phases than in the acute phase. The underlying mechanisms might be related to neuronal injury that was originally caused by global brain anoxia or
ischemia in the acute phase and then resulted in secondary Wallerian degeneration of WM.33
In terms of diagnostic efficiency, KFA showed a better effi-ciency than FA in detecting WM damage. Indeed, previous reports have demonstrated that KFA supplements the contrast in other diffusion MR imaging metrics, particularly FA, which van-ishes in near-orthogonal fiber arrangements such as in the supe-rior corona radiata and centrum semiovale, whereas KFA does not.13,34
KFA Value Predicted Clinical Performance
Cognitive and executive capacity dysfunction was the common clinical issue for survivors of CO poisoning. Recently, a study based on a total of 9041 adults showed that the dementia inci-dence was 1.6-fold higher in the CO-exposed cohort than in the nonexposed cohort.35 Neuropsychiatric deficits related to CO poisoning were also found in our patients. In our study, the posi-tive correlation between the neuropsychiatric score and KFA in multiple WM regions supported the hypothesis that WM micro-structural changes may contribute to the decline in cognitive and executive functions. In fact, there were 5 patients in our study who still had poor neuropsychiatric performance regarding incapacity of life, disturbance of intelligence, or hemiplegic paral-ysis at the chronic stage and had much lower KFA values (0.1020.303) in the CS than others.
[image:6.585.54.535.58.334.2]Relative to other scores, Digit Span Backward was found to have better correlation with most regions in WM, such as the CS, corpus callosum genu, corpus callosum body, frontal lobe, and parietal lobe. This finding might be because the performance on Digit Span Backward is thought to reflect higher-order executive
Table 3: Correlation study between KFA and cognitive tests in patients with CO intoxication
Brain Regions/ROIs MMSE Barthel Index
Digit Span Verbal Fluency
Forward Backward Animals Vegetables
White matter
Centrum semiovale r = 0.399a r = 0.125 r = 0.212 r = 0.476a r= 0.164 r = 0.221a
P = . 000 P = . 268 P = . 057 P = . 000 P = . 145 P = . 048
Corpus callosum
Genu r = 0.283a r = 0.141 r = 0.218 r = 0.374a r= 0.167 r = 0.188
P = . 010 P = . 209 P = . 051 P = . 001 P = . 136 P= . 092
Body r = 0.206 r = 0.211 r = 0.232a r = 0.364a r= 0.219a r = 0.176
P = . 065 P = . 059 P= . 037 P = . 001 P= . 049 P = . 117
Splenium r = 0.346a r = 0.252a r = 0.201 r = 0.270a r= 0.200 r = 0.282a
P = . 002 P = . 023 P = . 073 P = . 015 P = . 073 P = . 011
Frontal r = 0.324a r = 0.155 r = 0.173 r = 0.391a r= 0.203 r = 0.170
P = . 003 P = . 167 P = . 123 P = . 000 P= . 069 P = . 129
Parietal r = 0.222a r = 0.122 r = 0.158 r = 0.413a r= 0.141 r = 0.152
P = . 047 P= . 279 P = . 159 P = . 000 P = . 211 P = . 174
Temporal r = 0.174 r = 0.171 r = 0.246a r = 0.172 r= 0.091 r=0.007
P = . 119 P = . 127 P = . 027 P = . 124 P= . 417 P = . 948
Occipital r = 0.151 r = 0.115 r = 0.187 r = 0.141 r= 0.142 r = 0.087
P = . 178 P = . 305 P = . 095 P= . 210 P = . 208 P = . 442
Gray matter
Globus pallidus r = 0.282a r = 0.206 r = 0.280a r = 0.264a r= 0.217 r = 0.175
P = . 011 P= . 065 P = . 011 P= . 017 P= . 051 P = . 119
Caudate nucleus r=0.052 r=0.148 r=0.185 r = 0.108 r=0.115 r=0.118
P = . 645 P = . 188 P = . 099 P = . 338 P = . 308 P= . 294
Thalamus r = 0.068 r = 0.039 r=0.018 r = 0.054 r= 0.111 r = 0.040
P = . 544 P = . 726 P = . 871 P = . 630 P = . 323 P = . 720
Note:—MMSE indicates Mini-Mental State Examination. aSignificant indicated by<.05.
abilities.36Anatomically, the CS is adjacent to the CC, which con-sists of large projection fibers such as the corticospinal, cortico-bulbar, and corticopontine tracts. These large projection fibers widely connect the cerebral cortex of the frontal lobe and parietal lobe regions, mediating mainly executive functions.37
In addition, due to the GP being related to the extrapyramidal tract, damage usually caused abnormalities in motor function, eventually leading to a decrease in executive capacity.38In our study, 6 patients emerged with Parkinson's symptoms which all occurred in the DNS stage.
Last, with respect to the correlation among levels of CO expo-sure, neuropsychiatric scores, and DKI metrics, previous studies have shown that there is no definite relationship among carboxy-hemoglobin levels, the severity of MR imaging findings, and the length of exposure time.39
Limitations
First, DKI metrics were measured on the basis of ROIs manually placed in various regions, which might yield imperfect reference values and were thus biased. Second, only limited neuropsycho-logical tests were performed, possibly underestimating the cogni-tive sequelae.
CONCLUSIONS
We confirmed our initial hypothesis that the evolution of brain damage with CO intoxication was dynamic across time. WM and GM responses to CO exposure might not be identical. KFA could be a surrogate biomarker for tissue damage and reflected the per-formance of cognitive and executive functions correlated with prognosis.
REFERENCES
1. Beppu T.The role of MR imaging in assessment of brain damage
from carbon monoxide poisoning: a review of the literature.AJNR
Am J Neuroradiol2014;35:625–31CrossRef Medline
2. Jeon SB, Sohn CH, Seo DW, et al.Acute brain lesions on magnetic resonance imaging and delayed neurological sequelae in carbon
monoxide poisoning. JAMA Neurol 2018;75:436–43 CrossRef
Medline
3. Chen NC, Huang CW, Lui CC, et al.Diffusion-weighted imaging improves prediction in cognitive outcome and clinical phases in
patients with carbon monoxide intoxication. Neuroradiology
2013;55:107–15CrossRef Medline
4. Fujiwara S, Beppu T, Nishimoto H, et al.Detecting damaged regions of cerebral white matter in the subacute phase after carbon mon-oxide poisoning using voxel-based analysis with diffusion tensor
imaging.Neuroradiology2012;54:681–89CrossRef Medline
5. Lin WC, Lu CH, Lee YC, et al.White matter damage in carbon monoxide intoxication assessed in vivo using diffusion tensor MR
imaging.AJNR Am J Neuroradiol2009;30:1248–55CrossRef Medline
6. Lo CP, Chen SY, Chou MC, et al.Diffusion-tensor MR imaging for evaluation of the efficacy of hyperbaric oxygen therapy in patients with delayed neuropsychiatric syndrome caused by carbon
monox-ide inhalation.Eur J Neurol2007;14:777–82CrossRef Medline
7. Terajima K, Igarashi H, Hirose M, et al. Serial assessments of delayed encephalopathy after carbon monoxide poisoning using magnetic resonance spectroscopy and diffusion tensor imaging on
3.0T system.Eur Neurol2008;59:55–61CrossRef Medline
8. Lu H, Jensen JH, Ramania, et al.Three-dimensional characteriza-tion of non-Gaussian water diffusion in humans using diffusion
kurtosis imaging.NMR Biomed2006;19:236–47CrossRef Medline
9. Jensen JH, Helpern JA.MRI quantification of non-Gaussian water
diffusion by of non-Gaussian water diffusion by analysis.NMR
Biomed2010;23:698–10CrossRef Medline
10. Assaf Y, Cohen Y.Non-mono-exponential attenuation of water
and N-acetyl aspartate signals due to diffusion in brain tissue.J
Magn Reson1998;131:69–85CrossRef Medline
11. Lazar M, Jensen JH, Xuan L, et al.Estimation of the orientation
dis-tribution function from diffusional kurtosis imaging.Magn Reson
Med2008;60:774–81CrossRef Medline
12. Marrale M, Collura G, Brai M, et al.Physics-techniques and review of neuroradiological applications of diffusion kurtosis imaging
(DKI).Clin Neuroradiol2016;26:391–03CrossRef Medline
13. Lee JJ, Chang WN, Hsu JL, et al.Diffusion kurtosis imaging as a neuroimaging biomarker in patients with carbon monoxide
intox-ication.Neurotoxicology2018;68:38–46CrossRef Medline
14. Hansen B, Jespersen SN.Kurtosis fractional anisotropy: its contrast
and estimation by proxy.Sci Rep2016;6:23999CrossRef Medline
15. Folstein MF, Folstein SE, McHugh PR.Mini-mental state: a practical method for grading the cognitive state of patients for the clinician. J Psychiatr Res1975;12:189–98CrossRef Medline
16. Sidney K, Amasa BF, Roland WM, et al.Studies of illness in the aged. The index of ADL: a standardized measure of biological and
psychosocial function.JAMA1963;185:914–19CrossRef Medline
17. Chuhutin A, Hansen B, Jespersen SN.Precision and accuracy of dif-fusion kurtosis estimation and the influence of b-value selection. NMR Biomed2017;30CrossRef Medline
18. Hansen B, Jespersen SN. Recent developments in fast kurtosis
imaging.Front Phys2017;5:1–15CrossRef
19. Barha CK, Nagamatsu LS, Liu-Ambrose T.Basics of neuroanatomy
and neurophysiology.Handb Clin Neurol2016;138:53–68CrossRef
Medline
20. Schmahmann JD, Smith EE, Eichler FS, et al.Cerebral white matter: neuroanatomy- clinical neurology-and neurobehavioral correlates. Ann N Y Acad Sci2008;1142:266–09CrossRef Medline
21. Kanda T, Ishii K, Kawaguchi H, et al.High signal intensity in the dentate nucleus and globus pallidus on unenhanced T1-weighted MR images: relationship with increasing cumulative dose ofa
gadolinium-based contrast material. Radiology 2014;270:834–41
CrossRef Medline
22. Coutu JP, Chen JJ, Rosas HD, et al.Non-Gaussian water diffusion
in aging white matter.Neurobiol Aging2014;35:1412–21CrossRef
Medline
23. Inagaki T, Ishino H, Seno H, et al.A long-term follow-up study of serial magnetic resonance images in patients with delayed
ence-phalopathy after acute carbon monoxide poisoning.Psychiatry Clin
Neurosci1997;51:421–23CrossRef Medline
24. Vila JF, Meli FJ, Serqueira OE, et al.Diffusion tensor magnetic reso-nance imaging: a promising technique to characterize and track delayed encephalopathy after acute carbon monoxide poisoning. Undersea Hyperb Med2005;32:151–56Medline
25. Jensen JH, Falangola MF, Hu C, et al.Preliminary observations of increased diffusional kurtosis in human brain following recent
cer-ebral infarction.NMR Biomed2011;24:452–57CrossRef Medline
26. Hui ES, Fieremans E, Jensen JH, et al.Stroke assessment with
diffu-sional kurtosis imaging.Stroke2012;43:2968–73CrossRef Medline
27. Falangola MF, Jensen JH, Tabesha, et al.Non-Gaussian diffusion MRI assessment of brain microstructure in mild cognitive
impair-ment and Alzheimer’s disease.Magn Reson Imaging2013;31:840–46
CrossRef Medline
28. Kamagata K, Tomiyama H, Motoi Y, et al. Diffusional kurtosis imaging of cingulate fibers in Parkinson disease: comparison with
conventional diffusion tensor imaging. Magn Reson Imaging
29. Wang JJ, Lin WY, Lu CS, et al.Parkinson disease: diagnostic utility
of diffusion kurtosis imaging.Radiology2011;261:210–17CrossRef
Medline
30. Van Cauter S, Veraart J, Sijbers J, et al.Gliomas: diffusion kurtosis
MR imaging in grading. Radiology 2012;263:492–01 CrossRef
Medline
31. Cheung JS, Wang E, Lo EH, et al.Stratification of heterogeneous diffusion MRI ischemic lesion with kurtosis imaging: evaluation of mean diffusion and kurtosis MRI mismatch in an animal model of
transient focal ischemia.Stroke2012;43:2252–54CrossRef Medline
32. Chang CC, Lee YC, Chang WN, et al.Damage of white matter tract correlated with neuropsychological deficits in carbon monoxide
intoxication after hyperbaric oxygen.J Neurotrauma2009;26:1263–
70CrossRef Medline
33. Bartzokis G. Age-related myelin break down: a developmental
model of cognitive decline and Alzheimer’s disease. Neurobiol
Aging2004;25:5–18CrossRef Medline
34. Pantoni L, Garcia JH, Gutierrez JA.Cerebral white matter is highly
vulnerable to ischemia.Stroke1996;27:1641–46Medline
35. Lai CY, Huang YW, Tseng CH, et al.Patients with carbon monox-ide poisoning and subsequent dementia: a population-based
cohort study.Medicine (Baltimore)2016;95:e2418.CrossRef Medline
36. O’Donnell JP, MacGregor LA, Dabrowski JJ, et al.Construct validity of neuropsychological tests of conceptual and attentional abilities.
JClin Psychol1994;50:596–600CrossRef Medline
37. Baddeley A, Della Sala S.Working memory and executive control. Philos Trans R Soc Lond B Biol Sci 1996;351:1397–03 CrossRef Medline
38. Saga Y, Hoshi E, Tremblay L.Roles of multiple globus pallidus ter-ritories of monkey and humans in motivation, cognition and action: an anatomical, physiological and pathophysiological
review.Front Neuroanat2017;10;11CrossRef
39. Kim DM, Lee IH, Park JY, et al.Acute carbon monoxide poisoning:
MR imaging findings with clinical correlation. Diagn Interv
Imaging2017;98:299–06CrossRef Medline