ORIGINAL RESEARCH
PEDIATRICS
Diffusion Tensor Imaging of the Normal Cervical and Thoracic
Pediatric Spinal Cord
XS. Saksena,XD.M. Middleton,XL. Krisa,XP. Shah,XS.H. Faro,XR. Sinko,XJ. Gaughan,X J. Finsterbusch,XM.J. Mulcahey, and X F.B. Mohamed
ABSTRACT
BACKGROUND AND PURPOSE: DTI data of the normal healthy spinal cord in children are limited compared with adults and are typically focused on the cervical spinal cord. The purpose of this study was the following: to investigate the feasibility of obtaining repeatable DTI parameters along the entire cervical and thoracic spinal cord as a function of age in typically developing pediatric subjects; to analyze the DTI parameters among different transverse levels of the cervical and thoracic spinal cord; and to examine the sex differences in DTI parameters along the cervical and thoracic spinal cord.
MATERIALS AND METHODS: Twenty-two subjects underwent 2 identical scans by using a 3T MR imaging scanner. Axial diffusion tensor images were acquired by using 2 overlapping slabs to cover the cervical and thoracic spinal cord. After postprocessing, DTI parameters were calculated by using ROIs drawn on the whole cord along the entire spinal cord for both scans.
RESULTS:An increase in fractional anisotropy and a decrease in mean diffusivity, axial diffusivity, and radial diffusivity were observed with age along the entire spinal cord. Significantly lower fractional anisotropy and higher mean diffusivity values were observed in the lower cervical cord compared with the upper cervical cord. Axial diffusivity values in the cervical cord were higher compared with the thoracic cord. No statistically significant sex differences were observed for all DTI parameters. There was a moderate-to-strong repeatability for all DTI parameters.
CONCLUSIONS: This study provides an initial understanding of DTI values of the spinal cord relevant to age and sex and shows that obtaining repeatable DTI values of the entire cord in children is feasible.
ABBREVIATIONS:AD⫽axial diffusivity; FA⫽fractional anisotropy; MD⫽mean diffusivity; RD⫽radial diffusivity; SC⫽spinal cord
D
TI is a valuable technique that measures the diffusivity of water molecules in tissues and provides in vivo information about tissue integrity and structure that is not apparent with con-ventional MR imaging. The commonly used DTI measures are fractional anisotropy (FA), which describes the degree of direc-tional dependence; mean diffusivity (MD), which expresses the magnitude of the diffusion; axial diffusivity (AD), whichrepre-sents water diffusivity parallel to the axonal fibers; and radial dif-fusivity (RD), which represents water difdif-fusivity perpendicular to the axonal fibers.1DTI studies have investigated the cervical spinal cord (SC) in healthy adult subjects and have shown that DTI parameters are sensitive to age-related microstructural changes.2,3In contrast to the studies in adults, 1 study has evalu-ated the age-dependent evolution of FA and ADC values of the pediatric cervical SC.4There are no studies, to date to our knowl-edge, describing the age-related changes in the DTI parameters along the entire cervical and thoracic SC in pediatric subjects.
The usefulness of DTI has been shown for examining the cer-vical SC in pediatric subjects.5-7However, a comprehensive study examining the diffusion characteristics and repeatability of DTI along the cervical and thoracic SC in pediatric subjects has not been reported. On the basis of the promising outcomes of previ-ous pediatric studies and owing to the growing practice of obtain-ing DTI in clinical patients,7,8it is essential to establish normative pediatric DTI values along the cervical and thoracic SC to aid in the clinical interpretation of the injured SC.
The purpose of this study was 3-fold: to investigate the feasi-Received February 11, 2016; accepted after revision May 23.
From the Departments of Radiology (S.S., F.B.M.) and Occupational Therapy (L.K., R.S., M.J.M.), Thomas Jefferson University, Philadelphia, Pennsylvania; Department of Radiology (D.M.M., P.S., S.H.F.), Temple University, Philadelphia, Pennsylvania; Biostatistics Consulting Center (J.G.), Temple University School of Medicine, Phila-delphia, Pennsylvania; and Department of Systems Neuroscience (J.F.), University Medical Center Hamburg-Eppendorf, Hamburg, Germany.
This work was supported by National Institute of Neurological Disorders of the National Institutes of Health under award No. R01NS079635 (F.B. Mohamed and M.J. Mulcahey, Principal Investigator).
Please address correspondence to Feroze B. Mohamed, PhD, Department of Radi-ology, Thomas Jefferson University, 909 Walnut St, Philadelphia, PA 19107; e-mail: [email protected]
Indicates open access to non-subscribers at www.ajnr.org
bility of obtaining repeatable DTI parameters along the entire cervical and thoracic SC as a function of age in typically develop-ing pediatric subjects by usdevelop-ing an inner FOV DTI sequence; to analyze the DTI parameters among different levels of the cervical and thoracic SC; and to examine the sex differences in the DTI parameters along the cervical and thoracic SC.
MATERIALS AND METHODS
Study Design
This initial study was part of a larger research effort to develop and validate DTI as a method for assessing the SC in children, similar to others that are working to validate DTI of the brain. The vali-dation requires examining a population of subjects that have core variables such as age, sex, race, ethnicity, handedness, and educa-tion levels for any normative data base.9Twenty-two typically developing subjects (mean age, 11.44⫾ 3.07 years) were re-cruited. There were 8 males (mean age, 10.51⫾3.31 years) and 14 females (mean age, 11.97⫾2.92 years). These subjects were re-cruited mostly through our colleagues or family members. A few typically developing children were recruited as siblings of some of our spinal cord injury population. Thirteen subjects were ex-cluded during the recruitment for the following reasons: Three declined, 7 had scheduling conflicts, and 3 had metal piercings or permanent retainers. Subjects were included in the study if they had no evidence of spinal cord injury or pathology, as assessed by performing a neurologic screen (a questionnaire about their med-ical history associated with neurologic injuries and a brief assess-ment of motor and sensory function and reflexes). Subjects were excluded from the study if they were unable to tolerate MR imag-ing without sedation or had infantile, juvenile, or adolescent id-iopathic scoliosis or any abnormality of the nervous and/or mus-culoskeletal system. No subjects with orthodontic hardware were included in this study. Written informed assent (child) and con-sent (parent) were obtained under the protocol approved by the Temple University institutional review board.
MR Imaging Protocol
The scans were performed by using a 3T Verio MR imaging scanner (Siemens, Erlangen, Germany) with a 4-channel neck matrix and an 8-channel spine matrix coil. The protocol con-sisted of an initial gradient-echo T2WI scout sagittal scan of the cervical and thoracic SC. The sagittal images were used to prescribe axial sections of the cervical and thoracic SC. Next, axial gradient-echo T2WI; a sagittal T2WI 3D SPACE sequence (sampling perfection with application-optimized contrasts by using different flip angle evolution; Siemens, Erlangen, Ger-many); sagittal TSE T1WI; sagittal TSE T2WI; and axial DTI scans were obtained.
DTI was performed by using an inner FOV sequence. The inner FOV sequence was based on a single-shot echo-planar im-aging sequence for DWI with 2D-selective radiofrequency excita-tions, which improve the SNR and reduce geometric distortions in SC imaging, described in detail elsewhere.5,10Manual shim volume adjustments were also performed before data acquisition to restrict the adjustment volume to the anatomy of interest as much as possible.
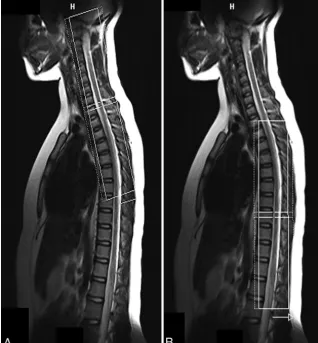
Diffusion tensor images were acquired axially by using 2
over-lapping slabs, in the same anatomic location prescribed for the T2 gradient-echo images, to cover the cervical (C1-upper thoracic region) and thoracic (upper thoracic-L1) SC (Fig 1). The imaging parameters for each slab of DTI acquisition included the follow-ing: FOV⫽164 mm, phase FOV⫽28.4% (47 mm), 3 averages of 20 diffusion directions, 6 B0 acquisitions,b⫽800 s/mm2, voxel size⫽0.8⫻0.8⫻6 mm3, axial sections⫽40, TR⫽7900 ms, TE⫽110 ms, acquisition time⫽8:49 minutes. To test the repeat-ability of DTI, we imaged all subjects twice by using the same protocol within 2 hours following the initial scan. Anesthesia was not administered. Cardiac and respiratory gating was not used, to keep scan times as short as possible.
Image Preprocessing and Analysis
Initially, a central mask was applied to the raw DTI to eliminate the anatomy outside the SC. A mean B0 image was calculated, generated from the coregistration of all 6 B0 acquisitions. The diffusion-weighted images were corrected for motion by using a rigid-body-correction algorithm.11After motion correction, ten-sor estimation was done on a voxel-by-voxel basis from the axial DTI. All processing was performed by using in-house software developed in Matlab (MathWorks, Natick, Massachusetts). For robust diffusion tensor estimation, a nonlinear fitting algorithm implemented in RESTORE technique was used.12
Each ROI was manually drawn on the whole cord on gray-scale FA maps at every axial section, on the basis of the method-ology from the previous article,5along the cervical and thoracic SC for both scans. For drawing the ROI, sections corresponding to the anatomic regions with accurate vertebral levels were defined for the cervical and thoracic SC by a board-certified pediatric neuroradiologist. The placement of ROIs was performed by a neuroscientist (S.S.) and confirmed by a neuroradiologist (S.H.F). There was a consistent sparing of the outer margin of the cervical and thoracic SC of approximately 1-voxel width to min-imize volume averaging with the CSF.
Statistical Analysis
Means with SD were calculated for DTI parameters according to age groups, cord levels, and sex. The coefficient of variation was calculated as an additional measure of variability. Because the DTI parameters failed the Shapiro-Wilk test for normality, the data were transformed into “normalized ranks” to allow parametric testing.14The ANOVA for repeated measures and linear regres-sion was used to compare scans, cord levels, and age. APvalue of .05 was used throughout to determine statistical significance. Test-retest repeatability was calculated by using the intraclass cor-relation coefficient according to the method of Shrout and Fleiss.15All statistical analyses were performed with SAS, Version 9.4 (SAS Institute, Cary, North Carolina).
RESULTS
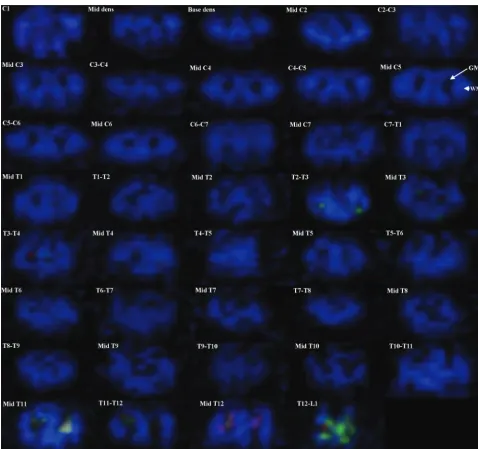
All 22 subjects tolerated 2 repeat imaging sessions. Each session was 40 – 45 minutes in duration with a 2-hour delay between ses-sions. Imaging with the inner FOV sequence with 2D-selective radiofrequency excitations resulted in DTI with high spatial resolution. Better distinction between WM and GM structures was observed throughout the cord; however, in general, the GM-WM differentiation was better in the cervical and upper tho-racic cord (Fig 2). InFig 2, the green anisotropy in the fourth row might represent some spurious voxels; and in the eighth row, the
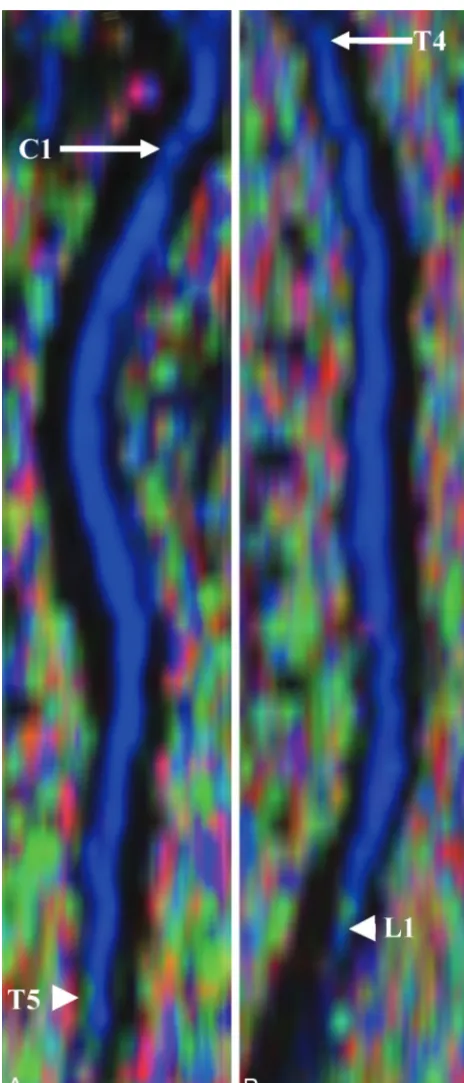
conus is present in the imaging volume and the artifacts seen are largely due to partial volume averaging and complex CSF flow.Figure 3shows the sagittal re-construction of FA color maps of 2 over-lapping slabs of the same subject inFig 2.
Figure 3Ashows the cervical and upper thoracic region (C1 to T5), andFig 3B
shows the upper thoracic through the conus region (T4 to L1).
DTI Parameters along the Cervical and Thoracic SC According to Age
Table 1summarizes the DTI values for 2 age groups. FA values were low in sub-jects 6 –11 years of age, while they were high in subjects 12–16 years of age along the cervical and thoracic SC. MD, AD, and RD values followed an opposite trend and were high in subjects 6 –11 years of age and low in subjects 12–16 years of age. The increase in FA values from age groups 6 –11 years to 12–16 years was statistically significant (P⫽.0193).
As shown inTable 1, MD decreased significantly from age groups 6 –11 years to 12–16 years (P⬍.0001). There was a significant decrease in AD from age groups 6 –11 years to 12–16 years (P⬍
.0001). Similarly, RD decreased signifi-cantly from age groups 6 –11 years to 12–16 years (P⬍.0001) (Table 1).
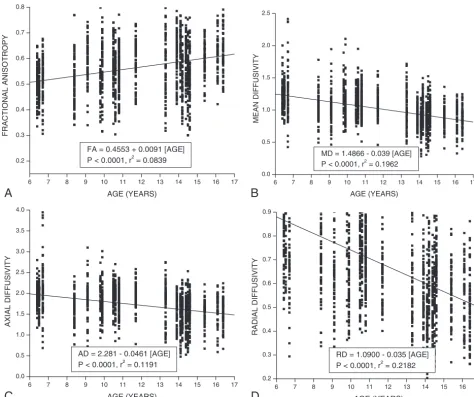
A simple linear regression analysis was used to measure the effect of age on DTI parameters. As seen fromFig 4, an increase in FA was ob-served; however, MD, AD, and RD showed a decrease along the cervical and thoracic SC with age.
DTI Parameters According to Cord Levels
Table 2shows that FA values in the upper cervical cord and mid-dle cervical cord were significantly higher compared with the lower cervical cord (P⬍.0001). No statistically significant differ-ence in FA values was observed in the upper cervical cord com-pared with the middle cervical cord (P⫽.3732). In the upper thoracic cord, FA values were significantly lower compared with the middle thoracic cord (P⬍.0001), while they were signifi-cantly higher compared with the lower thoracic cord (P⬍.0001). FA values in the middle thoracic cord were significantly higher compared with the lower thoracic cord (P⬍.0001) (Table 2).
A significant decrease in MD values was observed in the upper cervical cord and middle cervical cord compared with the lower cervical cord (P⬍.0001,P⫽.0265). No statistically significant difference in MD values was observed in the upper cervical cord compared with the middle cervical cord (P⫽.1357). In the mid-dle thoracic cord, a significant increase in MD values was ob-served compared with the upper thoracic cord and lower thoracic cord (P⬍.0001). No statistically significant difference was
ob-FIG 1.Localization image from which the axial cervical (A) and thoracic (B) SC sections are pre-scribed. The inner solid white rectangular line represents the inner FOV, which was oversampled
[image:3.594.55.374.49.392.2]served in the upper thoracic cord compared with lower thoracic cord (P⫽.2665) (Table 2).
AD values in the upper cervical cord were significantly higher compared with the upper thoracic cord (P⬍.0001) and lower thoracic cord (P⬍.0001). No significant difference was observed in the upper cervical cord compared with middle thoracic cord (P⫽.1485). In the middle cervical cord, AD values were signifi-cantly higher compared with the upper thoracic cord (P⬍.0001), middle thoracic cord (P⫽.0033), and lower thoracic cord (P⬍
.0001). AD values in the lower cervical cord were significantly higher compared with the upper thoracic cord (P⬍.0001), mid-dle thoracic cord (P⫽.0158), and lower thoracic cord (P⬍.0001) (Table 2).
RD values in the upper cervical cord were not statistically sig-nificant compared with the upper thoracic cord (P⫽.2707),
mid-dle thoracic cord (P ⫽.1044), and lower thoracic cord (P ⫽
.9320). Significant differences in RD values were observed in the middle cervical cord compared with the upper thoracic cord (P⫽
.0198) and middle thoracic cord (P⫽.0048). No statistically sig-nificant difference was observed in the middle cervical cord com-pared with lower thoracic cord (P⫽.1774). A significant increase in RD values was observed in the lower cervical cord compared with the upper (P⬍.0001), middle (P⬍.0001), and lower tho-racic cord (P⬍.0001) (Table 2).
Coefficient of Variation
The coefficient of variation represents the SD as a percentage of the mean and is an additional indication of the variability of the DTI measurements. The coefficient of variation showed that the variability of the DTI parameters was very good for both age
FIG 2. Axial FA color maps of each intervertebral disc level and within the mid-vertebral body level along the entire cervical and thoracic SC in a typically developing subject (C1 to T12–L1 level). An example of GM at the mid-C5 level is shown with anarrow, and WM, with an
[image:4.594.54.533.44.493.2]groups and similar to other reports of DTI measurement variabil-ity.16Overall, FA showed the least variability (6 –11 years, 16.66%; 12–16 years, 17.24%).
DTI Parameters and Sex
DTI parameters did not show any statistically significant differ-ence between males (FA: 0.56⫾ 0.09; MD: 1.07⫾ 0.29; AD:
1.80⫾0.43; RD: 0.71⫾0.25) and females (FA: 0.56⫾0.10; MD: 1.01⫾0.25; AD: 1.71⫾0.39; RD: 0.66⫾0.22) along the cervical and thoracic SC.
[image:5.594.53.285.44.585.2]Test-Retest Repeatability
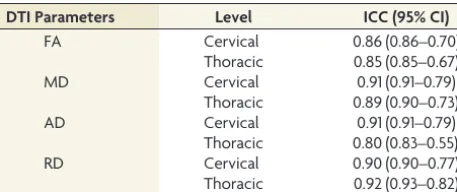
Table 3shows the intraclass correlation coefficient and 95% CIs for test-retest repeatability of DTI values for the cervical and tho-racic SC. There was a moderate-to-strong repeatability for DTI values for the cervical and thoracic SC (Table 3).
DISCUSSION
In this study, the entire SC of 22 typically developing children was successfully scanned to obtain DTI parameters (FA, MD, AD, and RD) that revealed location and age- and sex-related trends and moderate-to-strong repeatability. To the best of our knowledge, this study is the first to examine developmental and sex differ-ences in DTI parameters of the entire pediatric SC. One previous study did examine FA and ADC changes in the pediatric cervical spine,4with findings similar to those in our study.
The results of this study showed that with increasing age, FA increased along the cervical and thoracic SC. Studies in the brain have reported age-related changes in the DTI parameters to de-scribe the normal developmental characteristics from infancy to adulthood.17In addition, it is proposed that changes in DTI pa-rameters in the brain as a function of age may result from decreas-ing water content, myelination of fiber tracts, and the thickendecreas-ing diameter of fiber tracts.18The SC is an extension of the brain, transmitting messages from the brain to the periphery and vice versa; and similar physiologic processes may occur in the SC. It has been reported that myelination in the SC starts during the second half of fetal life, peaks during the first year postnatally, and continues until 20 years of age.19In our study, an increase in FA with age in the SC was observed, similar to the FA findings in the brain, which suggests the ongoing process of myelination.
In our study, MD, AD, and RD decreased with age along the cervical and thoracic SC. MD is the average of all 3 eigenvalues and represents a variety of physiologic processes that include con-tinuing myelination, increased organization, and compactness of the axonal bundles. It has been demonstrated that there is a strong correlation between AD/RD and histology in animal studies.20 AD in the WM tracts correlates well with the integrity of axons in these tracts, while RD in the WM tracts correlates with the amount of myelin.20Decreased AD with age may result from in-creased axonal density or axonal caliber, leading to an addition of diffusion barriers parallel to the axon due to reduced interaxonal space. Decreased RD with age may be due to continuing myelina-tion because thickening of the myelin sheath will reduce perpen-dicular water diffusion.
In addition to age-related changes, our study demonstrated
FIG 3. Sagittal reconstruction of FA color maps of 2 overlapping slabs of the same subject as shown inFig 2. A, The cervical and upper thoracic regions (C1, arrow,to T5,arrowhead).B, The upper thoracic-through-conus regions (T4,arrow,to L1, arrowhead).
Table 1: Means of FA, MD, AD, and RD along the cervical and thoracic SC according to age groups
DTI Parameters
Age Groups (yr)
PValues
6–11 12–16
FA 0.54⫾0.09 0.58⫾0.10 .0193
MD 1.14⫾0.26 0.91⫾0.21 ⬍.0001
AD 1.88⫾0.38 1.58⫾0.38 ⬍.0001
[image:5.594.301.533.64.133.2]that diffusion characteristics are not consistent throughout the SC and are dependent on the cord level. The SC is greater in width and diameter in the cervical and lumbosacral regions, forming the cervical plexus and the lower thoracic lumbar–sacral plexus, the site of neurons that primarily supply the extremities.21These neu-rons represent GM that is higher in concentration compared with the remainder of the cord.21In the SC, the GM is a central
but-terfly-shaped structure surrounded by the WM. Additionally, the volume of WM and GM is different depending on the location within the SC. Goto and Otsuka22reported that the GM volume, on average, represents 18% of the SC at the anatomic level at the origin of the C2-through-C8 nerve root (the cervical region). The volume of GM represents 13.2% of the SC at the anatomic level at the origin of the T1-through-T12 nerve root (the
tho-6 7 8 9 10 11 12 13 14 15 16 17
0.2 0.3 0.4 0.5 0.6 0.7 0.8
A
FA = 0.4553 + 0.0091 [AGE] P < 0.0001, r2 = 0.0839
FRACTIONAL ANISOTROPY
AGE (YEARS)
6 7 8 9 10 11 12 13 14 15 16 17
0.0 0.5 1.0 1.5 2.0 2.5
B
MD = 1.4866 - 0.039 [AGE] P < 0.0001, r2 = 0.1962
MEAN DIFFUSIVITY
AGE (YEARS)
6 7 8 9 10 11 12 13 14 15 16 17
0.0 0.5 1.0 1.5 2.0 2.5 3.0 3.5 4.0
C
AD = 2.281 - 0.0461 [AGE] P < 0.0001, r2 = 0.1191
AXIAL DIFFUSIVITY
AGE (YEARS)
6 7 8 9 10 11 12 13 14 15 16 17
0.2 0.3 0.4 0.5 0.6 0.7 0.8 0.9
D
RD = 1.0900 - 0.035 [AGE] P < 0.0001, r2 = 0.2182
RADIAL DIFFUSIVITY
AGE (YEARS)
[image:6.594.54.528.45.442.2]FIG 4. Linear fit plots showing the relationship among FA (A), MD (B), AD (C), and RD (D) and age along the cervical and thoracic SC (C1 to mid-L1) in typically developing pediatric subjects.
Table 2: Means of FA, MD, AD, and RD according to different levels of the cervical and thoracic SC
DTI Parameters
Cord Divisions
CUP CMID CLOW TUP TMID TLOW
FAa 0.60⫾0.08 0.59⫾0.07 0.54⫾0.08 0.53⫾0.09 0.60⫾0.10 0.49⫾0.09
MDb 1.06⫾0.20 1.08⫾0.15 1.15⫾0.24 0.98⫾0.32 1.05⫾0.26 0.93⫾0.27
ADc 1.85⫾0.30 1.90⫾0.20 1.89⫾0.33 1.58⫾0.50 1.83⫾0.35 1.45⫾0.41
RDd 0.66⫾0.18 0.67⫾0.15 0.78⫾0.23 0.67⫾0.26 0.66⫾0.24 0.66⫾0.23
Note:—CUP indicates upper cervical cord; CMID, middle cervical cord; CLOW, lower cervical cord, TUP, upper thoracic cord; TMID, middle thoracic cord; TLOW, lower thoracic cord.
a
FA⫽CUP vs CMID:P⫽.3732; CUP vs CLOW:P⬍.0001; CMID vs CLOW:P⬍. 0001; TUP vs TMID:P⬍.0001; TUP vs TLOW:P⬍.0001; TMID vs TLOW:P⬍.0001. b
MD⫽CUP vs CMID:P⫽.1357; CUP vs CLOW:P⬍.0001; CMID vs CLOW:P⫽.0265; TUP vs TMID:P⬍.0001; TUP vs TLOW:P⫽.2665; TMID vs TLOW:P⬍.0001. c
AD⫽CUP vs TUP:P⬍.0001; CUP vs TLOW:P⬍. 0001; CUP vs TMID:P⫽.1485; CMID vs TUP:P⬍. 0001; CMID vs TMID:P⫽.0033; CMID vs TLOW:P⬍.0001; CLOW vs TUP:
P⬍.0001; CLOW vs TMID:P⫽.0158; CLOW vs TLOW:P⬍.0001. d
RD⫽CUP vs TUP:P⫽.2707; CUP vs TLOW:P⫽.9320; CUP vs TMID:P⫽.1044; CMID vs TUP:P⫽.0198; CMID vs TMID:P⫽.0048; CMID vs TLOW:P⫽.1774; CLOW vs TUP:
[image:6.594.51.535.488.559.2]racic region). The amount of WM decreases gradually in the caudal direction because the long ascending and descending pathways contain fewer axons at successively more caudal lev-els of the SC.21
When comparing DTI parameters at different locations of the cervical and lower thoracic regions, our study demonstrated sig-nificantly lower FA and higher MD values in the lower cervical cord compared with the upper cervical cord. Another study dem-onstrated that at the upper cervical cord, the right-to-left diame-ter of the SC and the area of the central GM are smaller compared with the lower cervical cord.23The relative lower cervical cord enlargement, which corresponds to the cervical plexus, is due to an increase in the GM/WM ratio. It has been reported that in adults, the central GM of the SC has lower FA and higher MD compared with the WM.24In our study, the larger central GM area in the lower cervical cord may be responsible for decreased FA and increased MD compared with the upper cervical cord. Decreased FA values in the lower thoracic cord compared with the upper thoracic cord may be due to the variations in the percentage of GM within different levels of the thoracic cord.
Diffusion in the healthy SC is highly anisotropic with trans-verse ADC values less than longitudinal ADC values.25 Anisot-ropy in the SC is due to diffusion barriers encountered as water moves perpendicular to the fibers. These barriers, such as the cell membrane and myelin sheath, result in low transverse ADC val-ues. As water diffuses longitudinally in the SC, these diffusion barriers are not encountered and hence longitudinal ADC is higher.25Our study also demonstrated higher AD values in the cervical and thoracic cord compared with RD values. It has been reported that the density and integrity of cytoskeletal proteins (microtubules and neurofilaments) affect longitudinal water dif-fusion.26Schwartz et al27demonstrated a positive correlation of longitudinal ADC with axon diameter in the normal rat cervical cord and explained that this was due to the inverse relationship between axon caliber and cytoskeletal protein density. These find-ings may explain our results of increased AD values in the upper, middle, and lower cervical cord, which may contain a higher per-centage of large-diameter axons compared with the upper, mid-dle, and lower thoracic cord. Because large axons have a decreased density of microtubules and neurofilaments, this may result in increased longitudinal water diffusion in the cervical cord. It has been observed in ex vivo studies that increased axonal diameter and decreased axonal density correlate with increased transverse diffusion in SC tracts.28In our study, larger axons in the lower cervical cord may explain the increased RD values compared with the thoracic cord.
DTI has proved to be a useful tool for examining sex differ-ences in the brain WM during childhood and adolescence29; how-ever, in the SC, these are not well-studied. We found no signifi-cant sex differences, when comparing males and females, along the cervical and thoracic SC. Our results are consistent with the findings of previous DTI studies of the maturing cervical SC4and brain maturation,30which also did not show any sex differences. These sex-related DTI findings in the SC need to be further inves-tigated to determine whether they hold up with larger sample sizes and, if so, to produce normative data for males and females of different ages.
As we have shown previously in the cervical SC, there was good-to-strong repeatability in DTI values.5,8It has also been re-ported that in adult cervical SC DTI, there is good intra- and interobserver variability.16In our current study, we have shown that within the cervical and thoracic SC, DTI values showed mod-erate-to-strong repeatability. These findings add to the existing evidence that DTI values for the normal SC are repeatable.
One of the limitations of the study was the use of manual ROI selection, which may have introduced partial volume contamina-tion from the CSF surrounding the cord. The ROIs drawn were conservative, to minimize this volume-averaging effect. In our study, because the DTI measurements were performed on the whole cord, the inclusion of GM and WM in the analysis might have affected the DTI values.31Currently, no automatic methods exist for delineating WM and GM from DTI SC images, and man-ual segmentation is cumbersome and time-consuming. There-fore, for future analysis, an automated or semiautomated seg-mentation method is required for accurately delineating the GM and WM in the SC. Another limitation of this study is the low number of subjects within different age groups and sex. Future work with more subjects is needed in these subgroups to establish normative DTI data of the pediatric cord. There was also hetero-geneity of the signal in many subjects at the edge of the coil and in the lower thoracic region, which potentially can be reduced with improved imaging techniques. In addition, we chose a section thickness of 6 mm to allow a maximal SNR of the imaging voxel while balancing the in-plane resolution and the number of sec-tions needed to scan the subject within a clinically acceptable time of acquisition per slab. This limitation could be overcome in the future by imaging the SC at a higher field strength, with improved radiofrequency coils and multiband DTI techniques, which will allow imaging small voxels while still maintaining a relatively short imaging time.
CONCLUSIONS
This study provides an initial understanding of DTI values of the SC relevant to age and sex and shows that obtaining repeatable DTI values of the entire cervical and thoracic cord in children is feasible.
ACKNOWLEDGMENTS
We thank Mahdi Alizadeh for helping with the manuscript preparation.
[image:7.594.55.284.63.159.2]Disclosures: Scott H. Faro—RELATED:Grant: National Institutes of Health–National Institute of Neurological Disorders and Stroke.* John Gaughan—RELATED: Consult-ing Fee or Honorarium: Temple University, National Institutes of Health R01
Table 3: Test-retest repeatability for each DTI parameter per the cervical and thoracic SC
DTI Parameters Level ICC (95% CI)
FA Cervical 0.86 (0.86–0.70)
Thoracic 0.85 (0.85–0.67)
MD Cervical 0.91 (0.91–0.79)
Thoracic 0.89 (0.90–0.73)
AD Cervical 0.91 (0.91–0.79)
Thoracic 0.80 (0.83–0.55)
RD Cervical 0.90 (0.90–0.77)
NS079635 (statistical consulting). Mary Jane Mulcahey—RELATED:Grant: National Institute of Neurological Disorders and Stroke *;Support for Travel to Meetings for the Study or Other Purposes: National Institute of Neurological Disorders and Stroke *;UNRELATED:Board Membership: President, American Spinal Injury Asso-ciation, no payment; Vice President, Pediatric Spine Foundation, no payment; Con-sultancy: Topics in Spinal Cord Rehabilitation, Comments: Associate Editor;
Grants/Grants Pending: Community Health Network Foundation,* Department of Defense,* Shriners Hospitals*;Royalties: Mac Keith Press (editor, book);Travel/ Accommodations/Meeting Expenses Unrelated to Activities Listed: Boston Reha-bilitation Outcomes Center (Visiting Scientist, 2015–2016). Feroze B. Mohamed—
RELATED:Grant: National Institutes of Health–National Institute of Neurological Disorders and Stroke.* *Money paid to the institution.
REFERENCES
1. Basser PJ.Inferring microstructural features and the physiological state of tissues from diffusion-weighted images.NMR Biomed1995; 8:333– 44CrossRef Medline
2. Van Hecke W, Leemans A, Sijbers J, et al.A tracking-based diffusion tensor imaging segmentation method for the detection of diffu-sion-related changes of the cervical spinal cord with aging.J Magn Reson Imaging2008;27:978 –91CrossRef Medline
3. Wang K, Song Q, Zhang F, et al.Age-related changes of the diffusion tensor imaging parameters of the normal cervical spinal cord.Eur J Radiol2014;83:2196 –202CrossRef Medline
4. Singhi S, Tekes A, Thurnher M, et al.Diffusion tensor imaging of the maturing paediatric cervical spinal cord: from the neonate to the young adult.J Neuroradiol2012;39:142– 48CrossRef Medline
5. Barakat N, Mohamed FB, Hunter LN, et al.Diffusion tensor imaging of the normal pediatric spinal cord using an inner field of view echo-planar imaging sequence.AJNR Am J Neuroradiol2012;33: 1127–33CrossRef Medline
6. Mohamed FB, Hunter LN, Barakat N, et al.Diffusion tensor imaging of the pediatric spinal cord at 1.5T: preliminary results.AJNR Am J Neuroradiol2011;32:339 – 45CrossRef Medline
7. Mulcahey MJ, Samdani AF, Gaughan JP, et al.Diagnostic accuracy of diffusion tensor imaging for pediatric cervical spinal cord injury. Spinal Cord2013;51:532–37CrossRef Medline
8. Mulcahey M, Samdani AF, Gaughan J, et al.Diffusion tensor imag-ing in pediatric spinal cord injury: preliminary examination of re-liability and clinical correlation. Spine (Phila Pa 1976)2012;37: E797– 803CrossRef Medline
9. Wintermark M, Coombs L, Druzgal TJ, et al; American College of Radiology Head Injury Institute.Traumatic brain injury imaging research roadmap.AJNR Am J Neuroradiol2015;36:E12–23CrossRef Medline
10. Finsterbusch J.Improving the performance of diffusion-weighted inner field-of-view echo-planar imaging based on 2D-selective ra-diofrequency excitations by tilting the excitation plane.J Magn Reson Imaging2012;35:984 –92CrossRef Medline
11. Middleton DM, Mohamed FB, Barakat N, et al.An investigation of motion correction algorithms for pediatric spinal cord DTI in healthy subjects and patients with spinal cord injury.Magn Reson Imaging2014;32:433–39CrossRef Medline
12. Chang LC, Jones DK, Pierpaoli C.RESTORE: robust estimation of tensors by outlier rejection.Magn Reson Med 2005;53:1088 –95
CrossRef Medline
13. DeVivo MJ, Vogel LC.Epidemiology of spinal cord injury in chil-dren and adolescents.J Spinal Cord Med2004;27(suppl 1):S4 –10
Medline
14. Conover WJ, Iman RL.Rank transformations as a bridge between parametric and nonparametric statistics.The American Statistician
1981;35:124 –29CrossRef
15. Shrout PE, Fleiss JL.Intraclass correlations: uses in assessing rater reliability.Psychol Bull1979;86:420 –28CrossRef Medline
16. Brander A, Koskinen E, Luoto TM, et al.Diffusion tensor imaging of the cervical spinal cord in healthy adult population: normative val-ues and measurement reproducibility at 3T MRI.Acta Radiol2014; 55:478 – 85CrossRef Medline
17. Uda S, Matsui M, Tanaka C, et al.Normal development of human brain white matter from infancy to early adulthood: a diffusion ten-sor imaging study.Dev Neurosci2015;37:182–94CrossRef Medline
18. Yoshida S, Oishi K, Faria AV, et al.Diffusion tensor imaging of nor-mal brain development. Pediatr Radiol2013;43:15–27 CrossRef Medline
19. Baumann N, Pham-Dinh D.Biology of oligodendrocyte and myelin in the mammalian central nervous system.Physiol Rev2001;81:871– 927Medline
20. Budde MD, Kim JH, Liang HF, et al.Toward accurate diagnosis of white matter pathology using diffusion tensor imaging.Magn Reson Med2007;57:688 –95CrossRef Medline
21. Campbell WW, DeJong RN.The spinal cord level.In:DeJong’s the Neurologic Examination.6th ed. Philadelphia: Lippincott Williams Wilkins; 2005:314 –24
22. Goto N, Otsuka N.Development and anatomy of the spinal cord. Neuropathology1997;17:25–31CrossRef
23. Barker GJ.Diffusion-weighted imaging of the spinal cord and optic nerve.J Neurol Sci2001;186(suppl 1):S45– 49CrossRef Medline
24. Bosma RL, Stroman PW.Characterization of DTI indices in the cer-vical, thoracic, and lumbar spinal cord in healthy humans.Radiol Res Pract2012;2012:143705CrossRef Medline
25. Schwartz ED, Hackney DB.Diffusion-weighted MRI and the evalu-ation of spinal cord axonal integrity following injury and treat-ment.Exp Neurol2003;184:570 – 89CrossRef Medline
26. Kinoshita Y, Ohnishi A, Kohshi K, et al.Apparent diffusion coeffi-cient on rat brain and nerves intoxicated with methylmercury. En-viron Res1999;80:348 –54CrossRef Medline
27. Schwartz ED, Cooper ET, Fan Y, et al.MRI diffusion coefficients in spinal cord correlate with axon morphometry.Neuroreport2005;16: 73–76CrossRef Medline
28. Takahashi M, Hackney DB, Zhang G, et al.Magnetic resonance mi-croimaging of intraaxonal water diffusion in live excised lamprey spinal cord.Proc Natl Acad Sci U S A2002;99:16192–96CrossRef Medline
29. Hermoye L, Saint-Martin C, Cosnard G, et al.Pediatric diffusion tensor imaging: normal database and observation of the white mat-ter maturation in early childhood.Neuroimage2006;29:493–504
CrossRef Medline
30. Perrin JS, Leonard G, Perron M, et al.Sex differences in the growth of white matter during adolescence. Neuroimage 2009;45:1055– 66
CrossRef Medline