ORIGINAL RESEARCH
INTERVENTIONAL
In Vitro Evaluation of Intra-Aneurysmal, Flow-Diverter-Induced
Thrombus Formation: A Feasibility Study
K. Gester, I. Lu¨chtefeld, M. Bu¨sen, S.J. Sonntag, T. Linde, U. Steinseifer, and XG. Cattaneo
ABSTRACT
BACKGROUND AND PURPOSE: Intracranial aneurysm treatment by flow diverters aims at triggering intra-aneurysmal thrombosis. By combining in vitro blood experiments with particle imaging velocimetry measurements, we investigated the time-resolved thrombus formation triggered by flow diverters.
MATERIALS AND METHODS: Two test setups were built, 1 for particle imaging velocimetry and 1 for blood experiments, both generating the same pulsatile flow and including a silicone aneurysm model. Tests without flow diverters and with 2 different flow-diverter sizes (diameter: 4.5 and 4.0 mm) were performed. In the blood experiments, the intra-aneurysmal flow was monitored by using Doppler sonography. The experiments were stopped at 3 different changes of the spatial extent of the signal.
RESULTS:No thrombus was detected in the aneurysm model without the flow diverter. Otherwise, thrombi were observed in all aneurysm models with flow diverters. The thrombi grew from the proximal side of the aneurysm neck with fibrin threads connected to the flow diverter and extending across the aneurysm. The thrombus resulting from the 4.0-mm flow diverter grew along the aneurysm wall as a solid and organized thrombus, which correlates with the slower velocities near the wall detected by particle imaging velocimetry. The thrombus that evolved by using the 4.5-mm flow diverter showed no identifiable growing direction. The entire thrombus presumably resulted from stagnation of blood and correlates with the central vortex detected by particle imaging velocimetry.
CONCLUSIONS: We showed the feasibility of in vitro investigation of time-resolved thrombus formation in the presence of flow diverters.
ABBREVIATIONS: FD⫽flow-diverter; PIV⫽particle imaging velocimetry
I
ntracranial aneurysm treatment by flow diverters (FDs) aims at blood clotting in the aneurysm, triggered by the reduction or elimination of intra-aneurysmal blood flow. This therapeutic ap-proach offers an alternative treatment for larger wide-neck aneu-rysms, in which coil embolization is associated with high recur-rence.1,2Otherwise, a longer delay to complete intra-aneurysmalthrombosis and documented cases of postprocedural bleeding3-5
suggest that the FD-driven mechanism of thrombus formation is
considerably different from that using coils. In previous studies, it has been hypothesized that aneurysm rupture occurring in pa-tients after treatment with FDs is a consequence of uncontrolled flow-driven clot formation resulting in thrombus-associated au-tolysis4 or mural destabilization of the aneurysm wall due to
thrombus evolution.6
The influence of FDs on hemodynamic properties was inves-tigated in several in vitro experiments by particle imaging veloci-metry (PIV). Especially, the influence of the geoveloci-metry of the an-eurysm,7,8the stent porosity,7,9-12the number of stents, and the
stent material8,13on intra-aneurysmal velocity fields was
exten-sively studied. All investigations were performed with water-glyc-erol mixtures as a blood analog fluid. The use of a transparent fluid is inevitable because PIV is an optical method, but it fore-stalls the possibility of investigate clotting effects. Therefore, be-cause the thrombus-growing process influences the flow behav-ior, PIV investigations only represent the flow conditions directly after the insertion of FDs.
The goal of our study was the in vitro investigation of
time-Received December 10, 2014; accepted after revision August 10, 2015.
From the Department of Cardiovascular Engineering (K.G., I.L., M.B., S.J.S., T.L., U.S.), Institute of Applied Medical Engineering, Helmholtz Institute–RWTH Aachen Uni-versity, Aachen, Germany; and Acandis GmbH & Co KG (G.C.), Pforzheim, Germany. This project was funded by the German Federal Ministry for Economic Affairs and Energy.
Please address correspondence to Kathrin Gester, PhD, Department of Cardio-vascular Engineering, Institute of Applied Medical Engineering, Helmholtz Insti-tute–RWTH Aachen University, Pauwelsstr 20, D-52074, Aachen, Germany; e-mail: [email protected]
Indicates open access to non-subscribers at www.ajnr.org
resolved formation of thrombi triggered by FDs. Although bio-logic mechanisms, triggered by the aneurysm wall, are not de-picted in the new in vitro model, the location and shape of thrombus during the forming and growing process, as well as the composition of the thrombus, were investigated for 2 different FD configurations. Moreover, we correlated the results with PIV measurements.
MATERIALS AND METHODS
In Vitro Aneurysm Model and Flow-Loop Setup
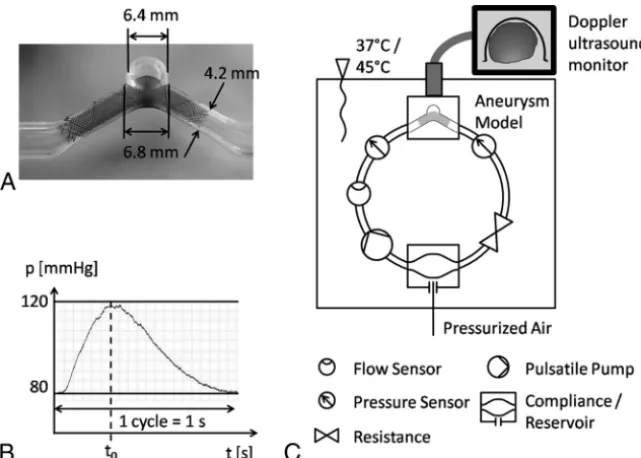
A simplified geometry of a lateral aneurysm was used in this study to limit the geometric variables. The aneurysm was spheric with an inner diameter of 6.4 mm and an oval neck of 6.8⫻5.4 mm. These dimensions are in agreement with those in the clinical lit-erature.14The parent vessel had an inner diameter of 4.2 mm with
an angle of 120° at the aneurysm neck (Fig 1A). The aneurysm models were blocks, made from silicone by a casting technique using male casts of the aneurysm model manufactured by rapid prototyping (Objet Eden 350V; Stratasys, Eden Prairie, Minne-sota). We used 2 different kinds of silicone: Elastosil RT 601 (Wacker Chemie, Munich, Germany) for PIV measurements due to opacity requirements and Elastosil RT 625 (Wacker Chemie) for blood experiments due to hemocompatibility. For all models, the FD Derivo Embolization Device (Acandis GmbH & Co. KG, Pforzheim, Germany) with inner diameters of 4.5 and 4.0 mm (called FD-4.5 and FD-4.0) was used. The device is composed of 24 nitinol wires with a diameter of 40m and an electropolished and annealed surface, characterized by approximately a 50-nm thin layer of oxides and nitrides/oxynitrides. The wires at the dis-tal end of the FD run in loops back to the proximal end, where the wires end openly, resulting in a mesh of 2⫻24 wires.
For the PIV measurements, 3 models were used (empty and loaded with FD-4.5 and FD-4.0, respectively). For blood experi-ments, we used 10 models: 4 empty, 2 loaded with FD-4.5, and 4 loaded with FD-4.0. The FD-4.5 was oversized and axially
stretched, which led to an increase of cell size, whereas the FD-4.0 was fitted with an outer diameter of approximately 4.2 mm within the parent vessel without ra-dial compression. With a braiding angle of 75° in the completely expanded state, mean porosities within the model were 72% and 65% for FD-4.5 and FD-4.0, respectively, according to geometric cal-culation, whereas manual loading of the devices in the model led to heterogene-ities and variability of local porosity. The models were placed in a flow loop, which consisted of a pulsatile-operated blood pump (deltastream DP3; Medos Medizintechnik, Stolberg, Germany) and a compliance/reservoir (Fig 1C). All components were connected by PVC tubing and connectors made of polycar-bonate. Pump, compliance pressure, and resistance were adjusted to achieve an average volume flow rate of
V˙⫽220mL
min, according to a flow rate between that of the internal carotid artery and the media carotid artery15-17and a pressure curve behind the pump between 80 and
120 mm Hg, as shown inFig 1B. The average volume flow rate (T110; Transonic Systems, Ithaca, New York) was recorded di-rectly behind the pump; and the pressure curve (SP844; Mem-scap, Crolles, France) upstream, downstream of the aneurysm model, and both was accordingly adjusted. The intraluminal mean Reynolds number, Womersley number, and pulsatility in-dex as defined in Hoi et al,15were 358, 6.0, and 1.19, respectively.
The whole test setup was temperature-controlled at 45°C for PIV measurements and 37°C for blood experiments.
PIV Measurements
A PIV system (Dantec Dynamics, Skovlunde Denmark) was added to the test setup described above. The PIV system included an Nd:Ylf laser (Pegasus; NewWave, Fremont, California), a light sheet optic (80X70, Dantec Dynamics, Skovlundet, Denmark), and a CMOS camera (1280⫻1024 pixels, Redlake, X3 mol/L-M-4; IDT, Tallahassee, Florida) positioned perpendicular to the laser light sheet and a traverse for microaccurate movement of the whole system.
A mixture of glycerol and distilled water (55.8%– 44.2% by weight) at 45°C was used as working fluid. At these parameters, the refractive index matches that of silicone (nsilicone⫽nwater/glycerol⬇
1.404); this avoids distortion of the recorded images. Additionally, the viscosity of this fluid [water-glycerol⫽(3.5395⫾0.0417) mPas]
corresponds to that of high sheared blood (blood⫽3.6 mPas),
allowing similar flow properties.18
Neutrally buoyant polystyrene tracer particles, 10m in diameter and containing Rhodamine B (MF-RhB-polymer particles; Microparticles, Berlin, Germany), were added to the water-glycerol mixture. The particles were illuminated by a laser light sheet, and particle images were captured with the
FIG 1. A, Silicone model with an inserted FD.B, Pressure curve upstream of the aneurysm model.
[image:2.594.56.377.46.275.2]camera. The maximum fluorescence emission wavelength of the tracer particles was 584 nm. With a suitable filter, the laser light with a wavelength of 527 nm could be filtered to increase image quality. Ten pump cycles were recorded. Measurements without the FD were recorded in “single image mode” with a frequency of 100 Hz, and measurements with the FD in dou-ble-image mode with a time difference between the 2 images varied from 100 to 950s. To generate the velocity fields, we divided the recorded images into small areas of interrogation. Using a cross-correlation algorithm, we calculated displace-ment vectors for each area of interrogation for subsequent im-ages. The resulting vector fields had a resolution of 70⫻70
m. They were averaged for the 10 pump cycles by using the software Matlab (MathWorks, Natick, Massachusetts). The ve-locity fields were recorded in the sagittal and transverse planes of the aneurysm, the last 3.2 mm below the top of the aneu-rysm. In this study, we concentrated on the velocity field at the systolic pressure peak, corresponding to time t0of the pressure
wave (Fig 1B).
Blood Experiments
All parts of the test setup were cleaned for 1 hour according to a standardized in-house cleaning procedures with 40% 2-propanol at room temperature and rinsed with distilled water and saline solution.
The blood was collected from the cervical artery of slaughter-house pigs. It was immediately anticoagulated with Clexane mul-tidose (Sanofi-Aventis Pharma Deutschland, Frankfurt, Ger-many) with concentrations of 2000 or 4000 IU/L. Because coagulation activity is very dependent on the blood used, concen-tration was varied during the study to allow a visualization of thrombus formation in a feasible time window of a maximum duration of 12 hours. However, the influence of the anticoagulant concentration on the thrombus formation was not an aim of this
study, and only the results of experi-ments with the same anticoagulant con-centration were compared. Blood count was determined before and after the blood experiments by using a hematol-ogy analyzer (Celltac-␣MEK-6450; Ni-hon Kohden, Tokyo, Japan). Through-out the experiments, the flow in the aneurysm was monitored with the help of a color Doppler sonography system (Vivid I; GE Healthcare, Milwaukee, Wisconsin) by recording changes in the Doppler signal in magnitude and spatial expansion. The sonographic probe was placed on top of the silicone model, al-lowing monitoring of the whole aneu-rysm region (Fig 1C).
To analyze the structure of the FD-induced thrombi at different growing phases, 3 study end points were defined on the basis of the changes in the spatial extent of the signal: 1) beginning, 2) ap-proximately 50%, and 3) nearly com-plete reduction of the spatial extent of the signal. For 2 FD-4.0s, the tests were stopped at the first end point to investigate the early anchoring of the thrombus to the FD. Additionally, FD-4.5 and FD-4.0 were both investigated at the second and third end points to compare the development of the resulting thrombi for different mesh porosities. For the empty models, in which no thrombus formation was expected, 2 end points were defined at 5 and 12 hours after starting the experi-ment. After we reached each end point, the time was recorded, the blood flow was interrupted, and the aneurysm model was rinsed with 100 mL of phosphate buffer solution (pH⫽7.4), preserved in formaldehyde (4%) for 24 hours, and dehydrated in ascending concentrations of propanol (30%, 50%, 70%, 90%, 100%, 100%). Finally, the silicone model was opened, and pictures were taken. The thrombi arising at the third end point were taken out and embedded in paraffin; sections were cut (HM 360; Thermo Fisher Scientific, Waltham, Massachusetts) and stained with H&E for histology.
RESULTS
PIV Measurements
The velocity fields for the systolic flow, recorded in the sagittal and transverse planes, are shown inFig 2. Without the FD, the fluid entered the aneurysm distally and moved along the aneurysm wall until leaving it at the proximal side on the sagittal plane. The velocities at the distal side were higher than those at the proximal side. The area of the slowest velocities was close to the center of the aneurysm, where a vortex occurred. On the transverse plane, the velocity field was irregular. The maximal flow velocity, detected on the transverse plane, was 0.14 m/s. A similar velocity field on the sagittal plane was observed in the model with FD-4.5. How-ever, the maximum velocities were reduced to 0.04 m/s. The vor-tex area with the slowest velocities within the aneurysm was smaller and closer to the parent vessel. In the transverse plane, a
[image:3.594.55.373.54.297.2]very irregular and symmetric velocity field occurred, with a vortex in the distal area of the aneurysm extending across the whole neck width. The FD-4.0 led to a different velocity profile, with the high-est velocities appearing symmetric at both distal and proximal sides and closer to the FD compared with both previous models.
In addition, in this model, the fluid en-tered the aneurysm on the distal side. Furthermore, maximum flow velocities were reduced to 0.005 m/s. The velocity field in the transverse plane was much more symmetric than that without the FD and with FD-4.5, with significant re-duction of the velocities.
Blood Experiments
An overview of the performed experi-ments is listed in theTable.
Four models without FDs were tested with anticoagulant concentra-tions of 2000 IU/L (O-A, O-C) and 4000 IU/L (O-B, O-D). No signal change was detected, so the blood flow was inter-rupted at the end points of 5 hours (O-A, O-B) and 12 hours (O-C, O-D). No thrombi were detected after the models were rinsed.
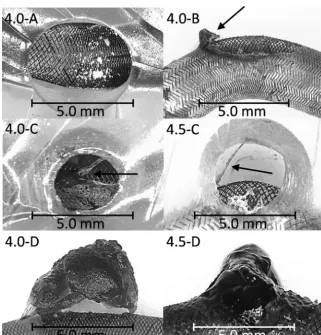
In experiments with the first end point (4.0-A, 4.0-B), either no throm-bus or the beginning of a thromthrom-bus at the proximal side was found in the neck area (Fig 3). Second end point experiments (4.0-C, 4.5-C) led to a fi-brin network, which anchored to the FD at the proximal side of the rysm and extended across the aneu-rysm to the upper distal wall (Fig 3). This was observed for both FDs, whereas it was more pronounced for FD-4.0. When the sonography signal no longer existed (4.0-D, 4.5-D), a red cap-shaped thrombus could be ob-served for the FD-4.0. The thrombus had fibrin strands con-nected to the proximal part of the FD (Fig 3) but showed a gap to the rest of the FD surface, which remained patent. In com-parison, the thrombus resulting from the FD-4.5 appeared as erythrocyte-rich, which almost completely filled the aneurysm.
FIG 3. Thrombi after the blood experiments. Experiments 4.0-A and 4.0-B show no thrombus or the beginning of a thrombus; 4.0-C and 4.5-C show a fibrin network, anchored at the proximal side of the aneurysm in the FD and extended across the aneurysm up to the upper distal wall; 4.0-D shows a red cap-shaped thrombus that has fibrin strands connected to the proximal part of the FD; and 4.5-D shows an apparently erythrocyte-rich thrombus with a very soft consistency, which almost completely fills the aneurysm. Degree of magnification: 5⫻(left images), 40⫻(right images).
Overview of the performed blood experiment
Name of Triala FD
Clexane Concentration
(IU/L)
Platelet Count, Start of Trial
(103/L)
Platelet Count, End of Trial
(103/L)
Hematocrit Value, Start of
Trial (%)
Hematocrit Value,
End of Trial (%) Duration
Qualitative Spatial Extent of
the Doppler Signal at End of
Trialsb
O-A None 2000 205 220 41.3 39.5 5 h 2 min
O-B None 4000 220 211 45.2 44.3 5 h 1 min
O-C None 2000 212 213 39.2 46.4 12 h 2 min
O-D None 4000 214 377 41.3 15.0 12 h 4 min
4.0-A FD-4.0 2000 235 345 42.6 20.4 4 h 9 min
4.0-B FD-4.0 2000 340 290 38.7 40.8 11 h 58 min
4.0-C FD-4.0 2000 270 225 38.7 40.1 3 h 4 min
4.0-D FD-4.0 4000 245 250 40.1 42.1 12 h 42 min
4.5-C FD-4.5 2000 270 355 44.2 38.0 11 h 10 min
4.5-D FD-4.5 4000 265 295 36.3 31.8 9 h 51 min
a
O-A and O-B are after 5 hours; O-C and O-D are after 12 hours; 4.0-A and 4.0-B are the first end point; 4.0-C and 4.5-C are the second end point; and 4.0-D and 4.5-D indicate no sonography signal at the end of the trial (third end point).
b
[image:4.594.54.376.248.583.2]After we removed the silicone model, the thrombus collapsed because it had a very soft consistency.
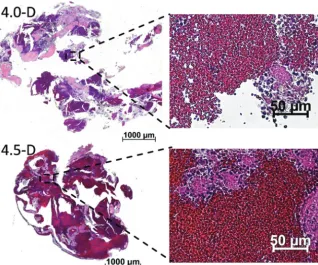
The sections of both thrombi showed a similar structure (Fig 4). Fibrin- and platelet-rich areas and erythrocyte-rich areas could be identified and could be clearly distinguished from each other. The sections of the thrombus that developed in the exper-iment with FD-4.5 showed a larger amount of erythrocyte-rich areas in comparison with the thrombus from FD-4.0. However, even here, fibrin- and platelet-rich areas were clearly visible. In all trials with FDs, a thin layer of thrombi on the FD was observed. Mostly, the thrombi appeared as white, fibrin- and platelet-rich and accumulated partially between the stent struts of the FD; but also red, erythrocyte-rich areas could be found sporadically (4.0-B, 4.0-C).
The blood values (Table) of the individual experiments were within the measurement accuracy of the blood count system and the expected change of blood values in an in vitro experiment. However, in 2 experiments, the hematocrit value dropped notice-ably during the experiment (O-D and 4.0-A), and in 3 experi-ments, the platelet count increased (O-D, 4.0-A, and 4.5-C).
DISCUSSION
Many in vitro PIV studies investigated the influence of FDs on hemodynamic properties,7-13because this method is established
for measuring flow behavior. However, when using a water-glyc-erol mixture, which is transparent and thus enables PIV measure-ments, one disregards the thrombus formation and its influence on the flow. Therefore, the PIV measurement only represents the flow conditions directly after the insertion of FDs. Moreover, the influence of the FDs on the thrombus formation was further in-vestigated in animal trials.19-22However, the dynamics of
intra-aneurysmal thrombosis cannot be ob-served in the follow-up period, which takes several weeks, because blood flow cannot be abruptly stopped at defined phases of thrombus formation. In vitro blood experiments allow arbitrarily ac-celerating thrombus formation by ap-propriate anticoagulant concentrations so that we can continuously visualize the different phases of formation and abruptly stop the experiment for throm-bus observation based on visualization. We combined PIV measurements and in vitro blood experiments monitored by Doppler sonography for the investiga-tion of velocity fields and thrombus for-mation in silicone aneurysm models.
In the blood experiments, both FDs caused thrombus formation in the aneu-rysm model in contrast to the experi-ments with empty aneurysm models. We conjecture that the material triggers the thrombus formation because fibrin-and platelet-rich thrombi were present on the FD surface before any thrombus in the aneurysm was observed. There-fore, blood flow could play an important role in the mechanism of thrombus formation because the thrombi prevalently arose at the same side of the FD and devel-oped in a similar direction. Experiments that were stopped at the first end point showed that the thrombi formation begins at the proximal side of the aneurysm neck. Fibrin threads with entan-gled platelets were connected to both FDs and extended across the aneurysm. We presume a combination of flow- and surface-in-duced coagulation because the velocities on the proximal side were the slowest and the mesh of the FD is a good anchorage point.
After the FDs were anchored on the proximal side of the aneurysm, the further course of thrombi formation was differ-ent for both FDs with differdiffer-ent sizes and thus porosity. The thrombus, resulting from the FD-4.0 with lower porosity, grew along the aneurysm wall as a solid and organized thrombus with fibrin and erythrocytes included. The thrombus seemed to develop against flow direction detected by PIV, which was from distal to proximal, in the region with lower and uniform velocities. At the neck of the aneurysm, where velocities were higher in PIV, a small thrombus-free gap was observed. The thrombus that evolved when using the FD-4.5 showed no iden-tifiable growing direction. The entire thrombus presumably resulted from stagnation of blood after the formation of fibrin through the aneurysm because it was not very stable or very erythrocyte-rich. This finding is supported by the microtome sections, which showed clearly defined fibrin areas and areas of erythrocytes loosely next to each other and correlate with the central vortex detected by PIV.
The noticeable decrease of the hematocrit value and the simulta-neous increase in platelet count indicates hemolysis in the circuit.
[image:5.594.58.377.48.313.2]The blood count device identifies the individual cell types by their sizes; therefore, cell fragments of destroyed erythrocytes are incor-rectly identified as platelets. The hemolysis is probably caused by the pump.
Limitations
In the PIV test setup, the particles are illuminated by a laser light sheet that has a thickness of approximately 1 mm. Velocity com-ponents vertical to that plane are not detected and considered. Furthermore, in this study, only velocity components at the sys-tolic pressure peak were considered and correlated to the results of blood experiments. Otherwise, the velocity fields during the whole pulsatile cycle showed similar profiles despite lower veloc-ities (data are not included in this work).
With the blood experiments, it was possible to investigate the occlusion of an aneurysm after insertion of an FD. The duration of the experiment until thrombus formation was adjusted by an-ticoagulant concentration. The maximum experiment duration was limited to approximately 12 hours in an attempt to limit the effect of hemolysis, particularly by the use of the pump. Moreover, in the experiments without FDs, no coagulation occurred after the 12-hour test period. Clinical studies report that the aneurysm is never closed by a thrombus at end-of-procedure angiography— that is, after 1 or 2 hours,23,24while at 6-month follow-up
angiog-raphy, complete occlusion was found in 68%–94% of pa-tients.23,25-31Although it is difficult to judge when the thrombus
formation begins in patients, we suppose that the process is strongly accelerated in the in vitro setup, which potentially influ-ences clotting mechanisms.
Dosed anticoagulation by means of Clexane aimed to allow the in vitro use of blood for several hours and does not depict the clinical standard of antiplatelet therapy with aspirin and clopidogrel.
We set both test setups (PIV and blood), with and without FD, to the same flow and pressure conditions and thus neglected the effect of FDs on flow within the parent vessel. In addition, vessel elasticity was neglected by using nearly rigid silicone blocks. Using standardized aneurysm geometry, we did not consider the effect of complex aneurysm geometry on flow pathways.
Our model does not consider the influence of real vessel biol-ogy and, in particular, endothelial cells on flow. First, progressive endothelialization of the FD structure would lead to a decrease in pore size.32Second, clotting mechanisms triggered by endothelial
cells are not reproduced in the silicone model. By use of FDs, flow deceleration leads to a decrease of shear stress at the aneurysm wall, which is responsible for endothelial cell–induced release of proadhesive and prothrombotic mediators.33
In this test series only a limited amount of blood experiments were performed to demonstrate the feasibility of the test setup. To obtain a statistically significant comparison between different FDs, a larger number of experiments are required.
CONCLUSIONS
In this study, we showed the feasibility of intra-aneurysmal thrombus formation in vitro, comparing 2 different FD sizes with an empty model and correlating the results with PIV measure-ments. The combination of both methods can potentially
im-prove the understanding of the dynamics of thrombus formation. Furthermore, thrombosis investigation in patient-specific models could also support the treatment decision or device-sizing. Poten-tial improvements of the in vitro setup and extensions of this research field are a more detailed life detection of thrombus for-mation by MR imaging and the development of a transparent and coagulable PIV fluid, such as a modified platelet-rich plasma.
Disclosures: Kathrin Gester, Ines Lu¨chtefeld, Martin Bu¨sen, Simon Johannes Sonntag, Torsten Linde, Ulrich Steinseifer—RELATED:Grant: This project was funded by the German Federal Ministry for Economic Affairs and Energy.* Giorgio Cattaneo—
RELATED:Grant: Federal Ministry for Economic Affairs and Energy*;UNRELATED: Employment: Acandis GmbH & Co KG;Grants/Grants Pending: Federal Ministry for Economic Affairs and Energy.* *Money paid to the institution.
REFERENCES
1. Byrne JV, Beltechi R, Yarnold JA, et al.Early experience in the treat-ment of intra-cranial aneurysms by endovascular flow diversion: a multicentre prospective study.PLoS One2010;5:e12492CrossRef Medline
2. Becske T, Kallmes DF, Saatci I, et al.Pipeline for uncoilable or failed aneurysms: results from a multicenter clinical trial.Radiology2013; 267:858 – 68CrossRef Medline
3. Cebral JR, Mut F, Raschi M, et al.Aneurysm rupture following treat-ment with flow-diverting stents: computational hemodynamics analysis of treatment. AJNR Am J Neuroradiol 2011;32:27–33
CrossRef Medline
4. Kulcsa´r Z, Houdart E, Bonafe´ A, et al.Intra-aneurysmal thrombosis as a possible cause of delayed aneurysm rupture after flow-diver-sion treatment.AJNR Am J Neuroradiol2011;32:20 –25CrossRef Medline
5. Pereira VM, Brina O, Delattre BMA, et al.Assessment of intra-aneu-rysmal flow modification after flow diverter stent placement with four-dimensional flow MRI: a feasibility study.J Neurointerv Surg
2014 Oct 3. [Epub ahead of print]CrossRef Medline
6. Hampton T, Walsh D, Tolias C, et al.Mural destabilization after aneurysm treatment with a flow-diverting device: a report of two cases.J Neurointerv Surg2011;3:167–71CrossRef Medline
7. Augsburger L, Farhat M, Reymond P, et al.Effect of flow diverter porosity on intraaneurysmal blood flow.Klin Neuroradiol2009;19: 204 –14CrossRef Medline
8. Roszelle BN, Gonzalez LF, Babiker MH, et al.Flow diverter effect on cerebral aneurysm hemodynamics: an in vitro comparison of tele-scoping stents and the Pipeline.Neuroradiology 2013;55:751–58
CrossRef Medline
9. Seong J, Wakhloo AK, Lieber BB.In vitro evaluation of flow divert-ers in an elastase-induced saccular aneurysm model in rabbit.J Bio-mech Eng2007;129:863–72CrossRef Medline
10. Yu CH, Matsumoto K, Shida S, et al.A steady flow analysis on a cerebral aneurysm model with several stents for new stent design using PIV.J Mechanical Science and Technology2012;26:1333– 40
CrossRef
11. Bouillot P, Brina O, Ouared R, et al.Particle imaging velocimetry evaluation of intracranial stents in sidewall aneurysm: hemody-namic transition related to the stent design. PLoS One2014;9: e113762CrossRef Medline
12. Bouillot P, Brina O, Ouared R, et al.Hemodynamic transition driven by stent porosity in sidewall aneurysms.J Biomech2015;48:1300 – 09
CrossRef Medline
13. Dorn F, Niedermeyer F, Balasso A, et al.The effect of stents on intra-aneurysmal hemodynamics: in vitro evaluation of a pulsatile side-wall aneurysm using laser Doppler anemometry.Neuroradiology
2011;53:267–72CrossRef Medline
14. Chalouhi N, Starke RM, Yang S, et al.Extending the indications of flow diversion to small, unruptured, saccular aneurysms of the an-terior circulation.Stroke2014;45:54 –58CrossRef Medline
flow rate waveforms at the carotid bifurcations of older adults.
Physiol Meas2010;31:291–302CrossRef Medline
16. Zhao M, Amin-Hanjani S, Ruland S, et al.Regional cerebral blood flow using quantitative MR angiography.AJNR Am J Neuroradiol
2007;28:1470 –73CrossRef Medline
17. Hendrikse J, van Raamt AF, van der Graaf Y, et al.Distribution of cerebral blood flow in the circle of Willis.Radiology2005;235: 184 – 89CrossRef Medline
18. Brown RI.The physics of continuous flow centrifugal cell separa-tion.Artif Organs1989;13:4 –20CrossRef Medline
19. Ahlhelm F, Roth C, Kaufmann R, et al.Treatment of wide-necked intracranial aneurysms with a novel self-expanding two-zonal en-dovascular stent device.Neuroradiology2007;49:1023–28CrossRef Medline
20. Kallmes DF, Ding YH, Dai D, et al.A new endoluminal, flow-dis-rupting device for treatment of saccular aneurysms.Stroke2007;38: 2346 –52CrossRef Medline
21. Simgen A, Ley D, Roth C, et al.Evaluation of a newly designed flow diverter for the treatment of intracranial aneurysms in an elastase-induced aneurysm model, in New Zealand white rabbits. Neurora-diology2014;56:129 –37CrossRef Medline
22. Wang K, Huang Q, Hong B, et al.Correlation of aneurysm occlusion with actual metal coverage at neck after implantation of flow-di-verting stent in rabbit models. Neuroradiology 2012;54:607–13
CrossRef Medline
23. Wagner A, Cortsen M, Hauerberg J, et al.Treatment of intracranial aneurysms: reconstruction of the parent artery with flow-diverting (Silk) stent.Neuroradiology2012;54:709 –18CrossRef Medline
24. Fischer S, Vajda Z, Perez MA, et al.Pipeline embolization device (PED) for neurovascular reconstruction: initial experience in the treatment of 101 intracranial aneurysms and dissections. Neurora-diology2012;54:369 – 82CrossRef Medline
25. Lubicz B, Collignon L, Raphaeli G, et al.Flow-diverter stent for the
endovascular treatment of intracranial aneurysms: a prospective study in 29 patients with 34 aneurysms.Stroke2010;41:2247–53
CrossRef Medline
26. Piano M, Valvassori L, Quilici L, et al.Midterm and long-term fol-low-up of cerebral aneurysms treated with flow diverter devices: a single-center experience. J Neurosurg 2013;118:408 –16 CrossRef Medline
27. Saatci I, Yavuz K, Ozer C, et al.Treatment of intracranial aneurysms using the Pipeline flow-diverter embolization device: a single-cen-ter experience with long-single-cen-term follow-up results.AJNR Am J Neuro-radiol2012;33:1436 – 46CrossRef Medline
28. Ringelstein A, Schlamann M, Goericke SL, et al.3-year follow-up after endovascular aneurysm treatment with Silk® flow diverter[in German].Rofo2013;185:328 –32CrossRef Medline
29. Cinar C, Bozkaya H, Oran I.Endovascular treatment of cranial an-eurysms with the Pipeline flow-diverting stent: preliminary mid-term results.Diagn Interv Radiol2013;19:154 – 64CrossRef Medline
30. De Vries J, Boogaarts J, Van Norden A, et al.New generation of flow diverter (Surpass) for unruptured intracranial aneurysms: a pro-spective single-center study in 37 patients.Stroke2013;44:1567–77
CrossRef Medline
31. Maimon S, Gonen L, Nossek E, et al.Treatment of intra-cranial aneurysms with the SILK flow diverter: 2 years’ experience with 28 patients at a single center.Acta Neurochir (Wien)2012;154:979 – 87
CrossRef Medline
32. Kadirvel R, Ding YH, Dai D, et al.Cellular mechanisms of aneurysm occlusion after treatment with a flow diverter.Radiology2014;270: 394 –99CrossRef Medline